Indicatori
Updated:
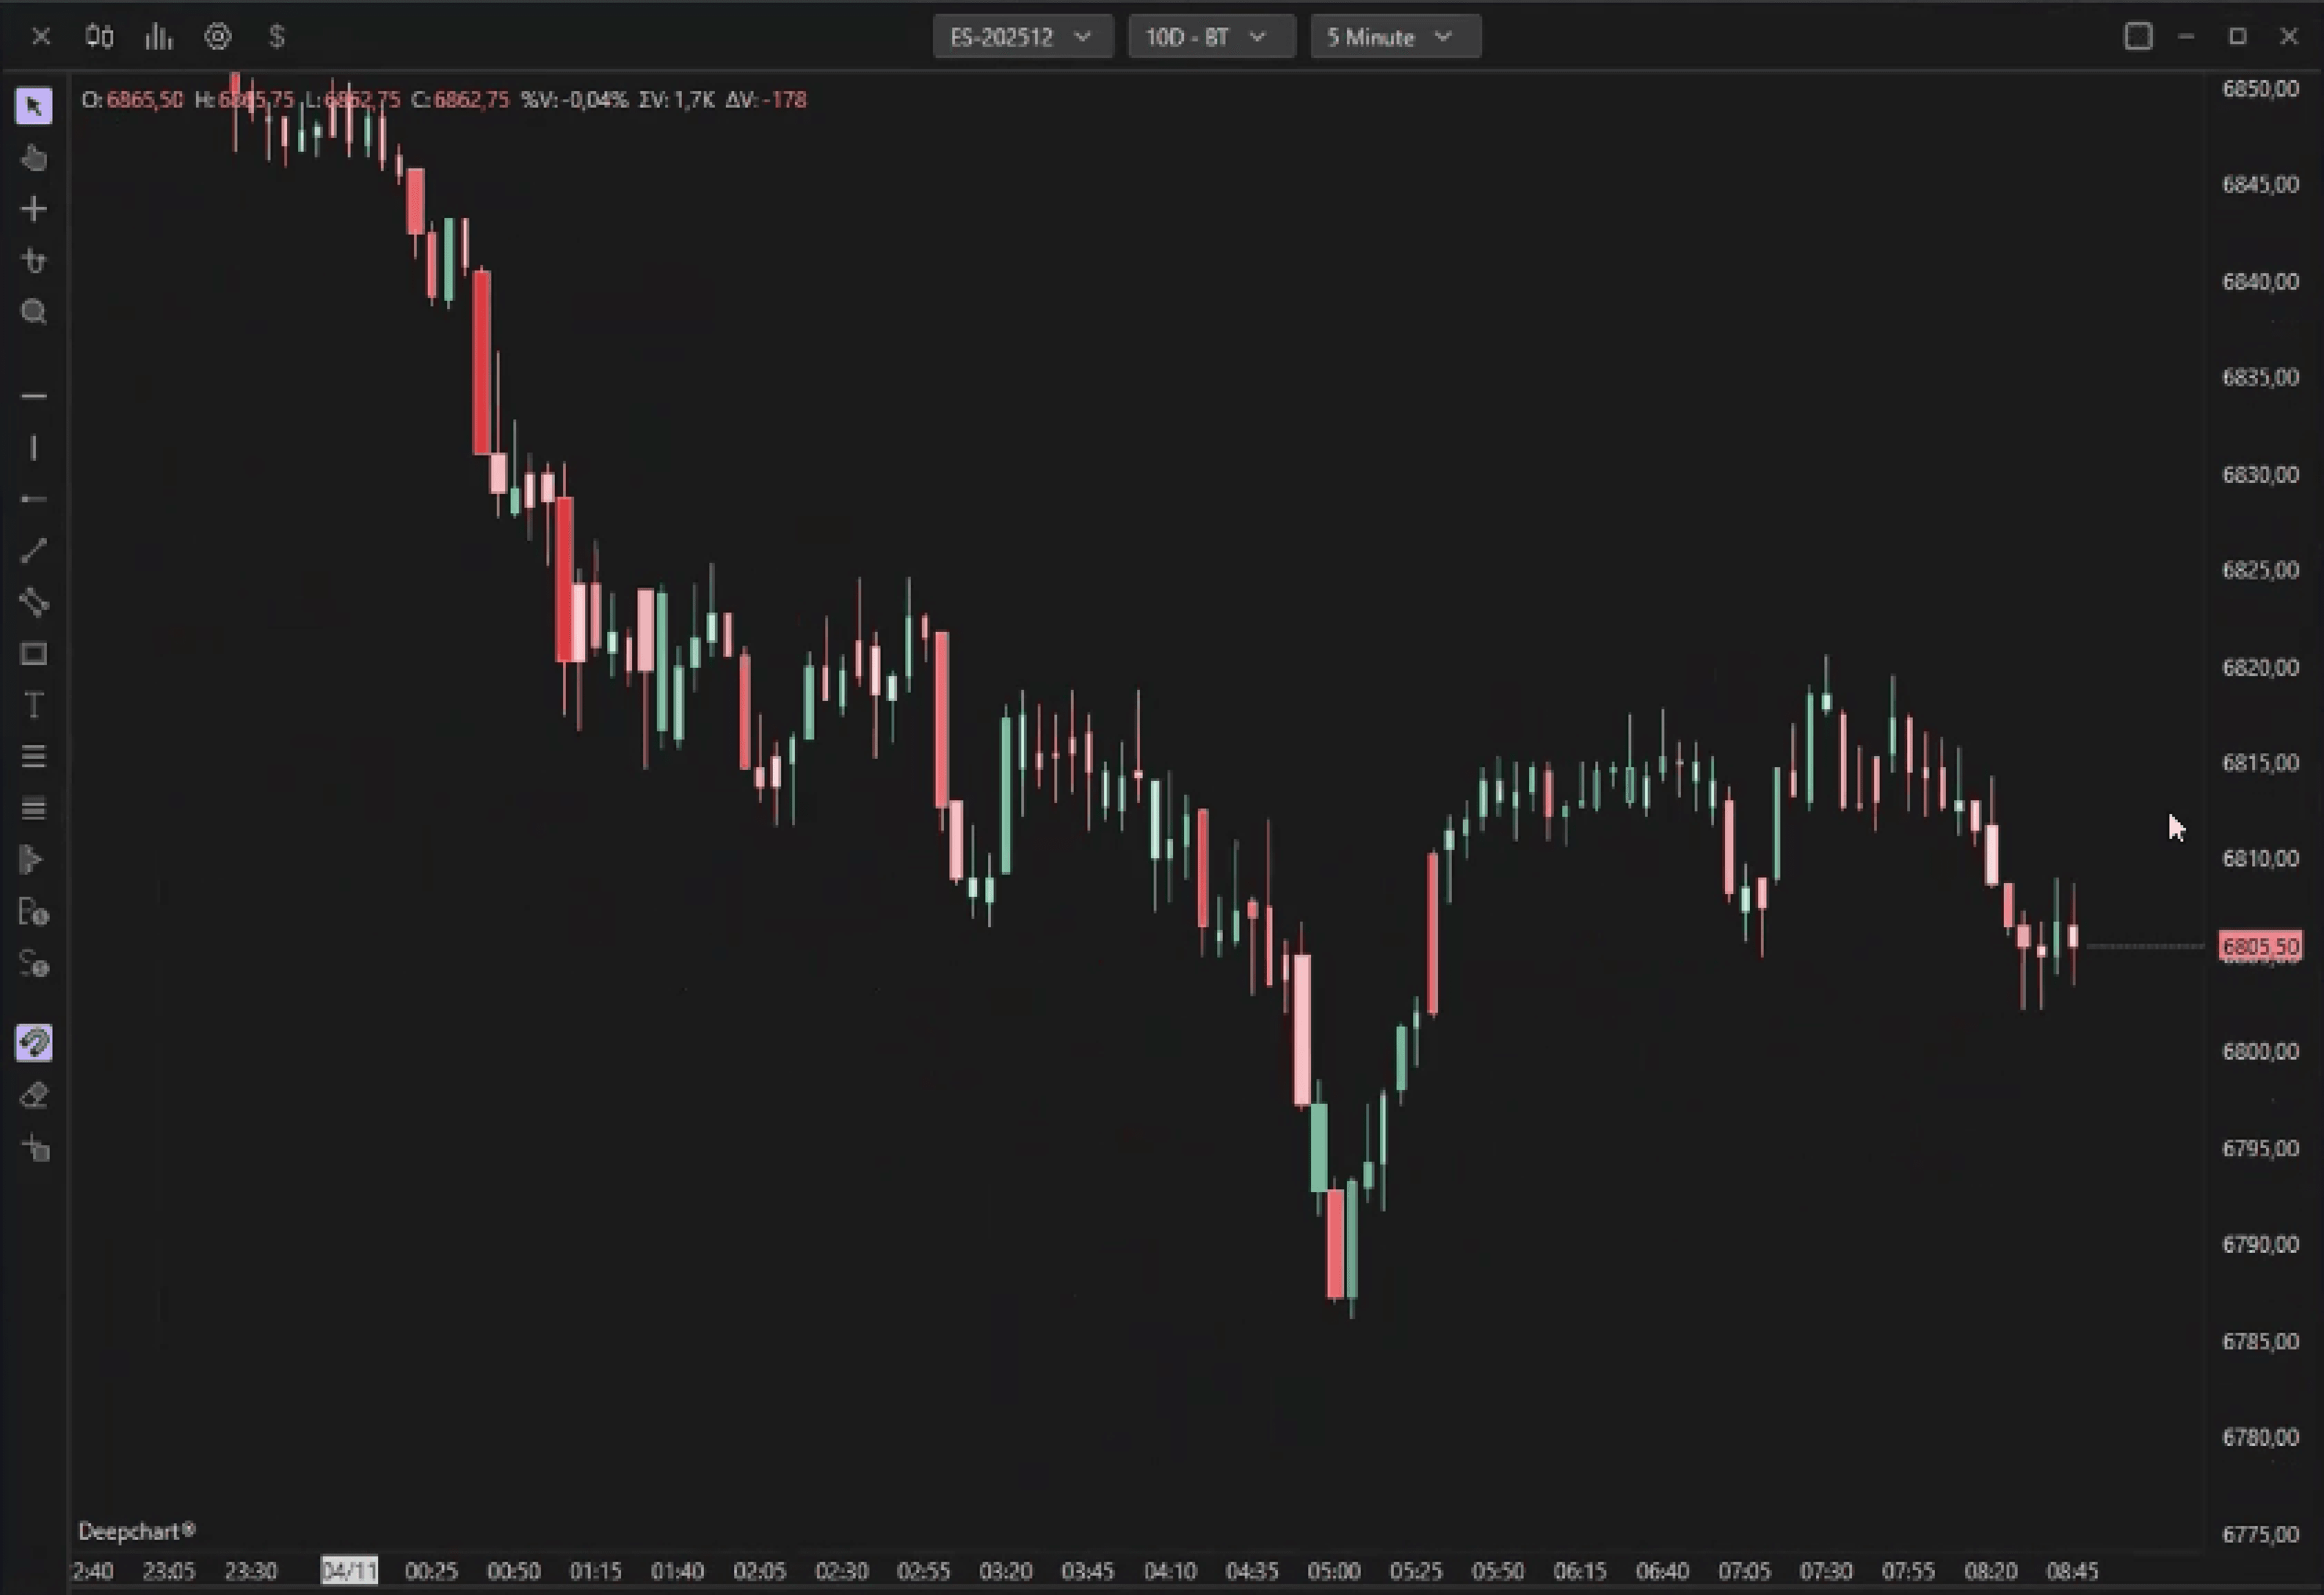
Il Price Chart in DeepCharts — che sia visualizzato come un candlestick o come un grafico a linee — è un indicatore che ti aiuta a visualizzare le transazioni storiche di compratori e venditori in base al book ordini.
Puoi personalizzare completamente l'aspetto di questa visualizzazione usando le opzioni disponibili nelle impostazioni del grafico.
Quando fai clic sul pulsante Candlestick nella barra superiore, appare un menu a discesa, come mostrato qui sotto:
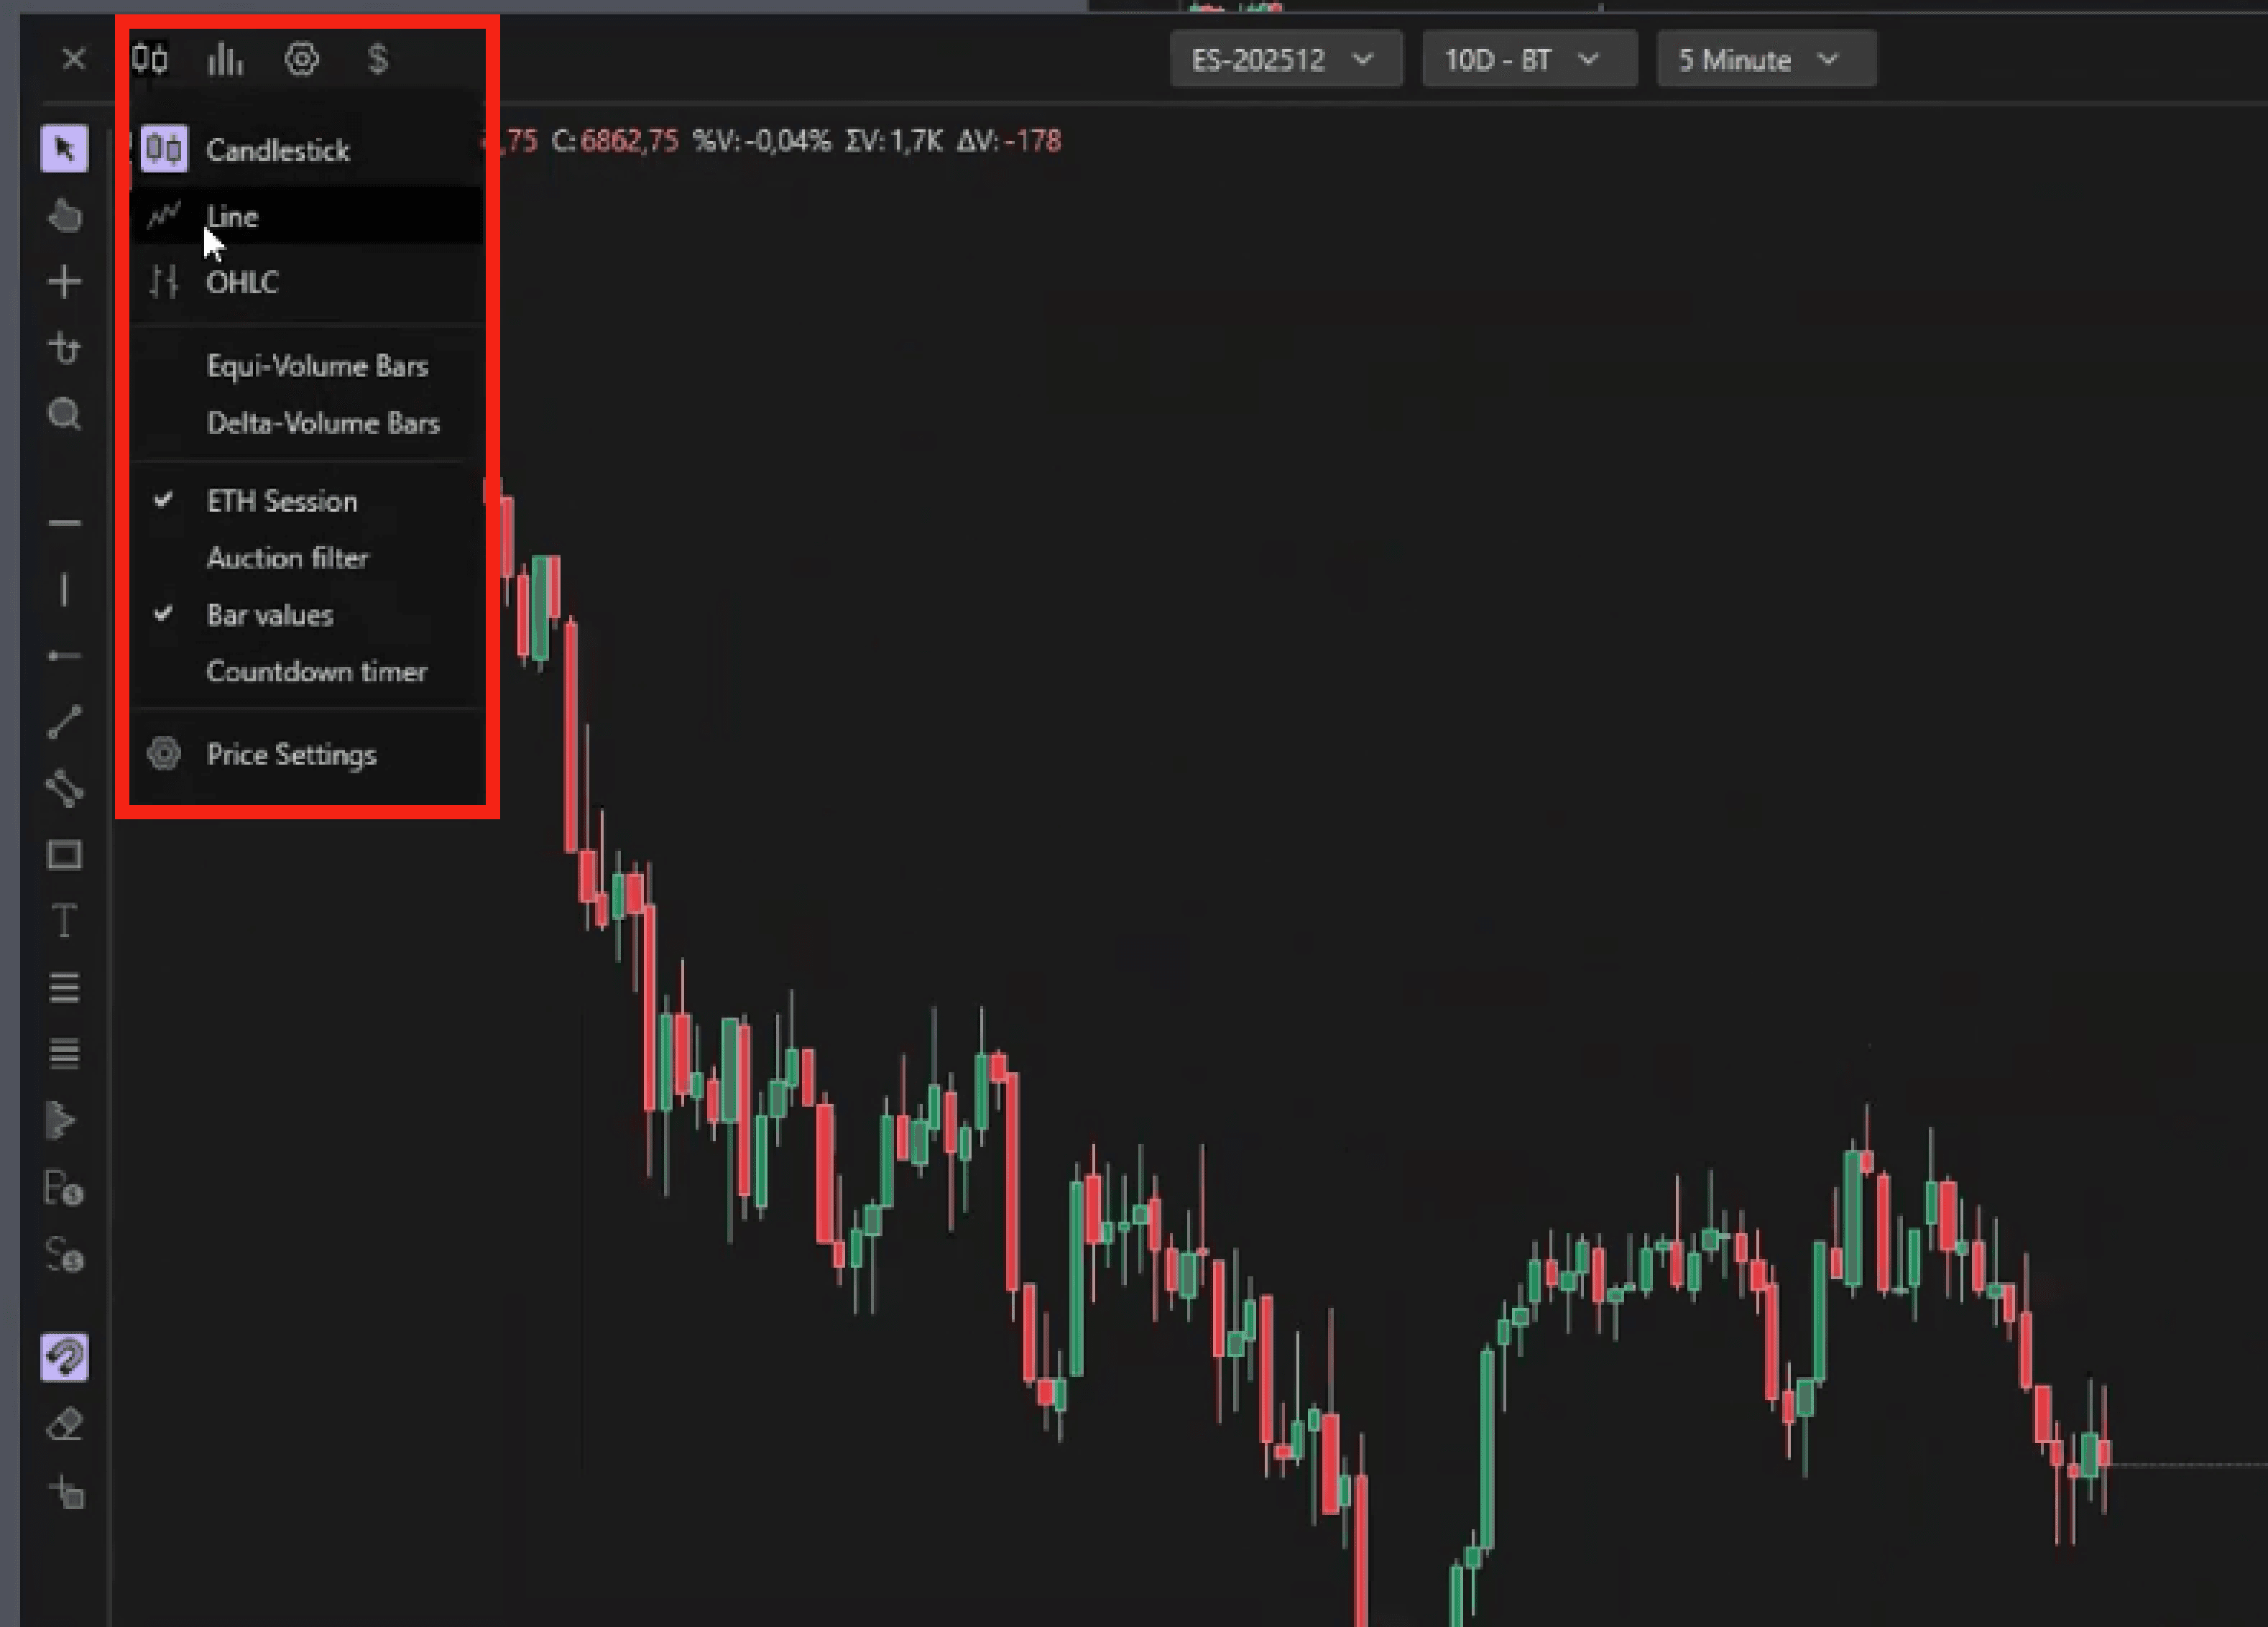
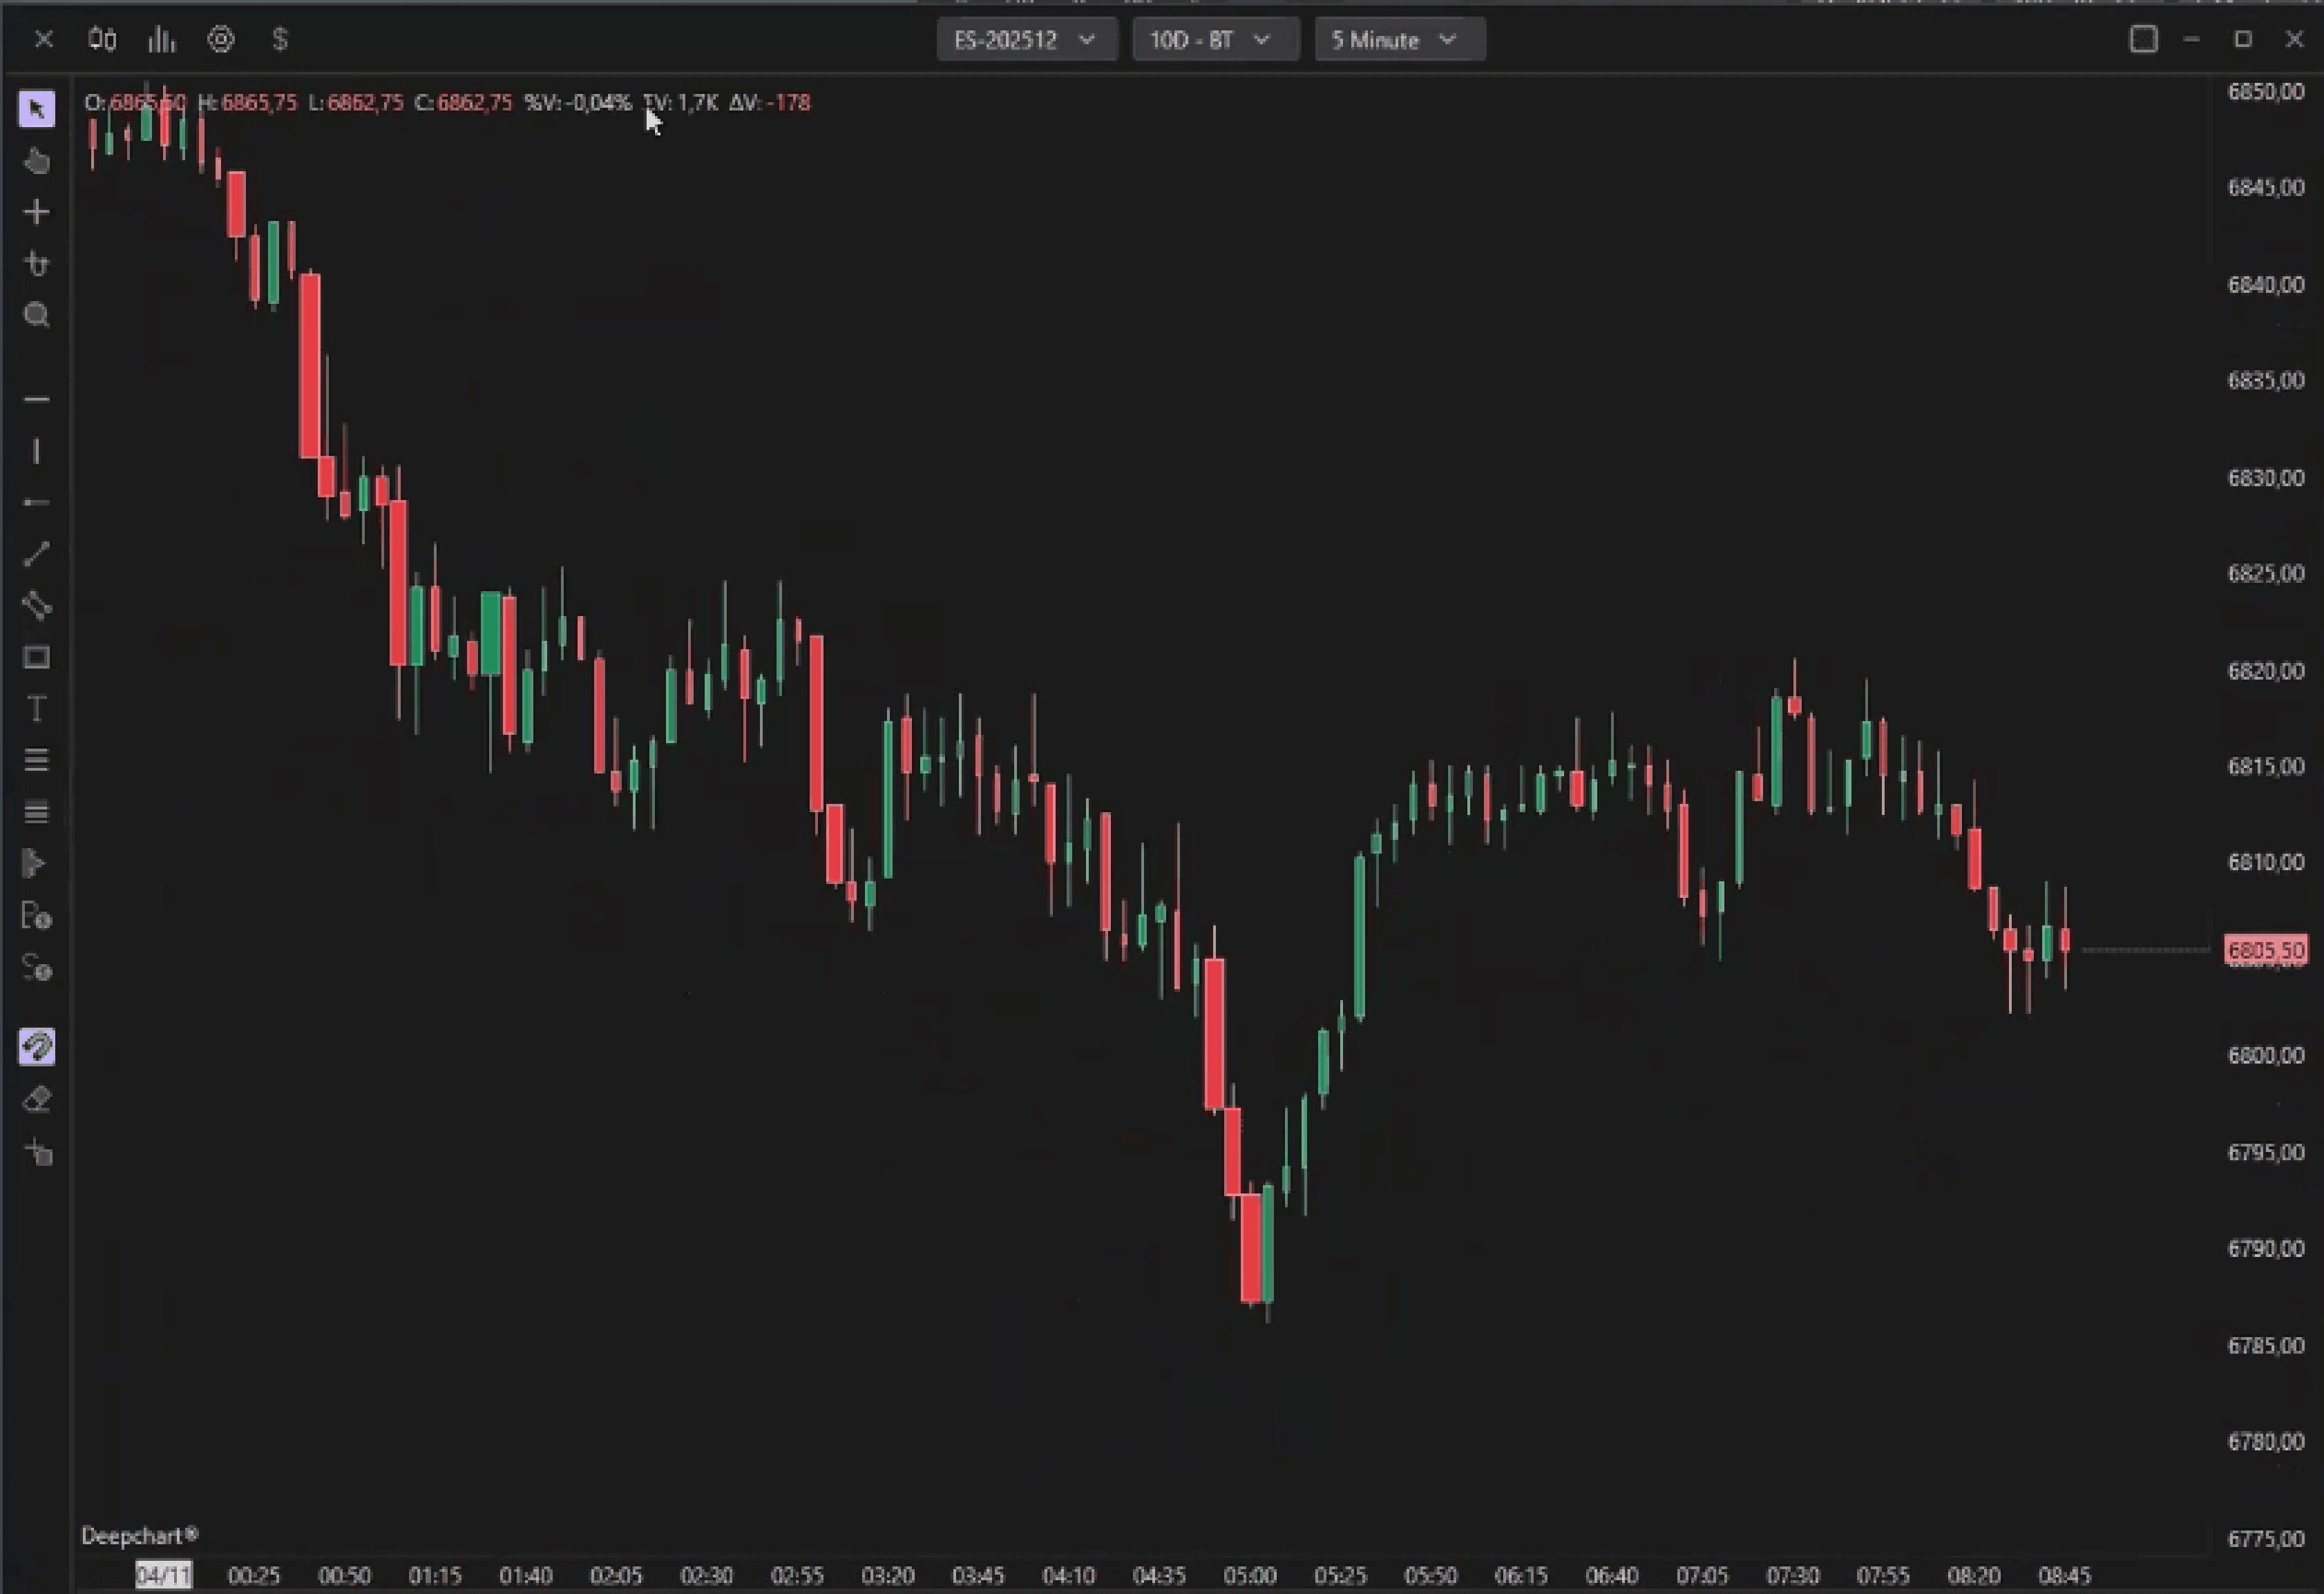
Per impostazione predefinita, il grafico è impostato sulla vista Candlestick, ma puoi modificarla in:
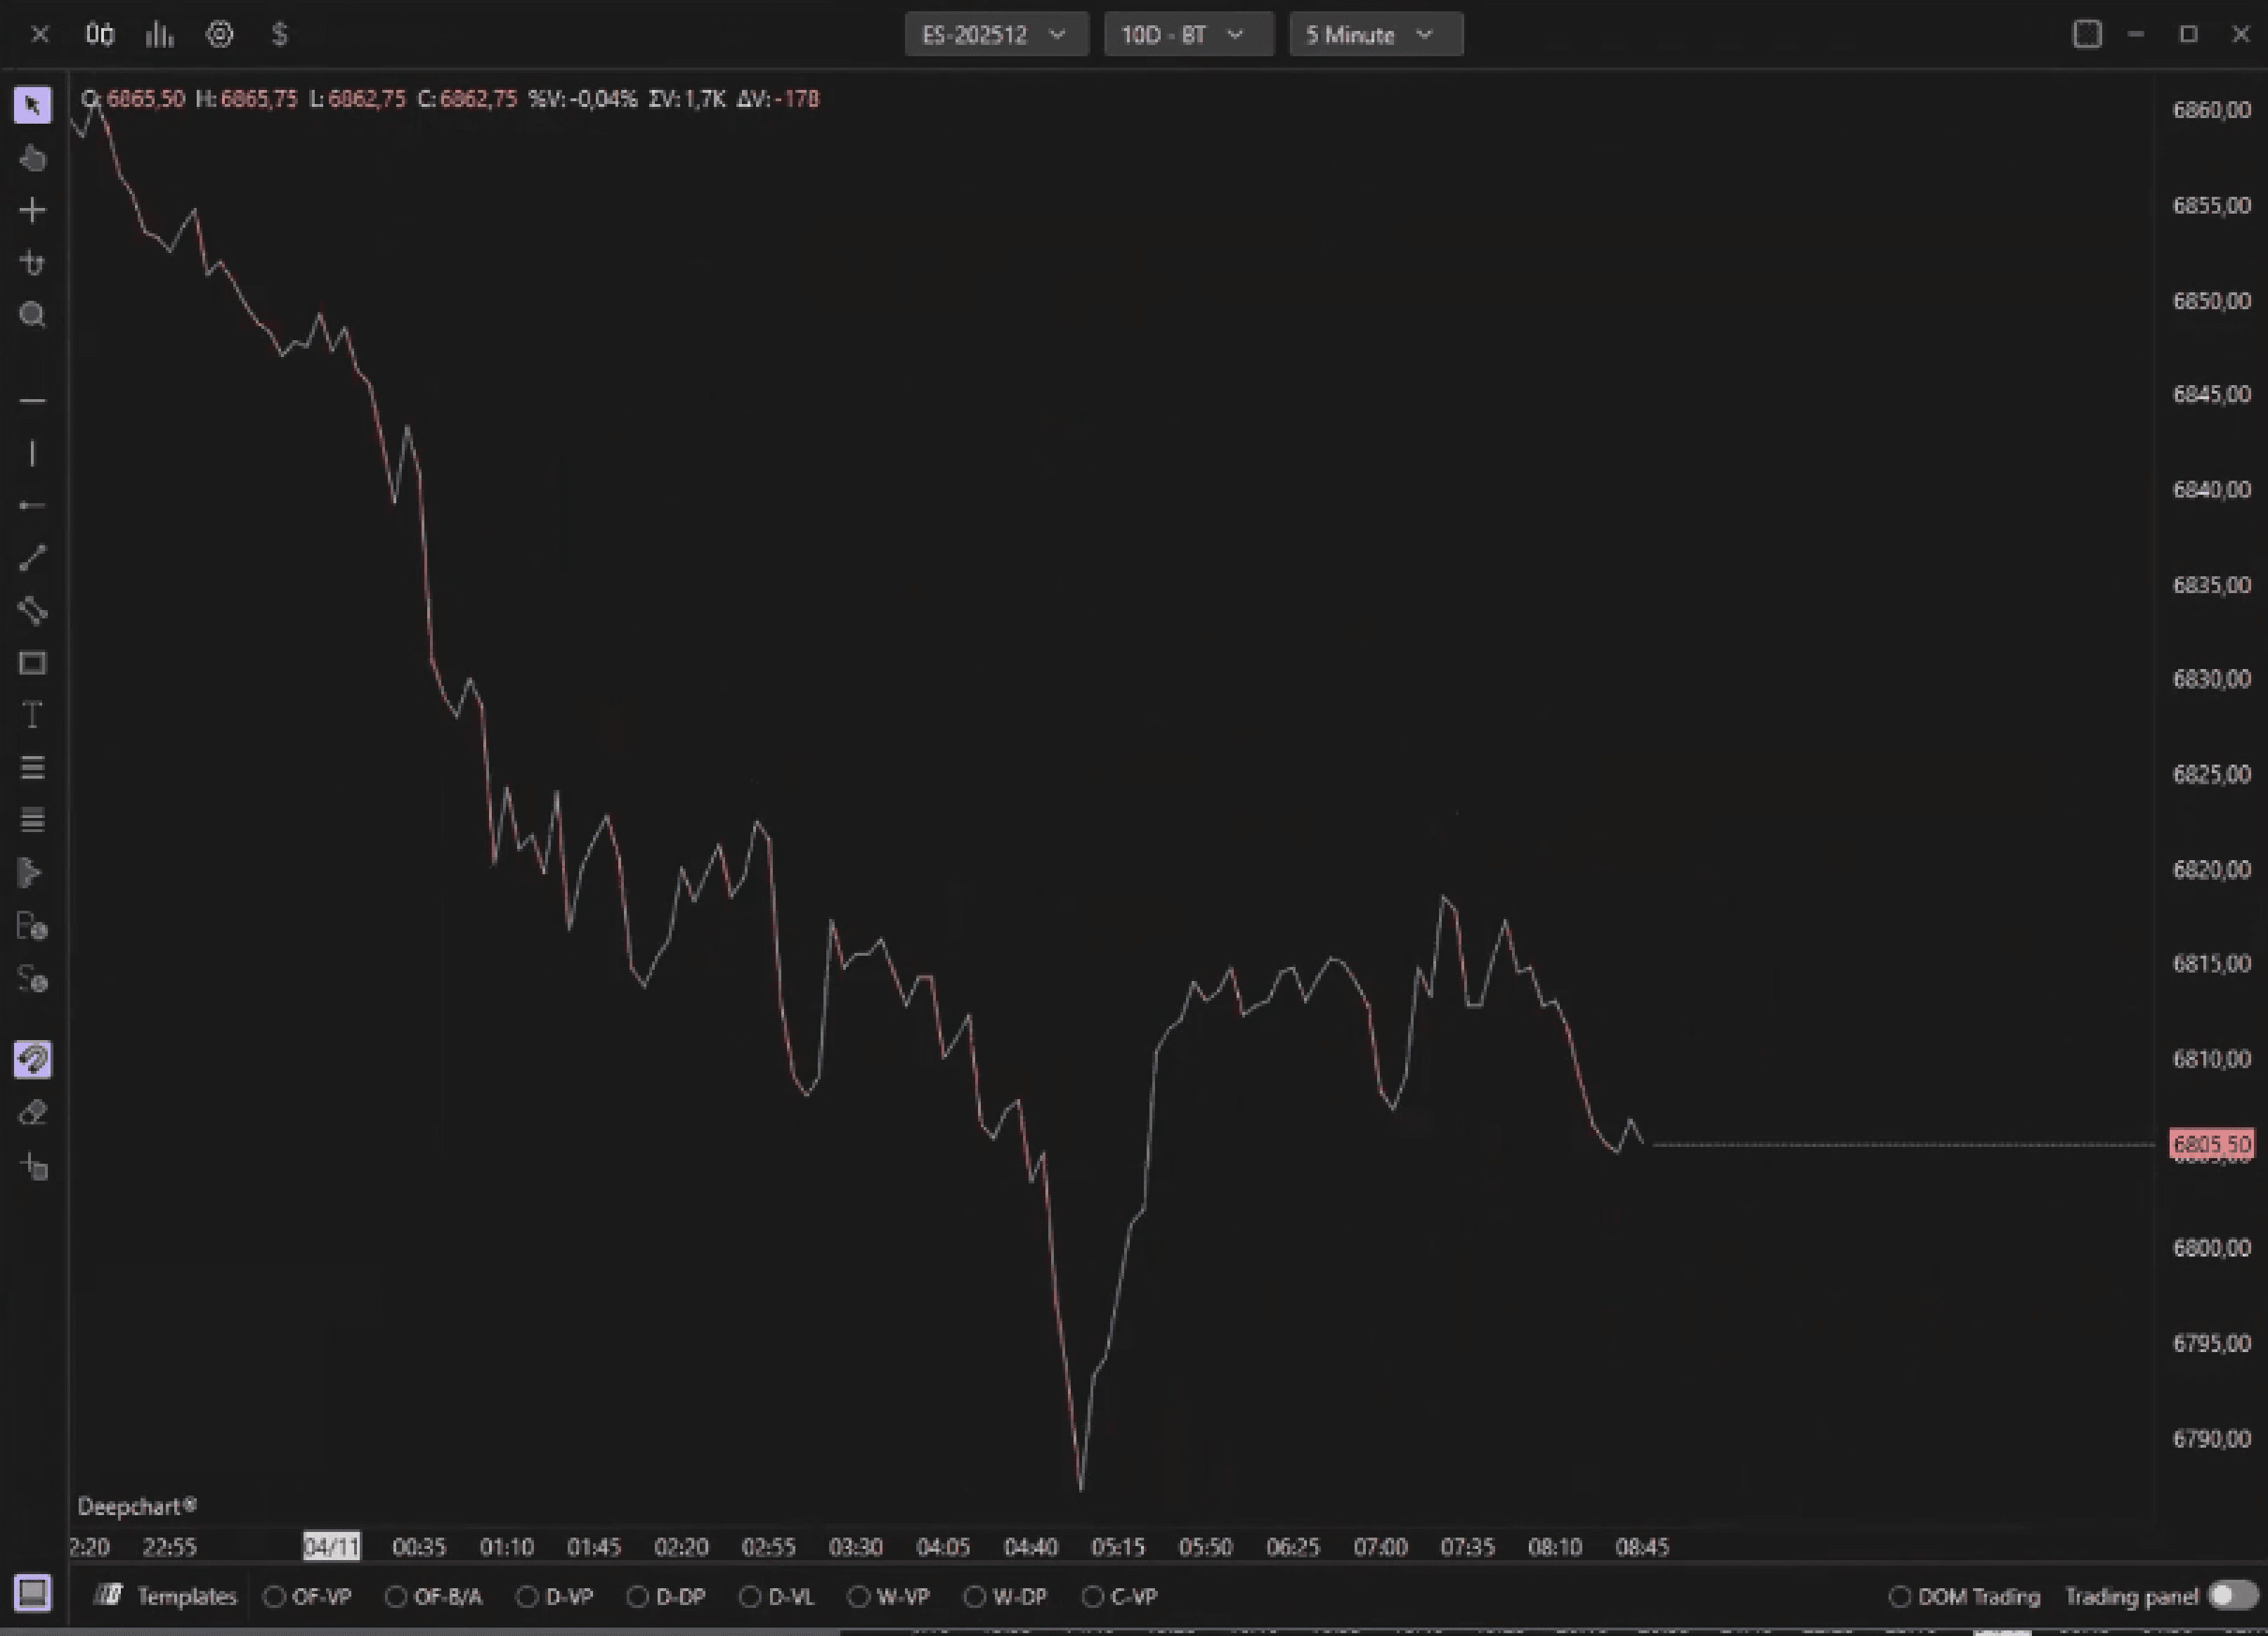
1.1 Grafico a linee
Mostra il movimento dei prezzi come una linea continua che collega i prezzi di chiusura di ogni candela.
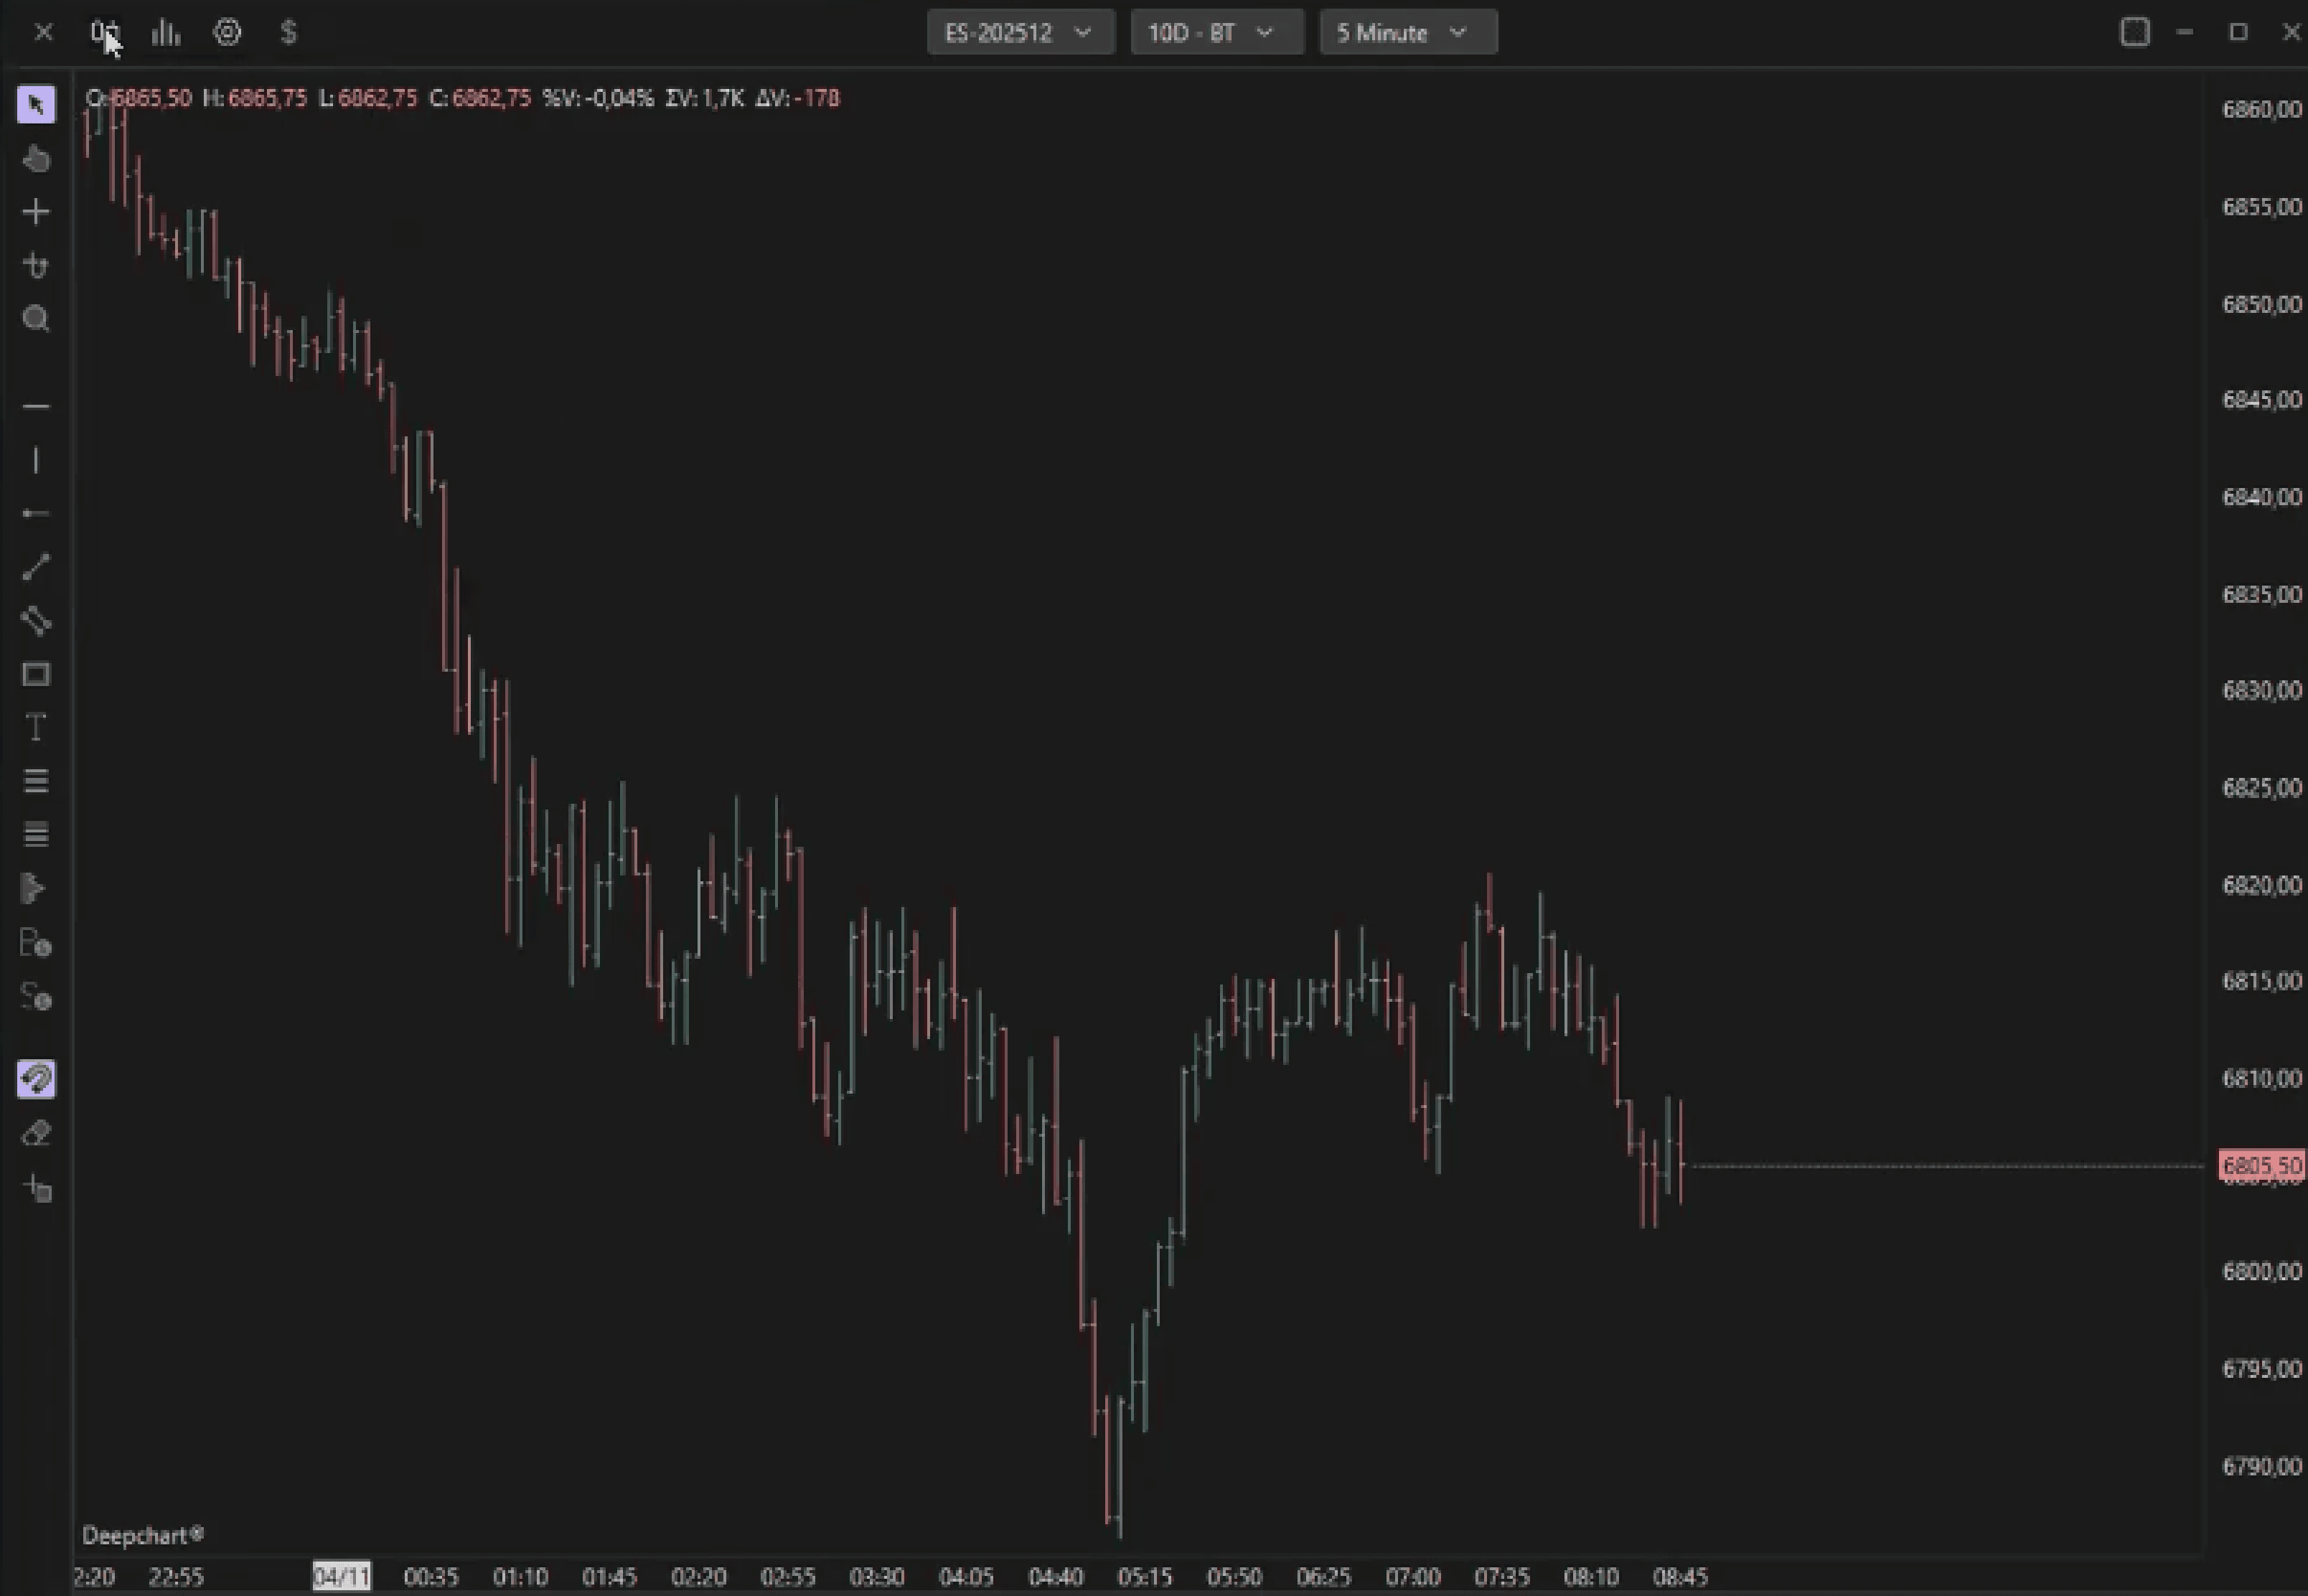
1.2 OHLC (Apertura Massimo Minimo Chiusura)
1.3 Barre Equi-Volume
Quando questa opzione è attivata, noterai che la larghezza delle candele varia — alcune sono più spesse e altre più sottili.
La larghezza di ogni candela rappresenta il volume scambiato in quel periodo.
Candele più spesse = volume di trading più alto.
Candele più sottili = volume di trading più basso.
Questo ti consente di individuare rapidamente i periodi di attività di trading elevata o ridotta.
1.4 Barre Delta-Volume
Quando è attivata, l'intensità del colore di ogni candela cambia in base ai valori delta (la differenza tra compratori e venditori aggressivi).
Rosso più scuro = venditori più aggressivi (delta negativo).
Verde più scuro = compratori più aggressivi (delta positivo).
Più intensa è la colorazione, maggiore è lo squilibrio tra compratori e venditori.
Questa funzione aiuta i trader a individuare più facilmente assorbimenti ed esaurimenti nel mercato.
1.5 Sessione ETH
Quando è attivata, il grafico mostra i prezzi durante l'Orario di Trading Elettronico (ETH).
Quando è disattivata, mostra solo i dati degli Orari di Trading Regolare (RTH) per quello strumento.
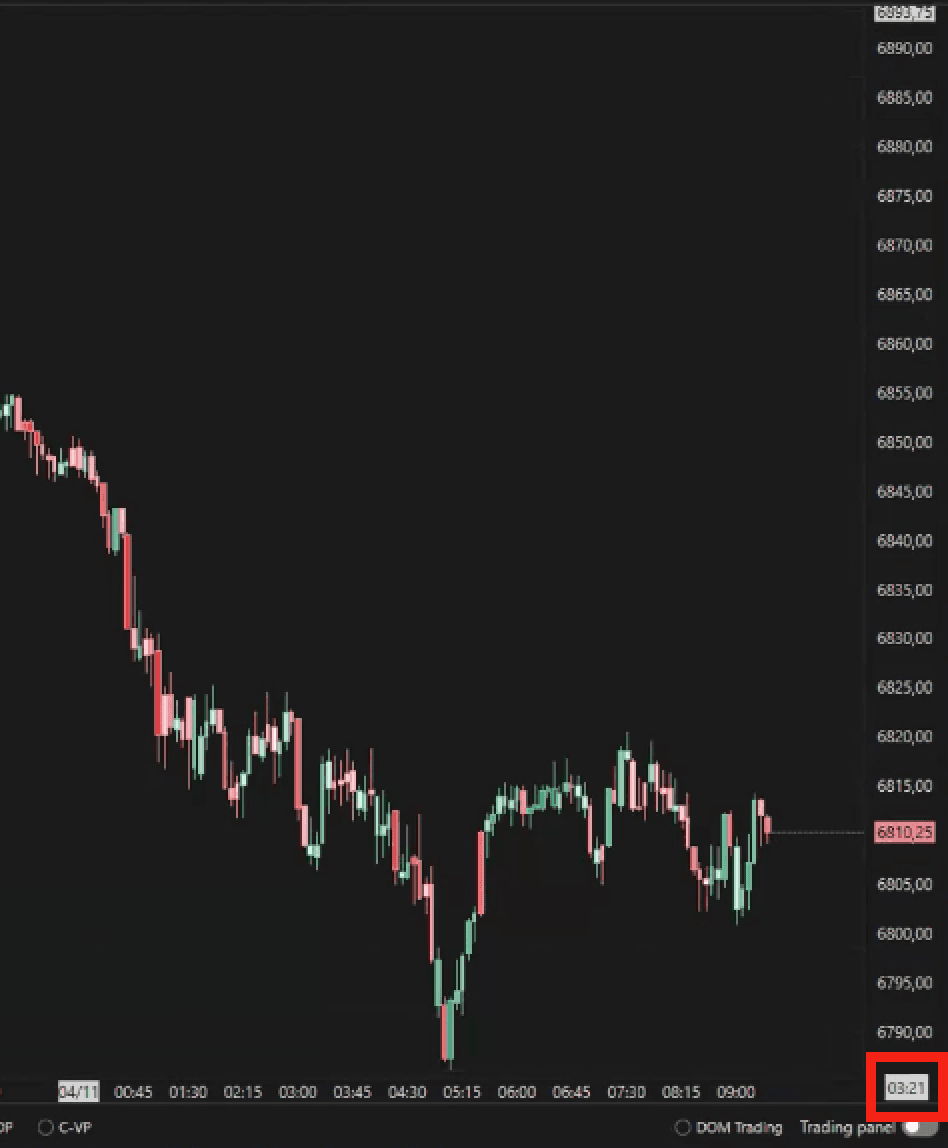
1.6 Timer conto alla rovescia
Se attivato, un conto alla rovescia appare nell'angolo in basso a destra del grafico, mostrando quanto tempo manca prima che la candela attuale si chiuda — aiutandoti ad anticipare le prossime formazioni di candele.
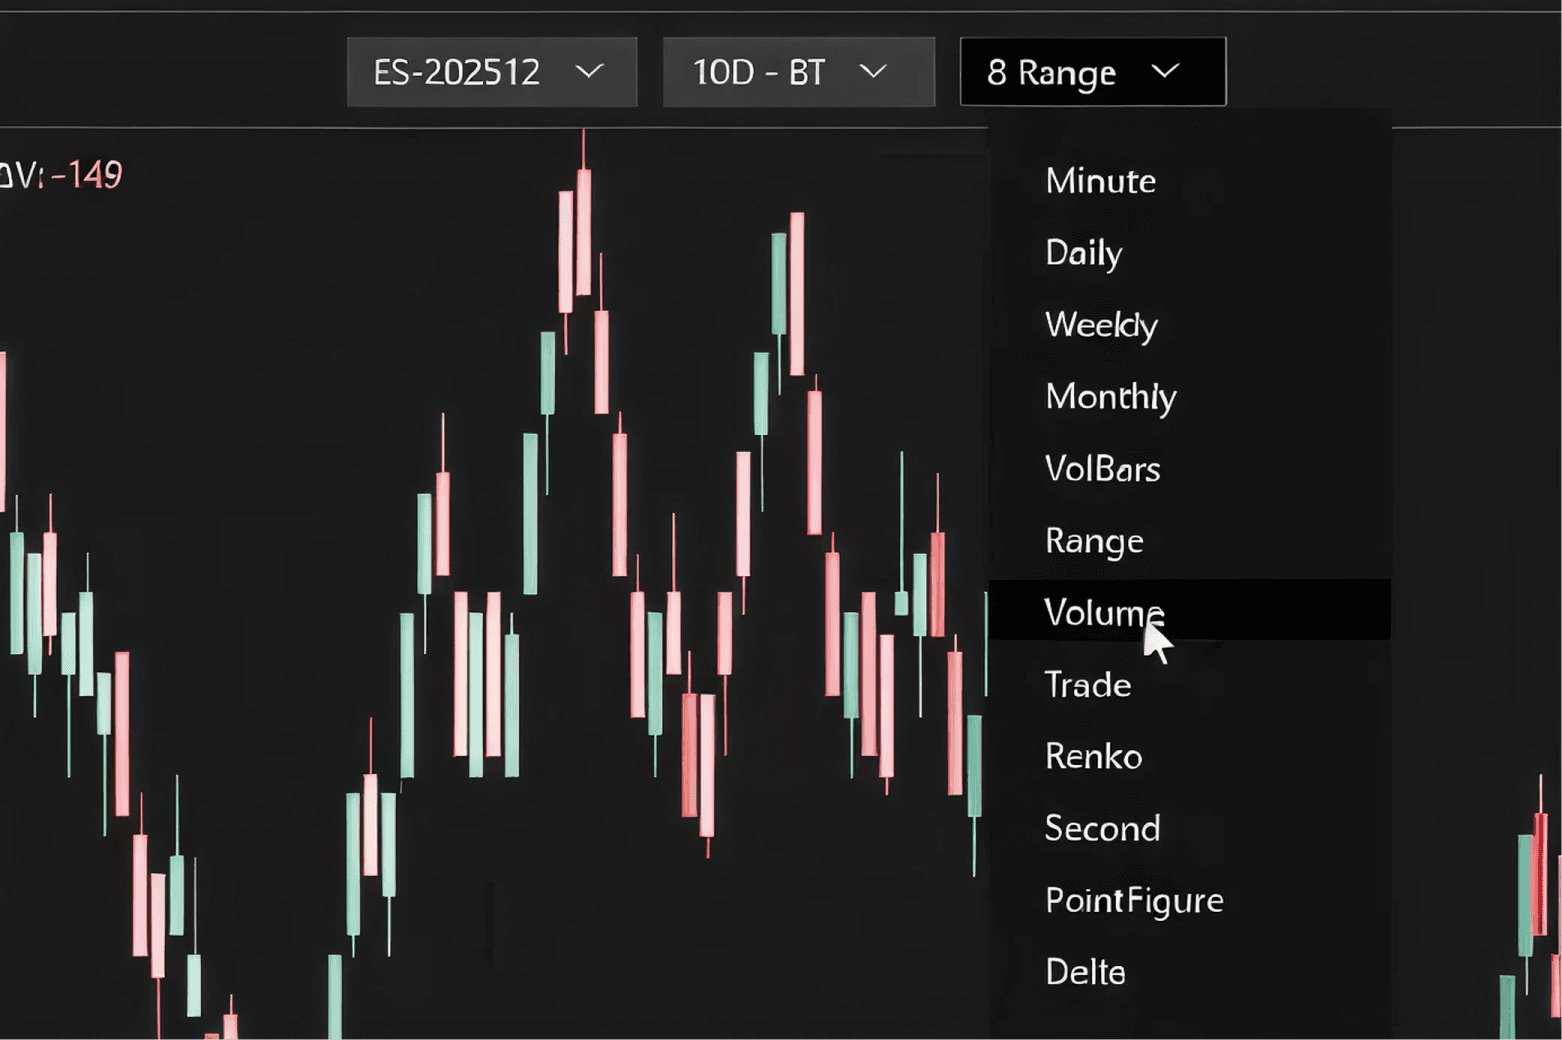
2. Tipi di grafici temporali
In DeepCharts, esistono diversi tipi di strutture grafiche che rappresentano l'attività di mercato in modo diverso. Ogni tipo di grafico ha uno scopo analitico specifico, a seconda che tu voglia concentrarti su tempo, movimento del prezzo, volume, delta.
2.1 Grafici basati sul tempo
Sono i tipi di grafico più comuni, in cui ogni barra o candela rappresenta un intervallo di tempo fisso.
Puoi scegliere tra:
Secondi
Minuti
Giornaliero
Settimanale
Mensile
Ogni candela si chiude quando termina il timeframe selezionato, indipendentemente da quanto movimento di prezzo o volume si sia verificato.
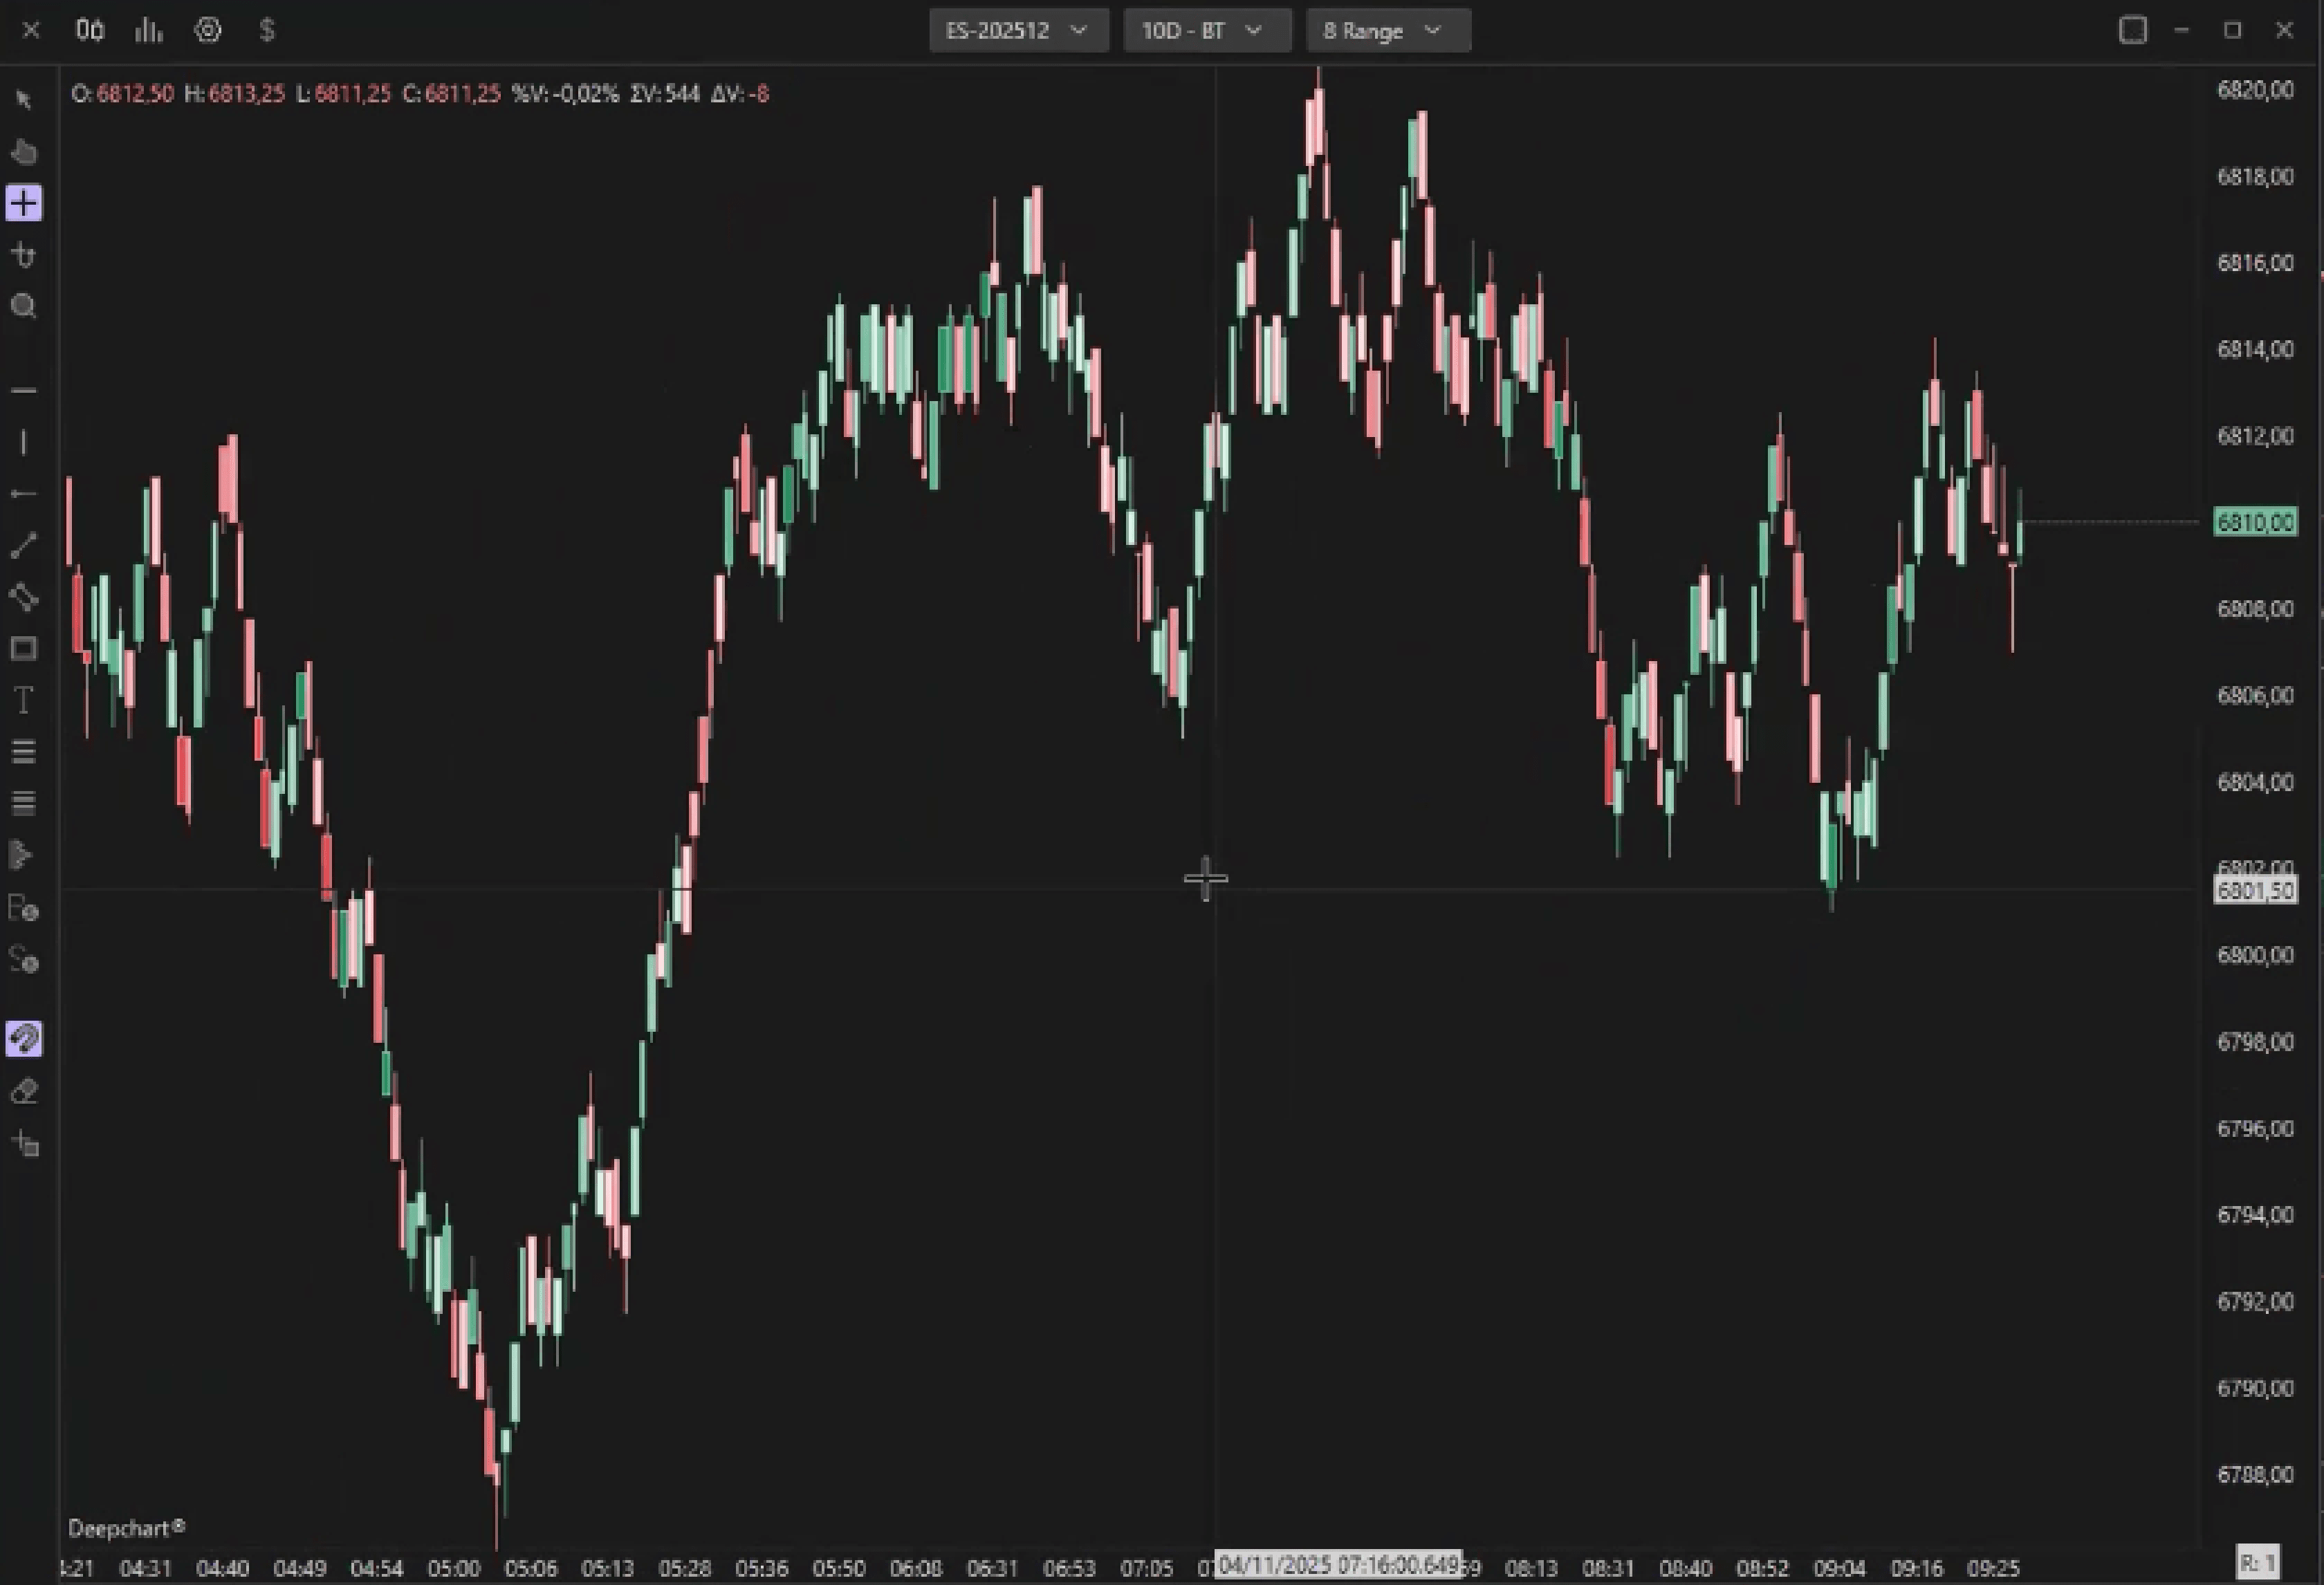
2.2 Barre Range
Le barre range non dipendono dal tempo — si basano esclusivamente sul movimento del prezzo.
Ad esempio, se imposti un range di 8 tick, ogni barra rappresenterà un movimento di prezzo fino a 8 tick tra massimo e minimo.
Se il prezzo supera quel range (ad esempio, fino al 9° tick), si formerà automaticamente una nuova barra.
Queste barre possono anche essere più piccole di 8 tick — per esempio, se una barra sale di 5 tick ma lo spread aumenta rapidamente di 6 tick (superando il range), la barra si chiuderà in anticipo e ne aprirà una nuova.
Questo tipo di grafico aiuta i trader a individuare piccoli gap di prezzo e micro-squilibri nel book ordini che sono più difficili da individuare sui grafici standard basati sul tempo.
2.3 VolBar (Volume Range Bar)
Una VolBar è una variante della barra range, ma include un parametro di inversione.
Utilizza due input chiave:
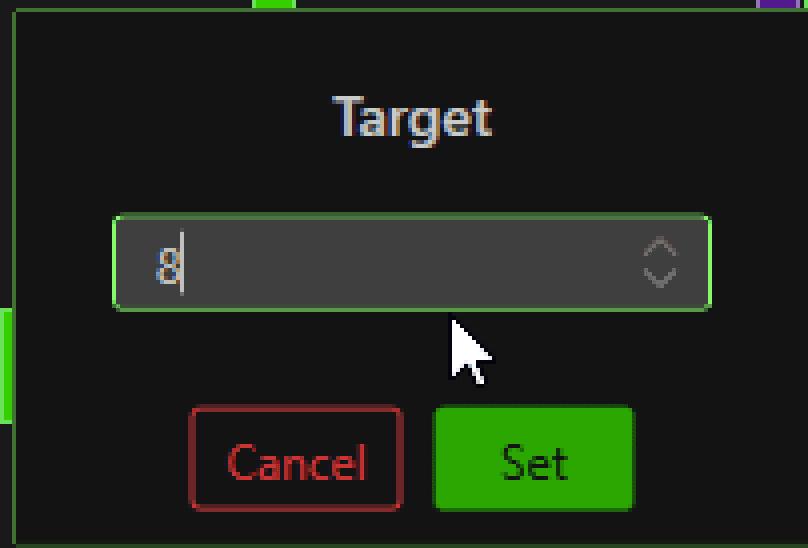
Target: il numero di tick necessari affinché una barra si completi.
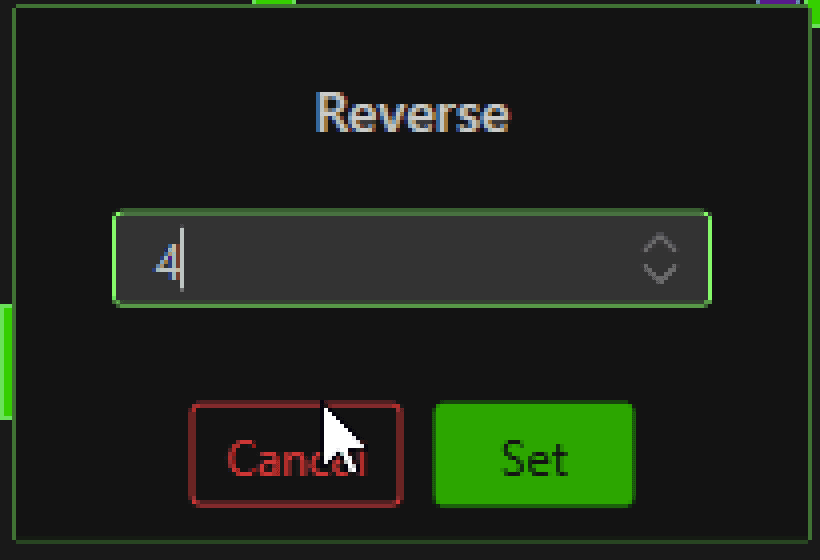
Reversal: il numero di tick che il prezzo deve muovere nella direzione opposta prima che la barra si chiuda
Esempio:
Se imposti Target = 8 e Reversal = 4:
La barra non si chiuderà quando il prezzo si muove di 8 tick al rialzo (come farebbe una normale barra range).
Si chiuderà solo quando il prezzo ritraccia di 4 tick nella direzione opposta.
Questa struttura aiuta i trader a visualizzare più chiaramente continuazione del trend e pullback.
2.4 Barre Volume
Nelle Barre Volume, ogni barra si chiude una volta raggiunta una specifica soglia di volume — non in base al tempo o al prezzo.
Ad esempio, se imposti il volume a 1.000, ogni barra rappresenterà in totale 1.000 contratti scambiati.
Questo offre ai trader una migliore percezione dell'intensità dell'attività di trading anziché del solo tempo trascorso.
2.5 Barre Trade
A differenza delle Barre Volume (che si basano sul totale dei contratti scambiati), le Barre Trade si basano sul numero di transazioni.
Ad esempio, se imposti il parametro su 10 trade, ogni barra rappresenterà 10 trade completati, indipendentemente da quanto grandi o piccoli siano stati quei trade.
Questo aiuta ad analizzare la frequenza delle transazioni e il tasso di partecipazione al mercato.
2.6 Barre Delta
Le Barre Delta sono simili alle Barre Volume, ma invece del volume totale scambiato, ogni barra si forma in base al delta — la differenza tra ordini aggressivi di acquisto e di vendita.
Queste barre sono utili per comprendere in tempo reale la pressione di acquisto e di vendita e per identificare quando un lato del mercato inizia a dominare.