Indicatori
Updated:
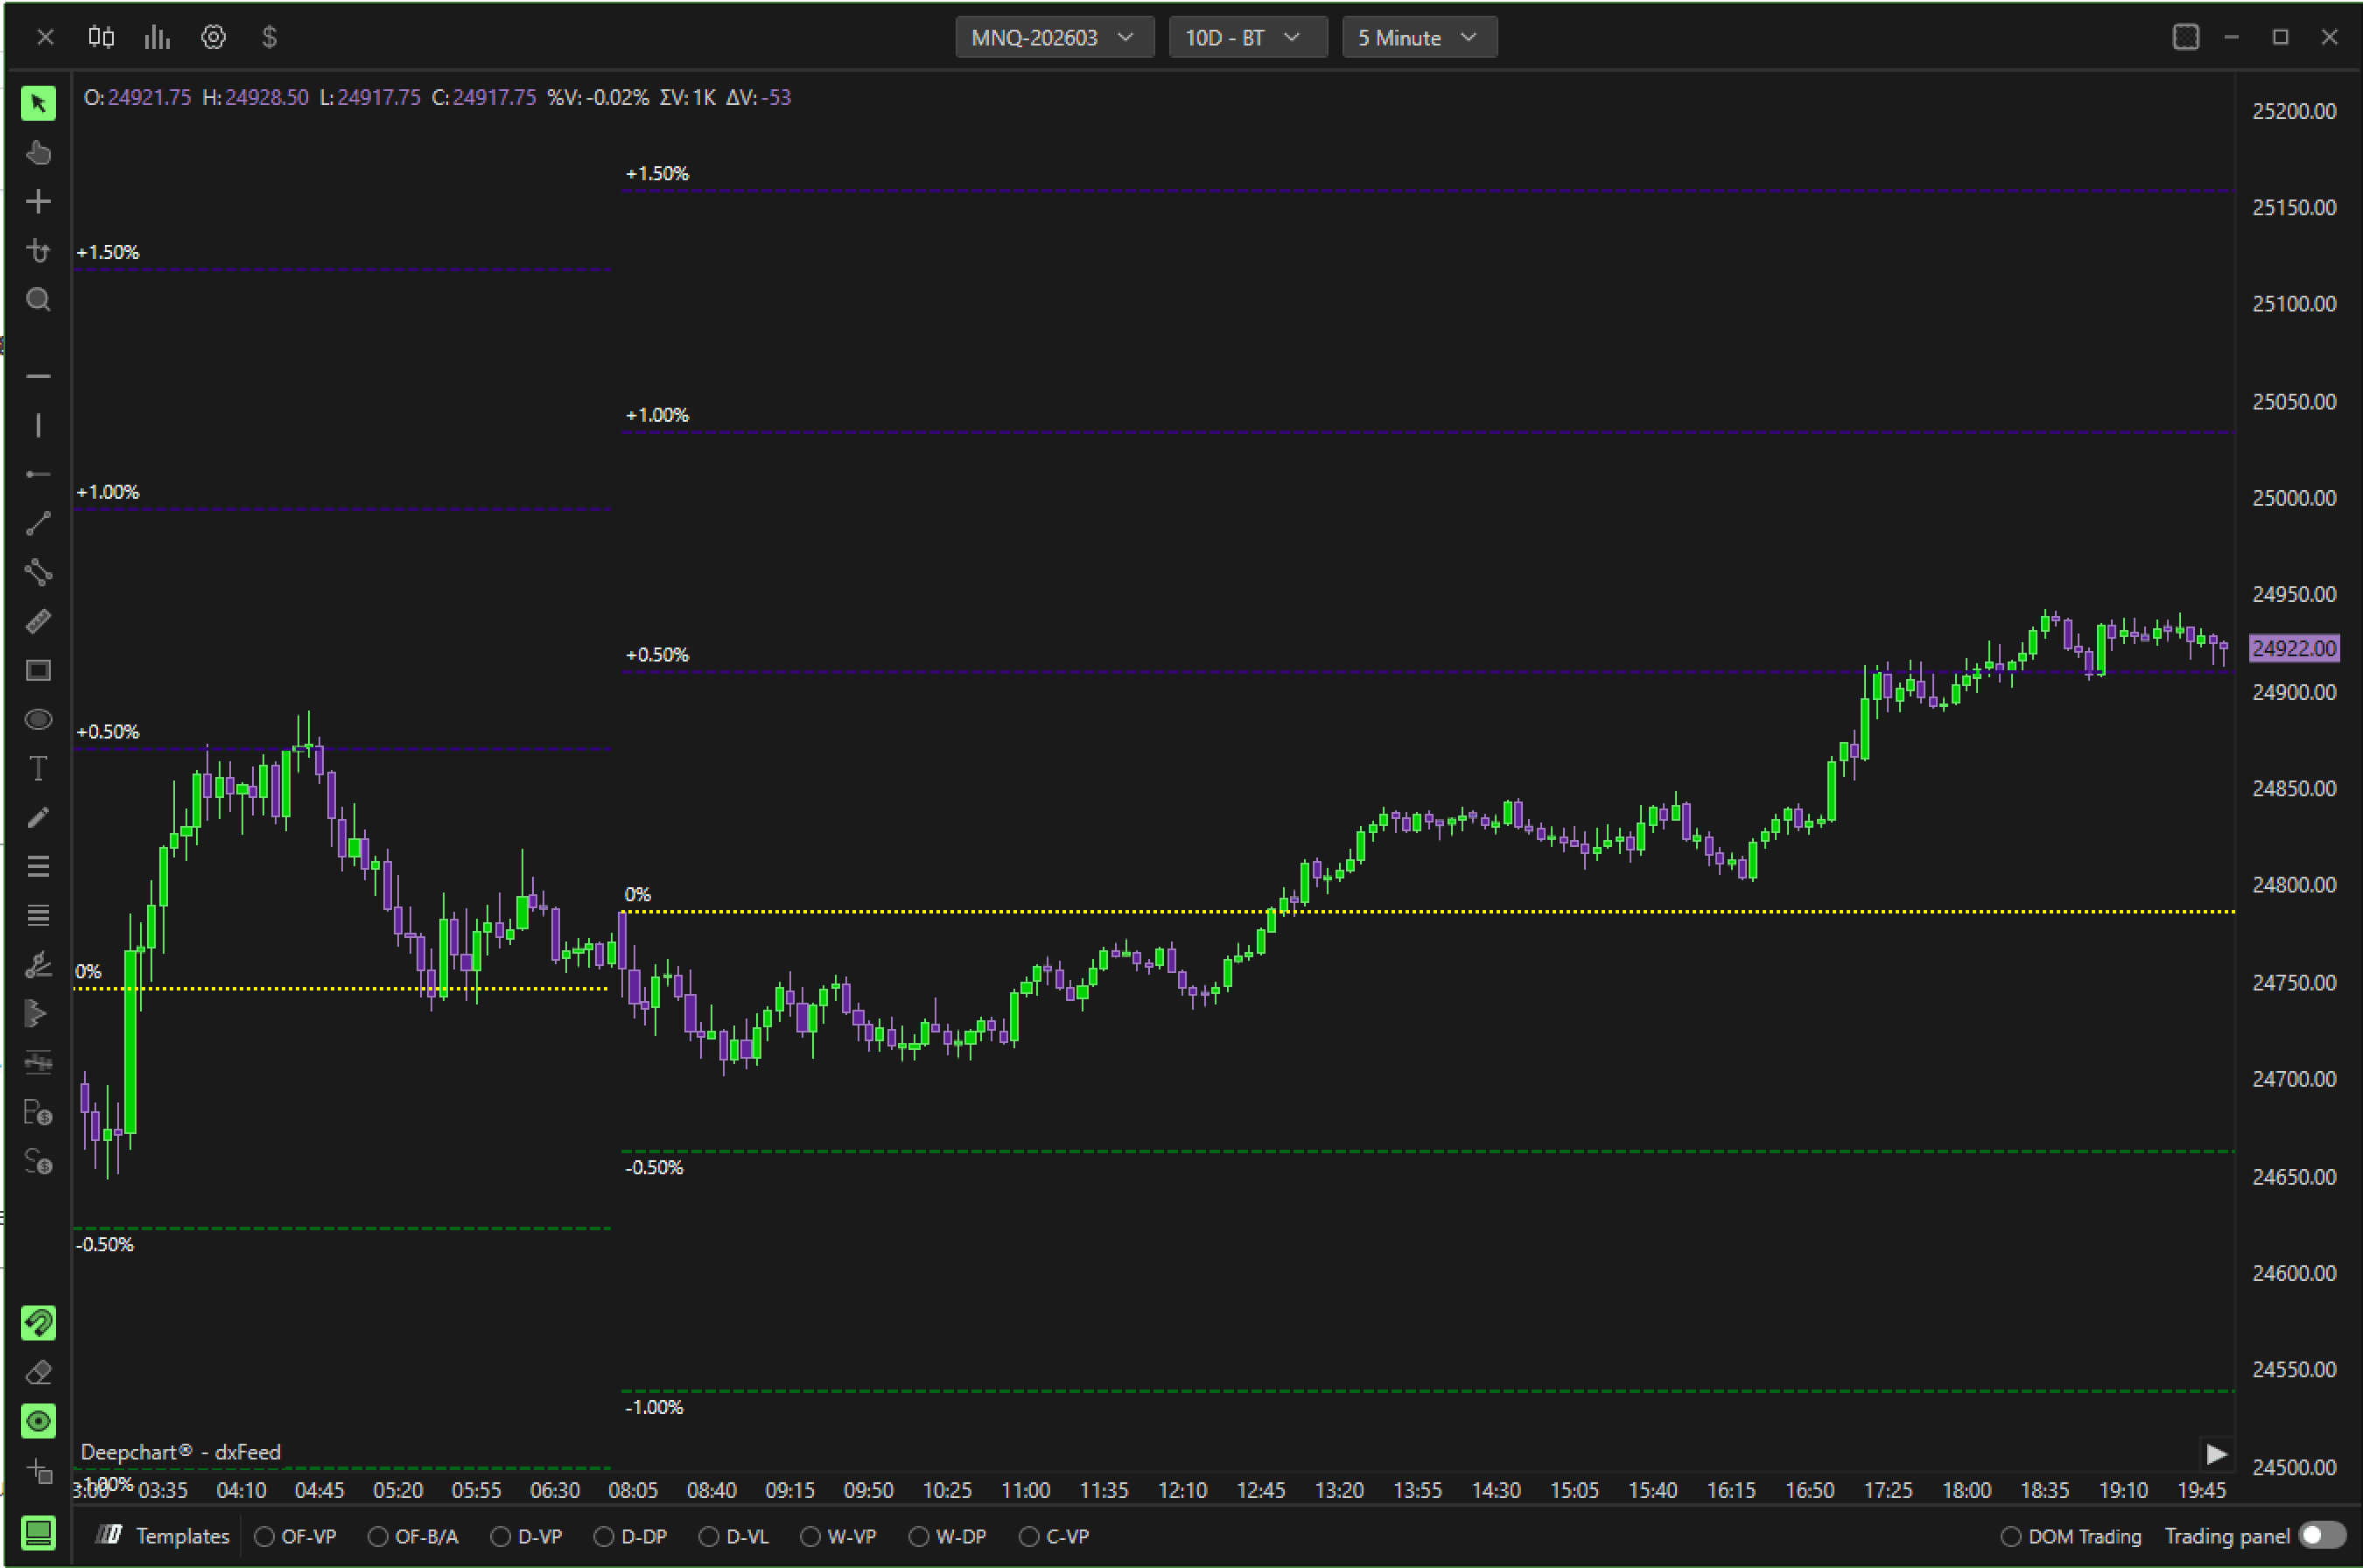
Price Movement Levels traccia livelli strutturati, in percentuale o a scatti, sopra e sotto un prezzo di riferimento.
Aiuta i trader a:
Identificare i livelli di espansione intraday
Visualizzare le zone di supporto e resistenza
Monitorare il movimento del prezzo basato su percentuale
Definire aree di reazione strutturate
Impostazioni
Area grafico
Orizzontale – Disegna i livelli sul grafico principale del prezzo.
Verticale – Visualizza in verticale (se supportato).
Selettore pannello – Sceglie il pannello in cui appaiono i livelli.
Generale

Giorni da caricare
Definisce quante sessioni passate vengono usate per calcolare e visualizzare i livelli.
Livello basato su
Seleziona il prezzo di riferimento usato per calcolare i livelli
(ad es. Open, Close, ecc.).
Modalità step
Determina la distanza tra i livelli:
Percentuale – I livelli sono distanziati in base alla percentuale.
Altre modalità (se disponibili) utilizzano incrementi a valore fisso.
Valore step
Definisce la distanza tra ciascun livello (percentuale o valore, a seconda della modalità).
Dimensione carattere
Controlla la dimensione delle etichette percentuali.
Colore testo
Imposta il colore delle etichette dei livelli.
Livelli minimi
Definisce il numero minimo di livelli tracciati sopra e sotto la base.
Linea di supporto

Colore linea di supporto
Imposta il colore dei livelli negativi/al ribasso.
Stile linea di supporto
Definisce lo stile visivo (continua, tratteggiata, ecc.).
Larghezza linea di supporto
Controlla lo spessore delle linee di supporto.
Linea di resistenza
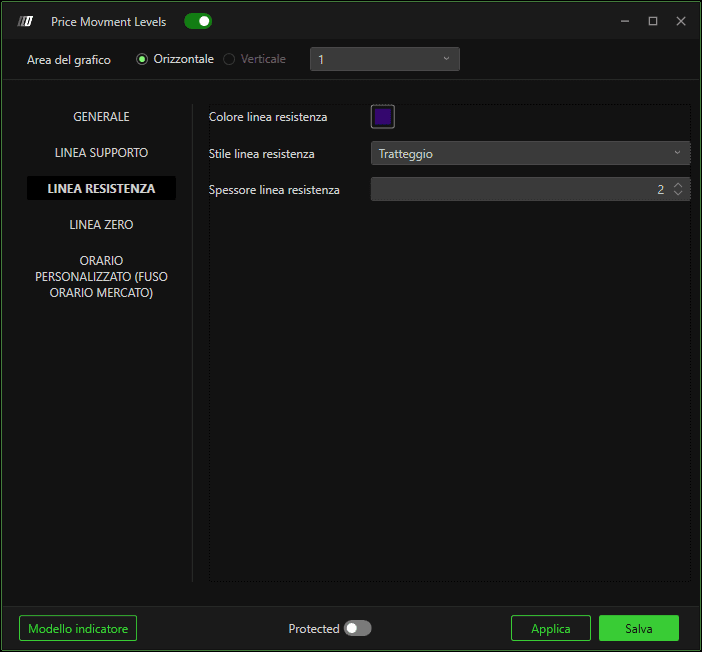
Colore linea di resistenza
Imposta il colore dei livelli positivi/al rialzo.
Stile linea di resistenza
Definisce lo stile visivo.
Larghezza linea di resistenza
Controlla lo spessore delle linee di resistenza.
Linea zero
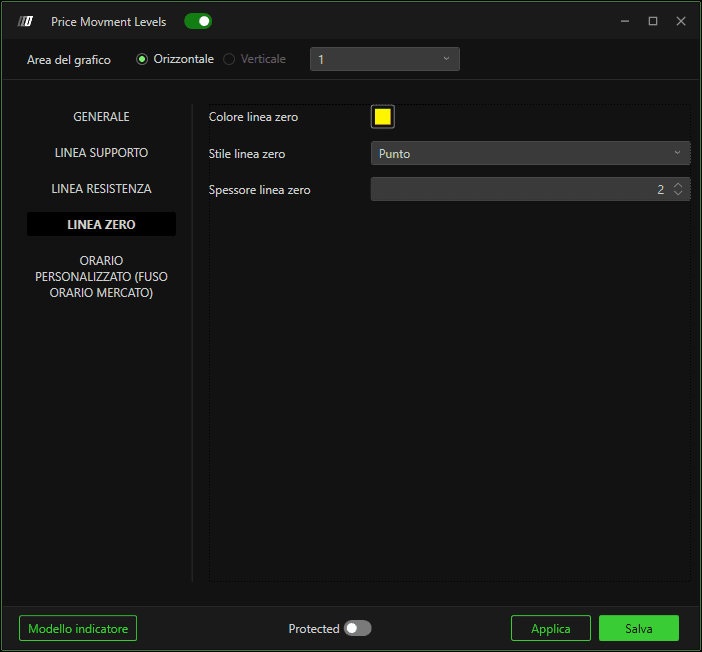
Colore linea zero
Imposta il colore del livello di riferimento base (0%).
Stile linea zero
Definisce l'aspetto della linea.
Larghezza linea zero
Controlla lo spessore della linea zero.
Sessione personalizzata a tempo (fuso orario dell'exchange)

Abilita
Limita il calcolo dei livelli a una finestra di sessione specifica.
Ora inizio
Definisce l'ora di inizio della sessione (fuso orario dell'exchange).
Ora fine
Definisce l'ora di fine della sessione.
Come funziona
Viene selezionato un prezzo base (ad es. l'apertura della sessione).
I livelli vengono calcolati usando la distanza step definita.
I livelli positivi vengono tracciati come resistenza.
I livelli negativi vengono tracciati come supporto.
La linea zero segna l'ancora di riferimento.