Indicatori
Updated:
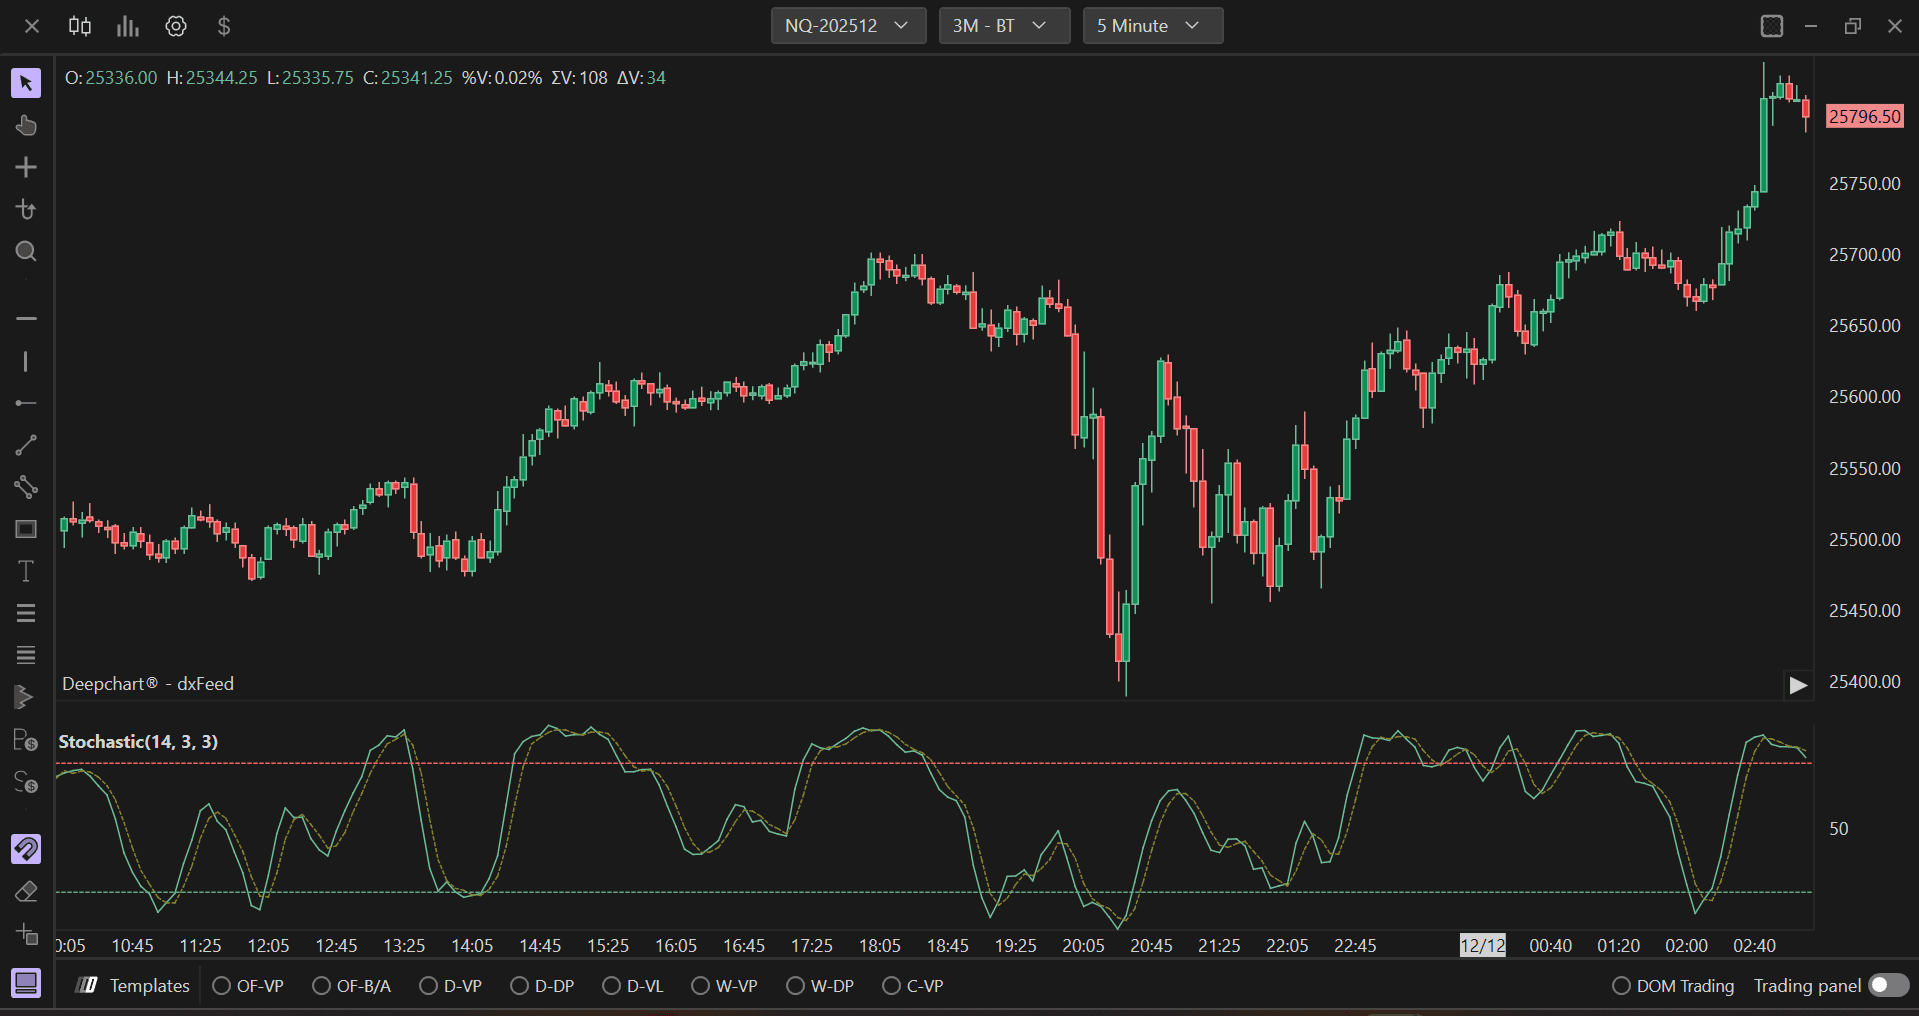
Il Oscillatore Stocastico è un indicatore di analisi tecnica che misura la posizione del prezzo di chiusura di un asset rispetto al suo intervallo di prezzo in un determinato periodo. Viene utilizzato per identificare condizioni di ipercomprato e ipervenduto, fornendo segnali di possibili inversioni di trend o conferme dei trend in essere.
L'oscillatore stocastico è un indicatore di momentum, sviluppato da George Lane, che confronta il prezzo di chiusura attuale con i massimi e i minimi di un dato numero di periodi. È misurato in percentuale. L'oscillatore stocastico è rappresentato da due linee:
Linea K: La linea principale dell'indicatore
Linea D: Una media mobile della linea K
Utilizzo delle impostazioni
Facendo clic sull'icona delle impostazioni dell'indicatore si apre la finestra di configurazione, in cui potrai effettuare diverse scelte relative al funzionamento dell'indicatore stesso.
Parametri
Nella sezione Parametri puoi configurare il calcolo dello stocastico:
Generale
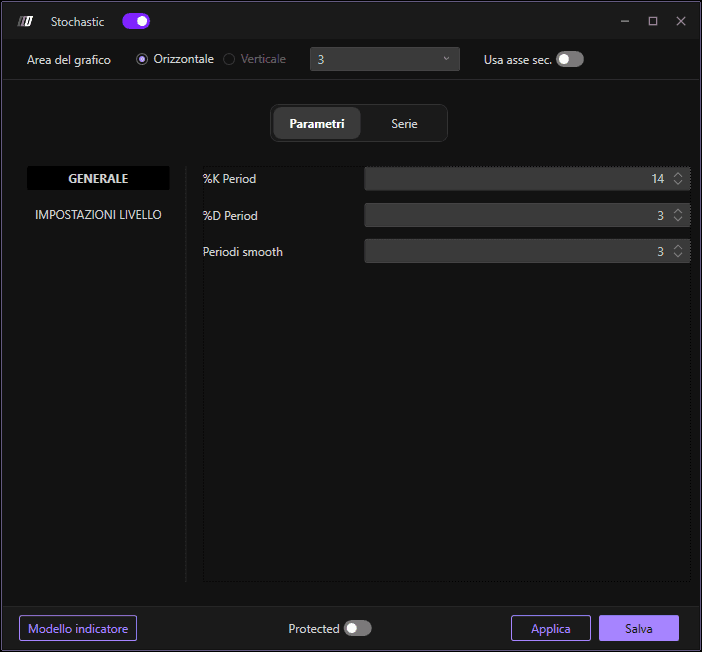
Imposta i periodi delle linee K e D:
Periodo K: Il numero di periodi per il calcolo della linea K (predefinito: 14)
Periodo D: Il numero di periodi per la media mobile della linea D (predefinito: 3)
Lunghezza di smoothing: Smussamento aggiuntivo applicato alla linea K (predefinito: 3)
Impostazioni dei livelli
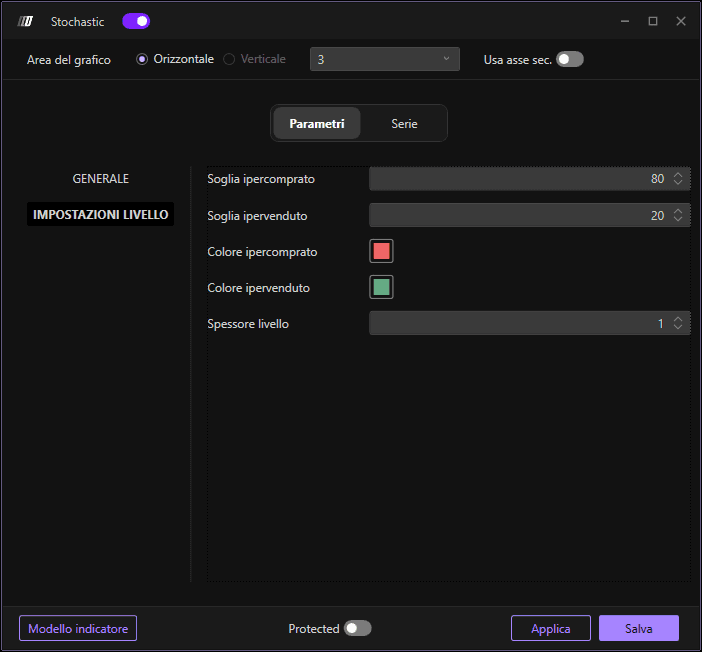
Configura le soglie di ipercomprato e ipervenduto:
Livello di ipercomprato: Livello che indica una condizione di ipercomprato (predefinito: 80)
Livello di ipervenduto: Livello che indica una condizione di ipervenduto (predefinito: 20)
Colore ipercomprato: Colore per la linea della soglia di ipercomprato
Colore ipervenduto: Colore per la linea della soglia di ipervenduto
Larghezza del livello: Definisci la larghezza delle linee della soglia
Subgrafici

Nella sezione Subgrafici puoi modificare colori e stile delle linee K e D:
Colore linea K: Imposta il colore della linea K
Colore linea D: Imposta il colore della linea D
Colore secondario: Imposta un colore secondario opzionale
Stile del subgrafico: Scegli lo stile di visualizzazione
Stile della linea: Definisci lo stile della linea
Larghezza della linea: Definisci la larghezza delle linee dell'indicatore
Usa asse secondario: Opzione per visualizzare su un asse secondario