Deep Indicators
Updated:
The Deep Iceberg indicator highlights hidden institutional liquidity by detecting iceberg orders – large limit orders where only a small portion is visible in the DOM at any time while the rest remains hidden.
1. What Is an Iceberg Order?
On futures exchanges such as the CME, an iceberg order is a limit order that specifies a total size and a smaller visible size (also called the peak or display quantity).
Only the visible portion appears in the order book like a normal limit order.
When that visible slice is filled, the Iceberg Algo automatically refreshes it from the hidden quantity, keeping the same order ID but with updated queue priority.
This process repeats until the entire total size is executed or the remaining hidden quantity is cancelled.
The effect in the DOM is that a small resting order seems to refill again and again at exactly the same price, even though far more contracts are actually trading there than the displayed size would suggest in a Footprint candle.
2. How Deep Iceberg Detects Hidden Size
Deep Iceberg uses MBO(Market By Order) data to track repeated replenishment of resting orders at the same price and identify where much more volume has traded than was ever visible in the book.
It monitors order ID: all those small passive orders that keeps reappearing has one thing identical thats the passive ID and Deep Iceberg track that ID.
it shows you total of contracts and Highest Visible Limit Order that was visible on the book during the life of the Iceberg
This makes it possible to see where a large participant is accumulating or distributing significant size while keeping most of their interest hidden from the regular DOM view.
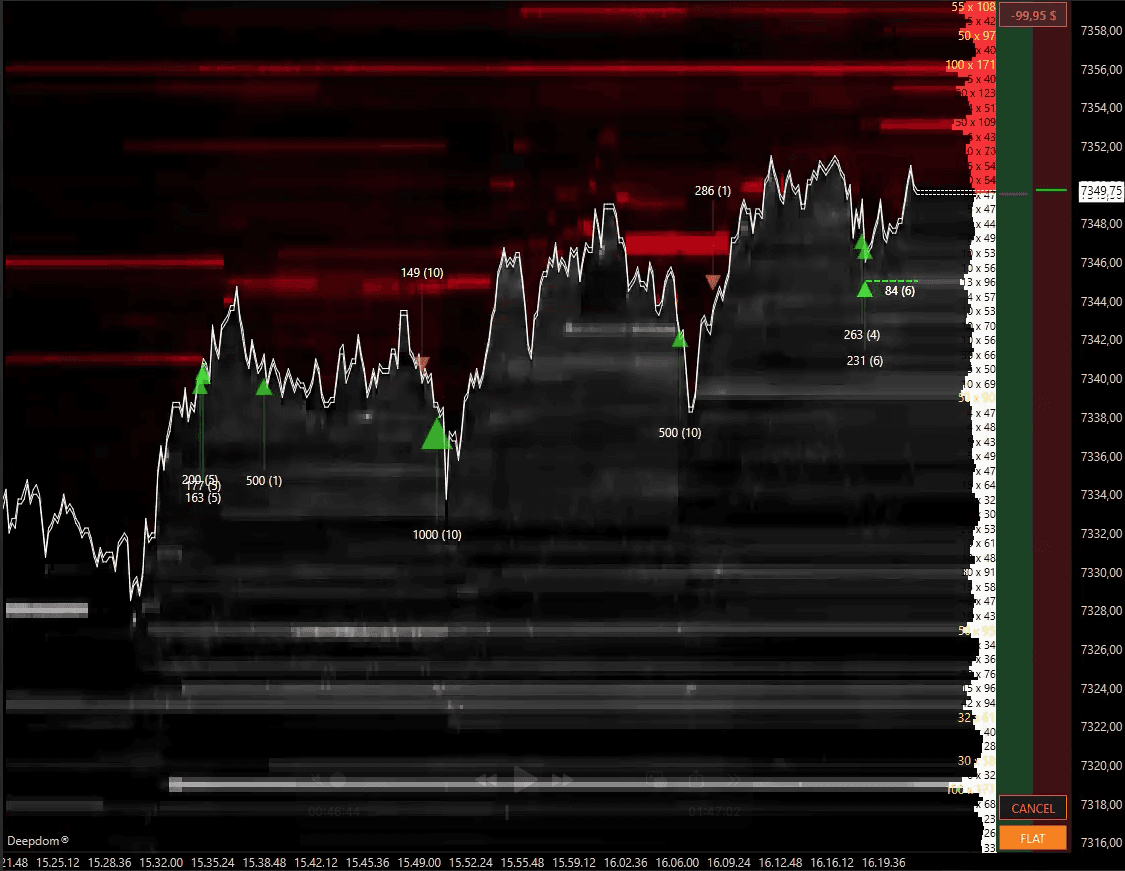
3. Visualisation on the Chart
Each detected iceberg is drawn as a marker at the price where the hidden liquidity traded. The label next to the marker shows two values:
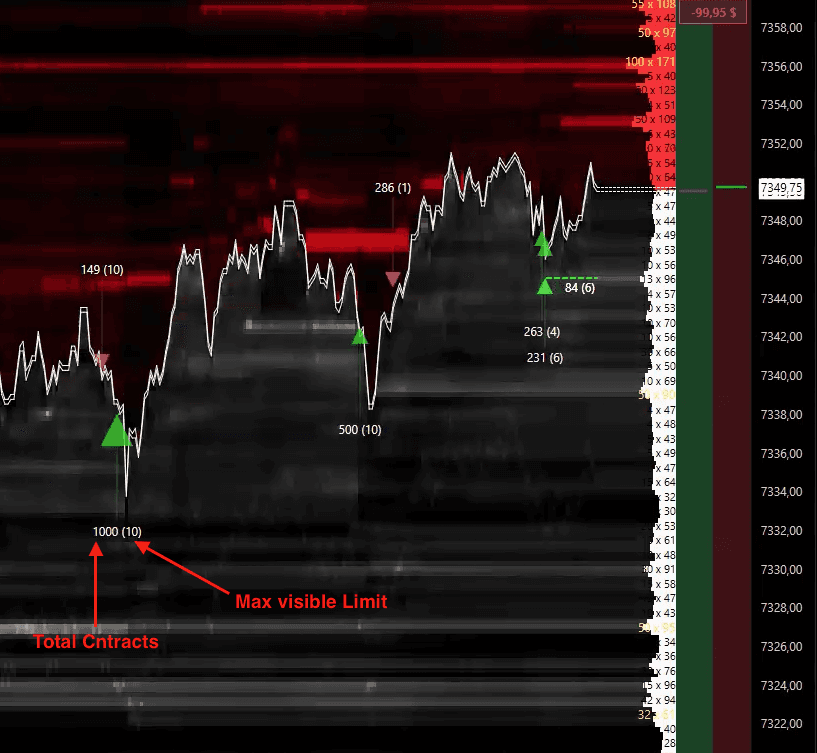
Total executed iceberg volume – The total contracts traded as part of the iceberg at that price (for example, 1,000 contracts).
Maximum visible size – the largest displayed slice that was ever visible in the book during the life of that iceberg (for example, 10 contracts).
When you enable active iceberg lines, a horizontal line is drawn through the marker as long as the iceberg is still resting on the book and not fully executed or cancelled. This creates a visual “support” or “resistance” band that shows where a large player is still present.
4. Data Settings
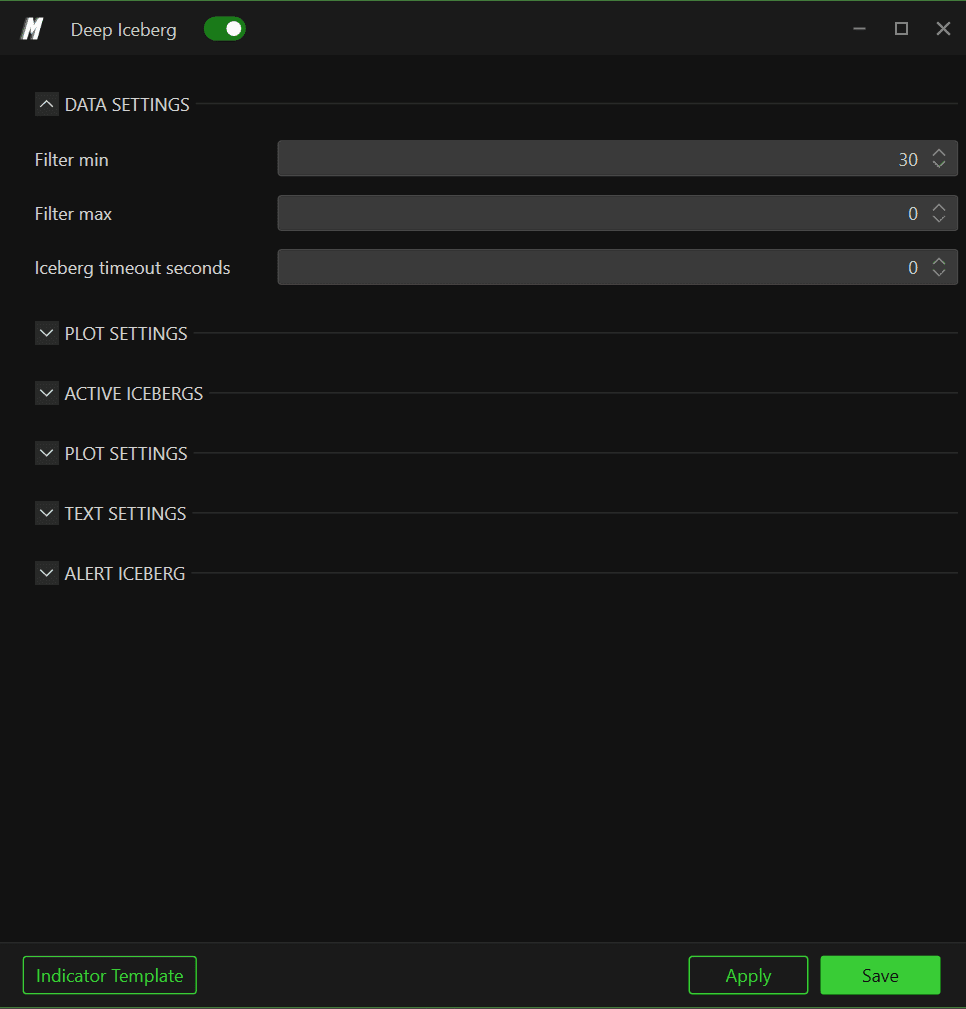
The Data Settings group lets you control which iceberg events are displayed and how sensitive the detector is:
Filter min / Filter max – lower and upper filters on detected iceberg size. Use these to ignore very small icebergs or to focus only on exceptionally large events.
Iceberg timeout seconds – how long Deep Iceberg continues to treat ongoing activity at the same price as part of the same iceberg. If no new replenishment occurs within this period, the iceberg is considered finished.
5. Plot Settings
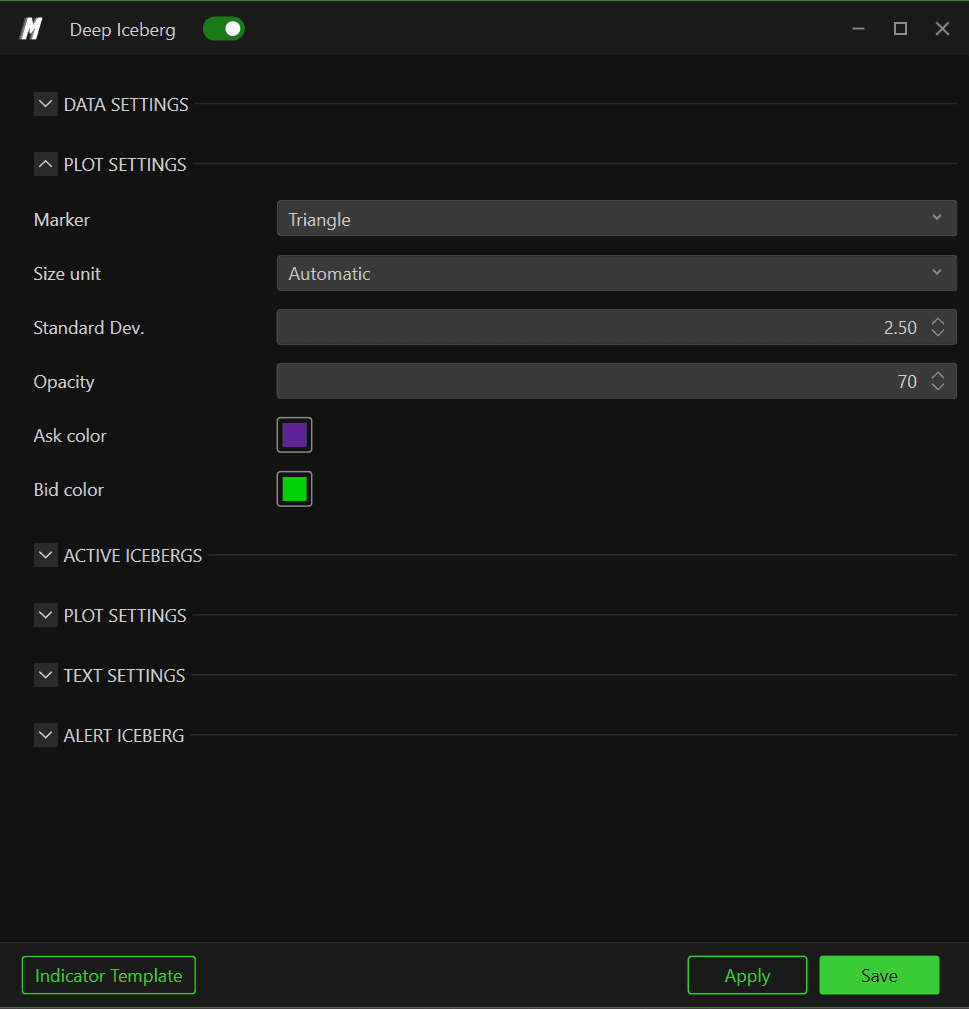
The Plot Settings section controls how iceberg markers appear on the chart:
Marker – choose the shape used for each detected iceberg: Circle, Square, Diamond, Triangle or Text.
Size unit –
Automatic – marker size is scaled automatically based on iceberg volume.
Tick – marker size is defined in price ticks so that it stays consistent relative to the price scale.
Standard Dev. – controls how far from the average size an iceberg must be to be highlighted more strongly. Higher values make the plot more selective.
Opacity – transparency of iceberg markers.
Ask color / Bid color – colors used for sell-side and buy-side icebergs.
6. Active Icebergs
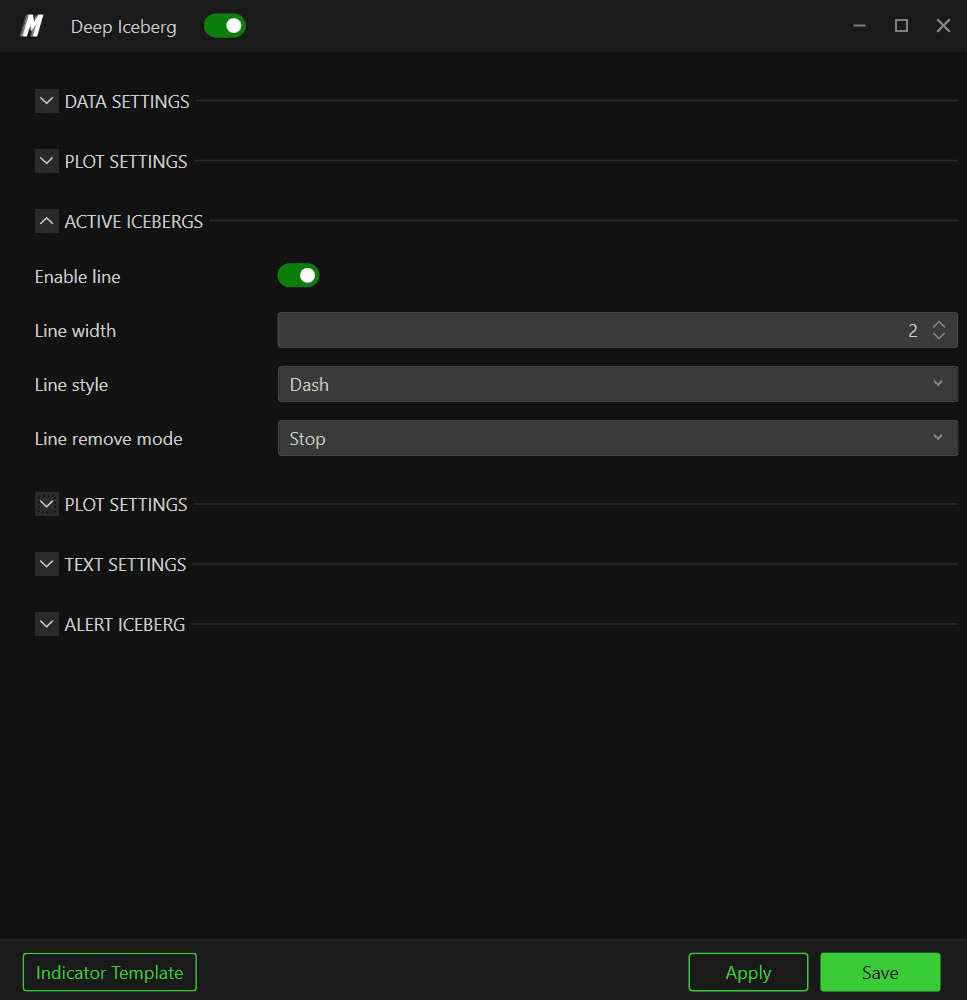
The Active Icebergs section manages horizontal lines for icebergs that are still resting on the book:
Enable line – turns the active-iceberg line drawing on or off.
Line width – thickness of the horizontal line.
Line style – choose between Solid, Dash, Dot, Dash dot or Dash dot dot styles.
Line remove mode – determines what happens when the iceberg is no longer active:
Stop – the line stops extending but remains on the chart at its last position.
Disappear – the line is removed once the iceberg is fully executed or cancelled.
A continuous line tells you that the large participant is still quoting at that price. Once the line stops or disappears, that liquidity has either been fully traded or has pulled out.
7. Plot Settings
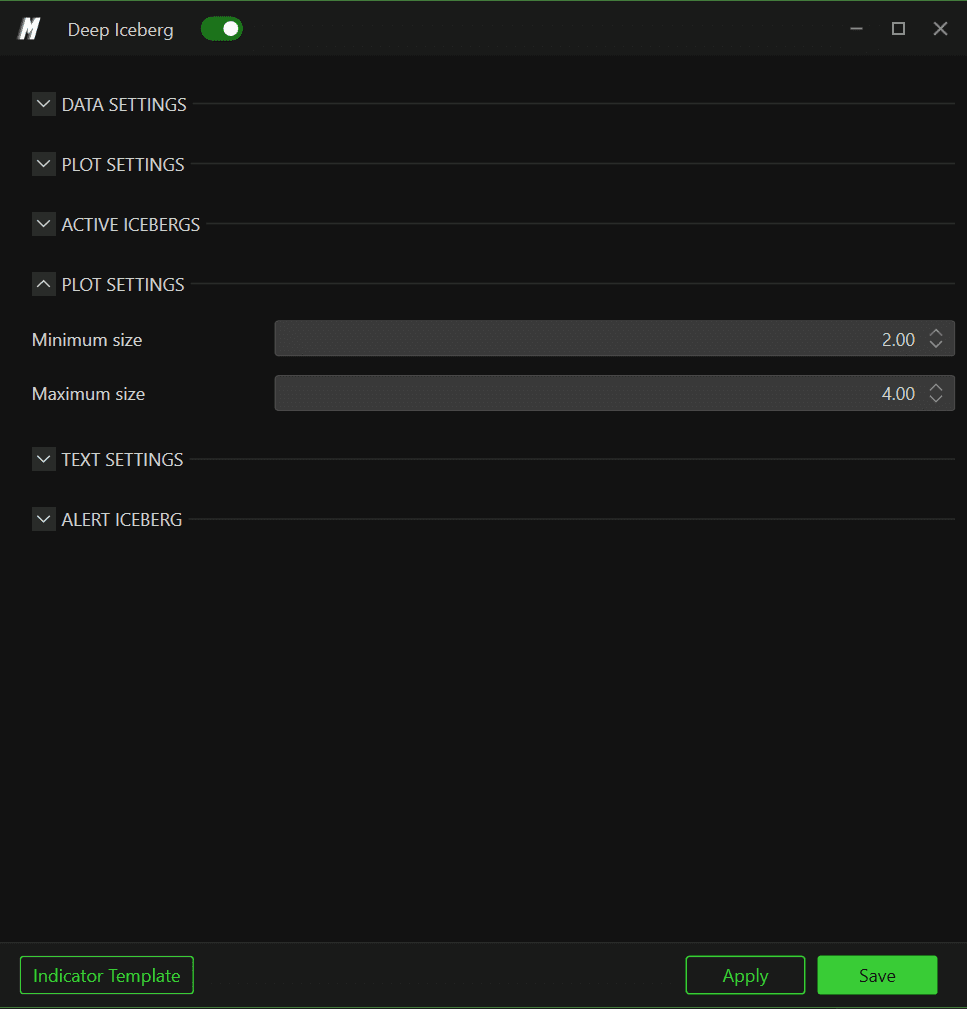
Minimum size / Maximum size – set the smallest and largest marker size that Deep Iceberg will use when drawing iceberg events. Use a narrow range if you prefer a more uniform look, or a wider range so that very large icebergs stand out with larger markers.
8. Text Settings
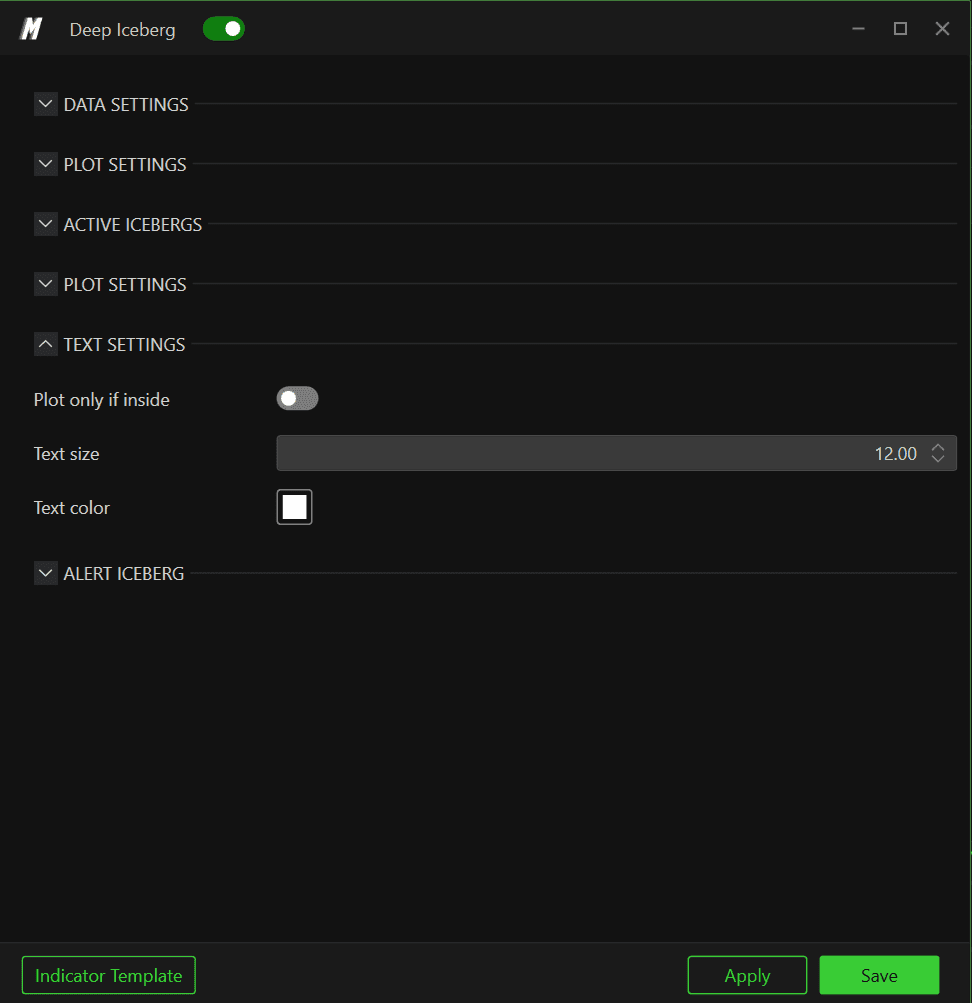
Use the Text Settings group to control the labels attached to iceberg markers:
Plot only if inside – when enabled, text labels are drawn only when they fit inside the current chart view, helping to avoid overlapping labels.
Text size – font size of the iceberg labels.
Text color – color used for the text, independent of marker color.
The label format is designed to make the iceberg structure easy to read at a glance, typically showing total executed size and maximum visible slice.
9. Alert Iceberg
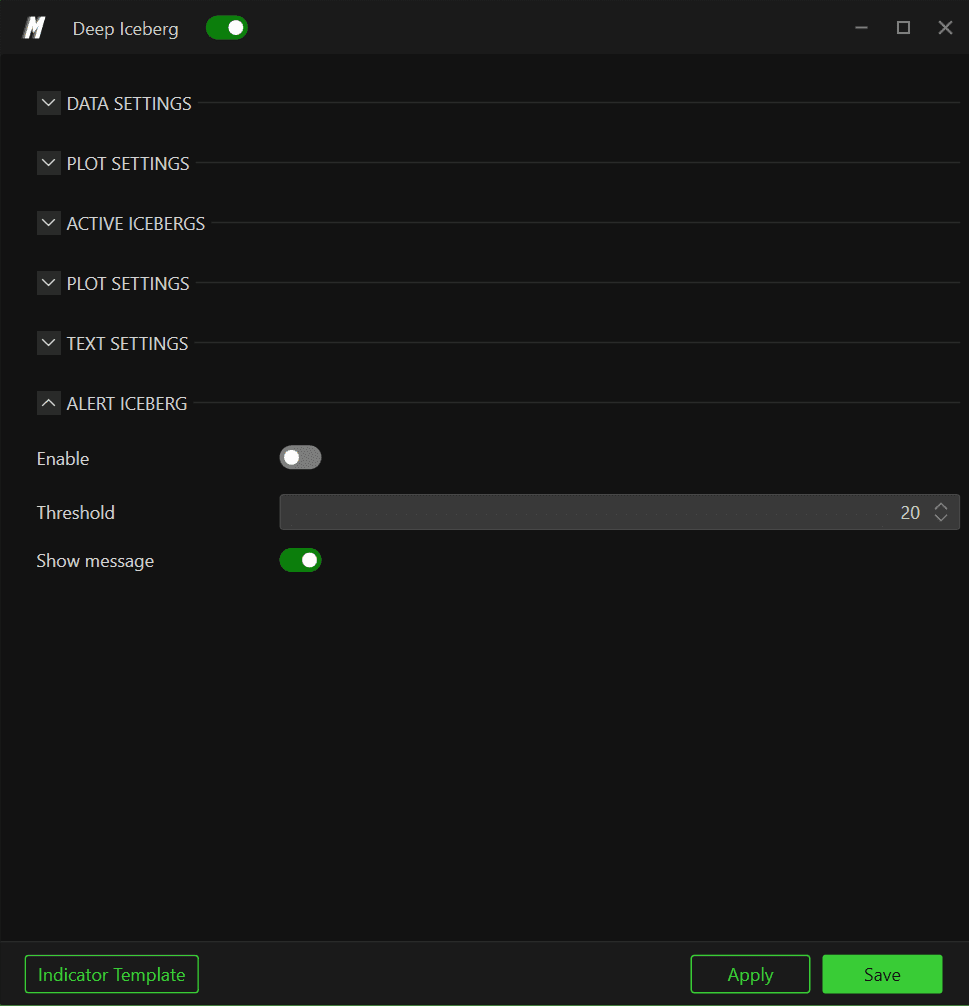
The Alert Iceberg section lets you trigger alerts when especially large icebergs are detected:
Enable – turns iceberg alerts on or off.
Threshold – minimum detected iceberg volume required to fire an alert. Set this high to be notified only about the most significant hidden orders in the market.
Alerts can be combined with the visual markers so you do not miss key hidden-liquidity events even when you are focused on another part of the chart.
10. Practical Use Cases
Deep Iceberg is particularly useful for spotting where a large player is absorbing market orders or feeding the market with a hidden supply.
MBO data feed is required to use Iceberg in DeepDom
Repeated buy-side icebergs near lows often signal stealth accumulation and a potential base.
Sell-side icebergs stacked above price can indicate distribution or a hidden seller defending a level.
When an important iceberg line finally disappears and price pushes through, it often marks a meaningful shift in control.
Still Having Trouble?
Our support team is available 24/7 and ready to help you with any issue you encounter.
When reaching out, please include:
A screenshot of the issue
A brief description of what you were trying to do
Support Ticket (Fastest Response) Visit www.deepcharts.com and create a support ticket directly on our website.
Email Support Reach us at support@deepcharts.com — please note that email responses may take a little longer than a support ticket.