Deep Indicators
Updated:
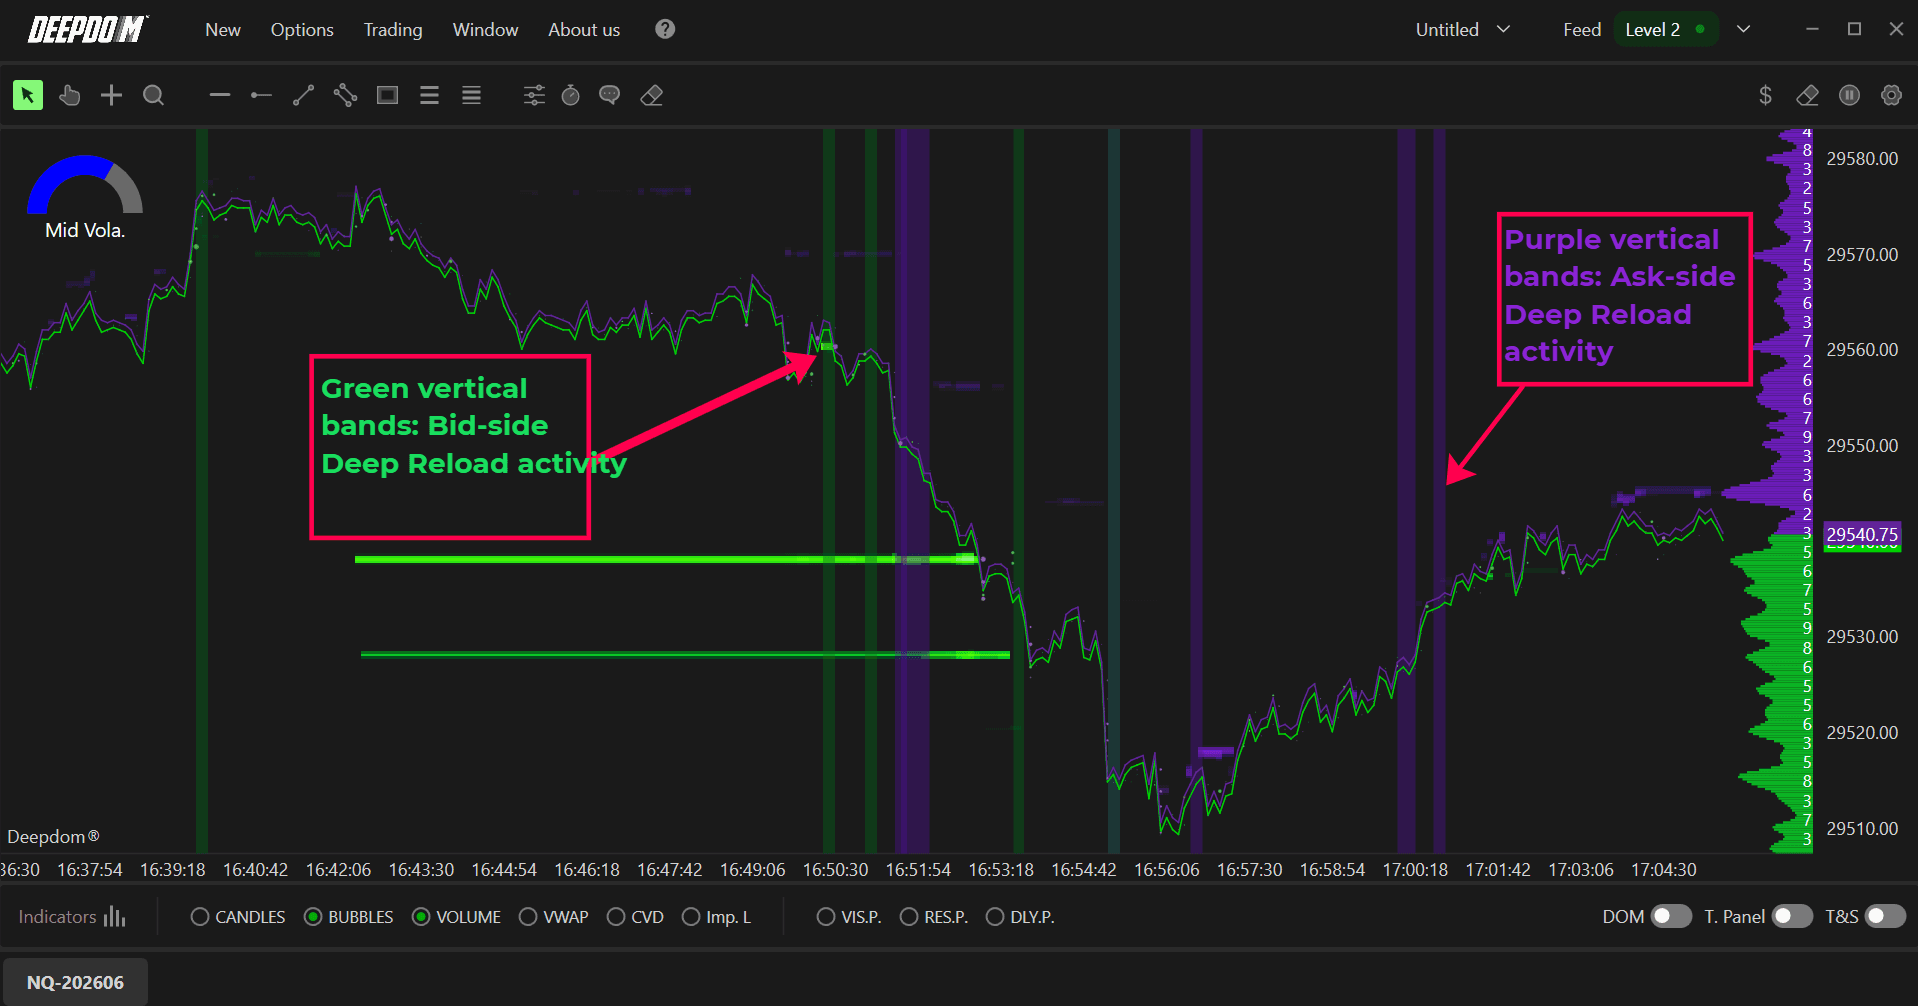
Deep Reload (Fresh Liquidity Detector) scans the order book in real time to find moments when fresh resting liquidity suddenly appears near the current price. Instead of watching every Level 2 update, you get clear horizontal bands showing where new size has just been added on the bid (potential support) or ask (potential cap), helping you see when larger participants step in to defend a level or assist a breakout.
1. Concept: Fresh Resting Liquidity
Resting liquidity is the visible volume sitting in the order book at each price level. When a big trader or algorithm decides to get involved, they often add size close to the current price rather than chasing the move. Deep Reload focuses on these additions: it detects when a meaningful amount of new volume suddenly appears in a narrow band of prices around the inside market.
This fresh liquidity can act as a buffer (bids stacking below price to support it) or a ceiling (asks stacking above price to slow or reverse a rally). In many cases the behaviour is related to iceberg or sliced orders, where only part of the true size is shown at once but the trader keeps re‑adding liquidity at the same area.
The goal of Deep Reload is not to show all book changes, but to highlight only those reloads that exceed your size thresholds so that important areas remain visible even when the chart is zoomed out.
2. General Settings
2.1 Value Type
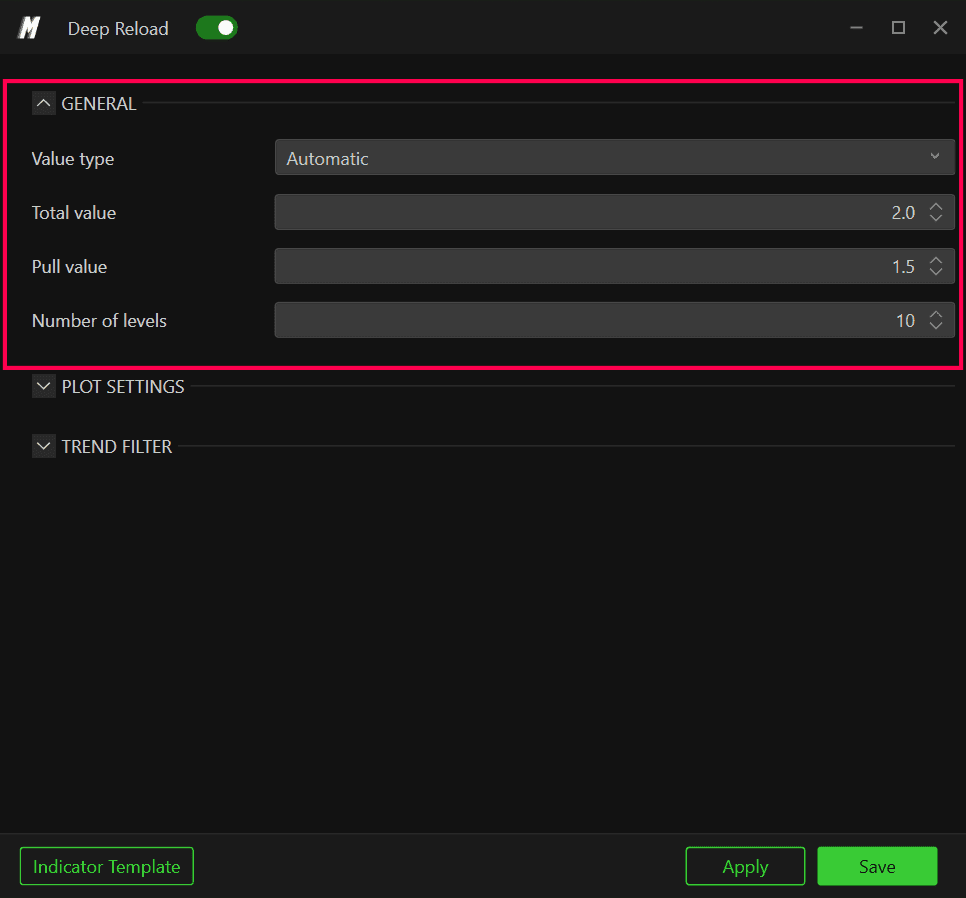
Value type controls how Deep Reload chooses the size thresholds that define a signal:
Automatic – thresholds are derived from current order‑book conditions, adapting to each instrument's typical depth and volatility.
Manual – lets you specify numeric values for Total value and Pull value yourself.
2.2 Total Value
Total value defines how much new volume must appear in a price area before a Deep Reload band is drawn. The indicator sums all qualifying additions in that area over a short period; only when the total exceeds this threshold is the zone plotted.
Use higher values on very liquid markets (ES, NQ) and lower values on thinner products so that signals represent truly meaningful fresh liquidity for that instrument.
2.3 Pull Value
Pull value is the minimum size that must be removed or changed from the book in a single event for Deep Reload to treat the sequence as an intentional reload rather than random noise. Small micro‑cancels below this value are ignored.
In practice, many reload patterns involve a combination of volume being pulled and then quickly re‑added at the same or neighbouring levels. Pull value helps the algorithm distinguish these sequences from ordinary fluctuations in the book.
2.4 Number of Levels
Number of levels tells Deep Reload how wide a band around price to monitor. For example, with a value of 10 the indicator tracks fresh liquidity across the top 10 bids and top 10 asks and aggregates qualifying events into a single zone when they occur within that window.
Smaller values focus the detector very close to the inside market; larger values capture deeper liquidity that may still be relevant when you trade with wider stops
3. Plot Settings
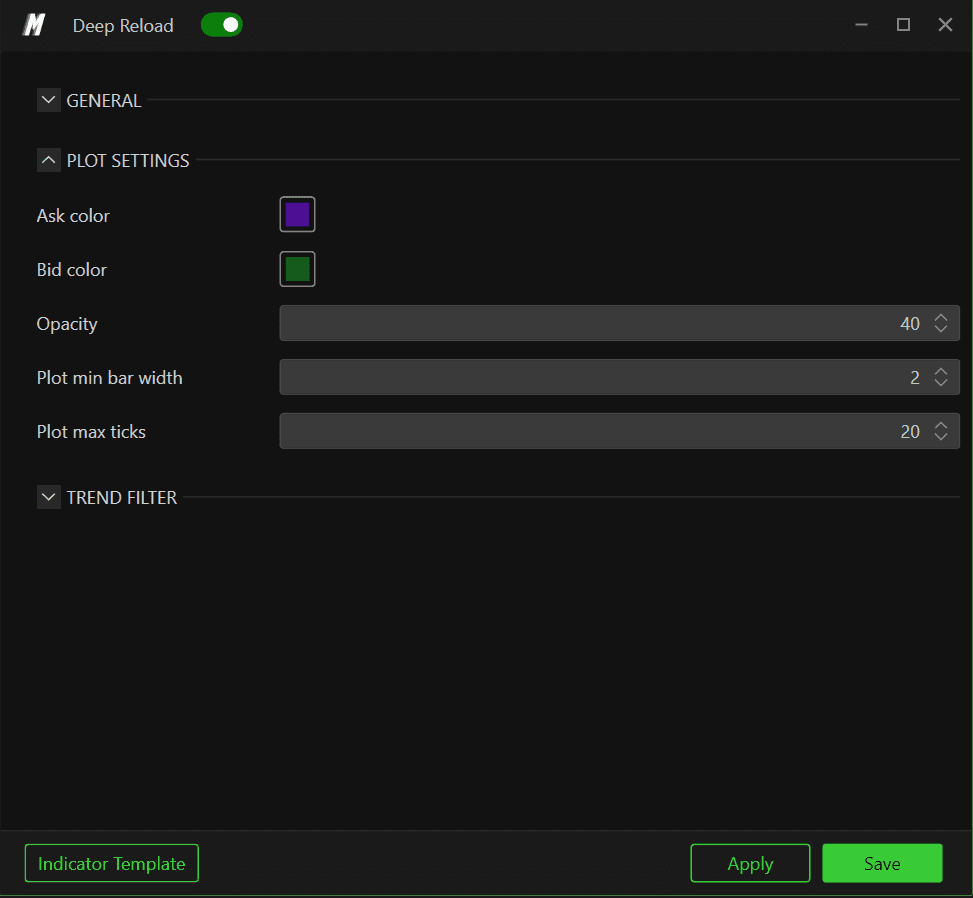
The Plot Settings section defines how fresh‑liquidity zones appear visually on the chart.
3.1 Ask / Bid Color
Choose separate colours for Ask and Bid reload zones. By default, DeepDom uses purple for ask‑side fresh liquidity (potential resistance) and green for bid‑side fresh liquidity (potential support).
3.2 Opacity
Opacity sets the transparency of the horizontal bands. Lower opacity makes them subtle when you already have many overlays; higher opacity emphasises reloads as primary decision levels.
3.3 Plot Min Bar Width
Plot min bar width enforces a minimum horizontal width so that each band remains visible even when you zoom out
3.4 Plot Max Ticks
Plot max ticks limits the vertical height of each zone in price ticks. When fresh liquidity is detected at several adjacent levels, Deep Reload groups them into a single band up to this maximum range so you can see the entire defended area at a glance.
4. Trend Filter
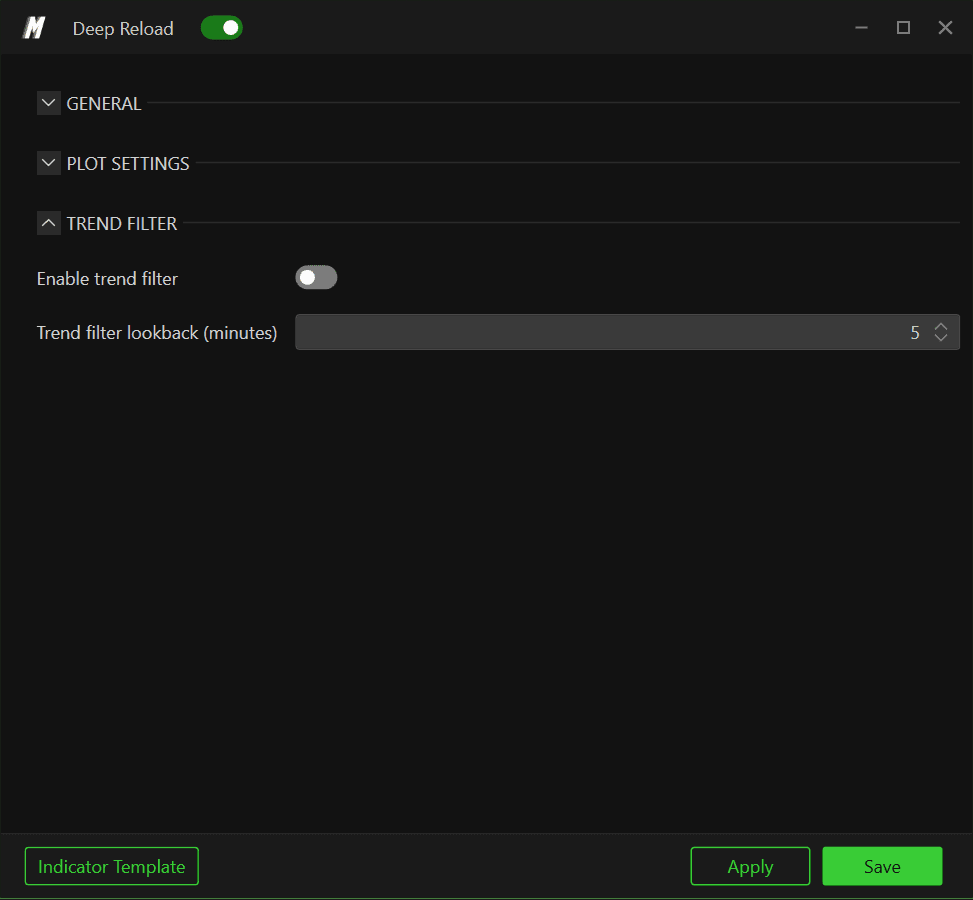
The optional Trend Filter restricts signals to those that align with a short‑term trend over a configurable lookback period.
Enable trend filter – turns this behaviour on or off.
Trend filter lookback (minutes) – sets how many minutes of recent price action are used to estimate trend direction (e.g., via a moving average or VWAP comparison).
With the filter enabled, you can choose to focus only on fresh liquidity that supports the current bias (e.g., bid reloads in an up‑move, ask reloads in a down‑move) and ignore counter‑trend bands.
5. Practical Trading Uses
5.1 Spotting Defended Levels
When Deep Reload paints repeated green bands just below price, it suggests buyers are stepping in with new resting liquidity to defend that area. Many traders use these zones as reference levels for long entries with tight risk just beyond the band.
5.2 Detecting Absorption Near Highs or Lows
Purple bands forming around recent highs indicate fresh ask liquidity absorbing aggressive buyers. If price struggles to trade through despite strong buying flow, it can signal potential exhaustion and a possible reversal.
5.3 Supporting Breakouts
In breakouts, bands forming behind the move—bids reloading just below a bullish break or asks reloading just above a bearish break—show that larger players are helping hold the new range rather than fading it. These zones often become useful pullback entries.
6. Best Practices
Tune per instrument: start with Automatic value type, observe typical band frequency, then switch to manual thresholds if you need either more or fewer signals.
Combine with other DeepDom tools: align Deep Reload zones with CVD and Deep Trades to build a complete picture of passive vs aggressive participation.
Avoid over‑reliance on single bands: treat fresh‑liquidity zones as context and confirmation, not as stand‑alone trade triggers.
Still Having Trouble?
Our support team is available 24/7 and ready to help you with any issue you encounter.
When reaching out, please include:
A screenshot of the issue
A brief description of what you were trying to do
Support Ticket (Fastest Response) Visit www.deepcharts.com and create a support ticket directly on our website.
Email Support Reach us at support@deepcharts.com — please note that email responses may take a little longer than a support ticket.