Updated:
Option Profile displays a visual profile of options activity directly on your chart, showing where the most call and put volume or gamma volume is concentrated across different strike prices. Think of it like a volume profile but for options - it helps you identify the key call and put walls where significant options positioning exists, giving you a structural view of where the market may find support or resistance.
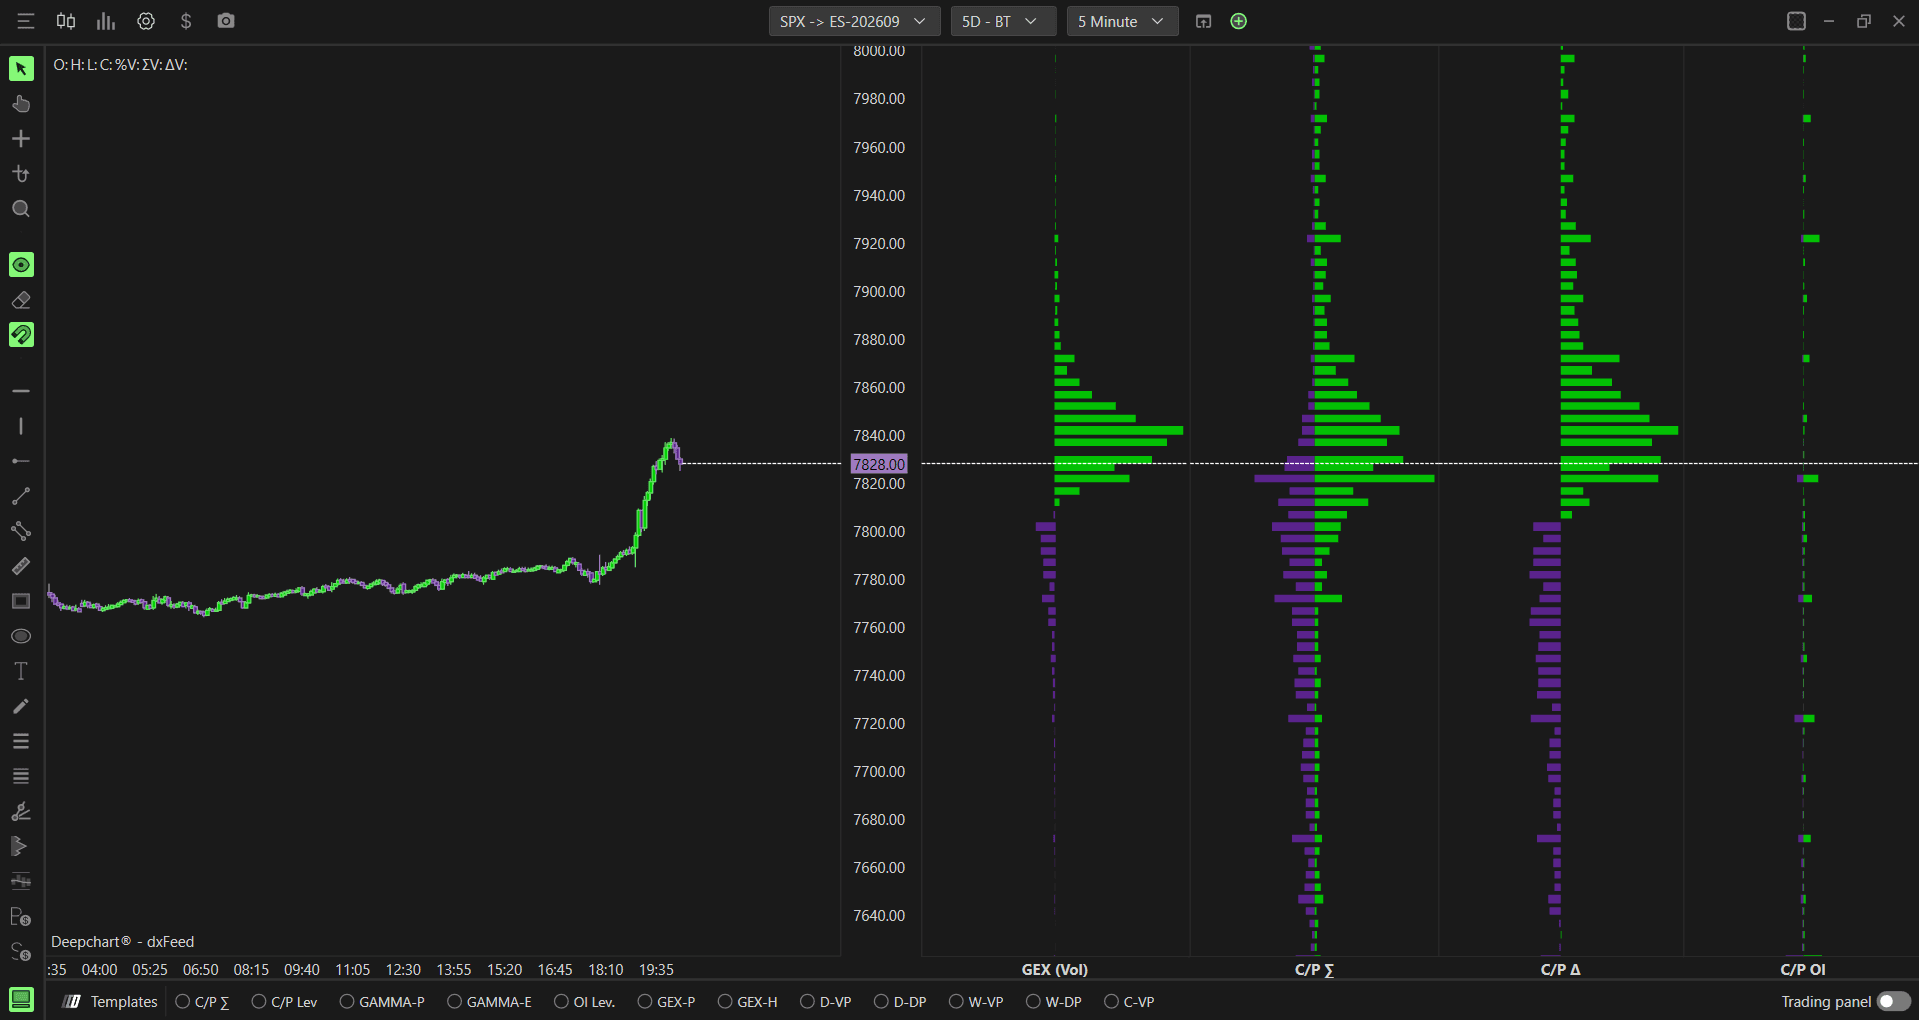
Note: Option Profile is available on NDX, QQQ, SPY, and SPX.

How to Add Option Profile
Method 1 - Via Indicator Tab
Go to New in the top menu
Click on Option Chart
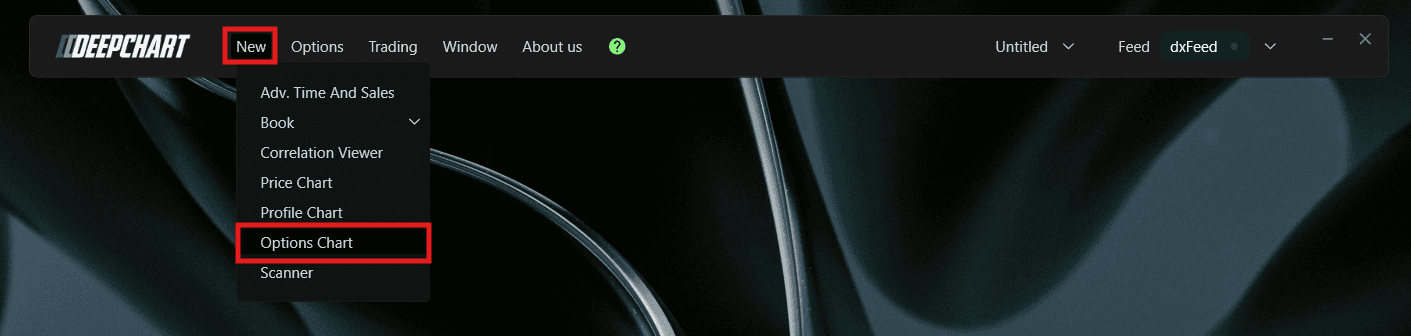
A Select Instrument dialog will appear with the following options:
NDX - Symbol: NQ-CME, Exchange: CME
QQQ - Symbol: NQ-CME, Exchange: CME
SPX - Symbol: ES-CME, Exchange: CME
SPY - Symbol: ES-CME, Exchange: CME
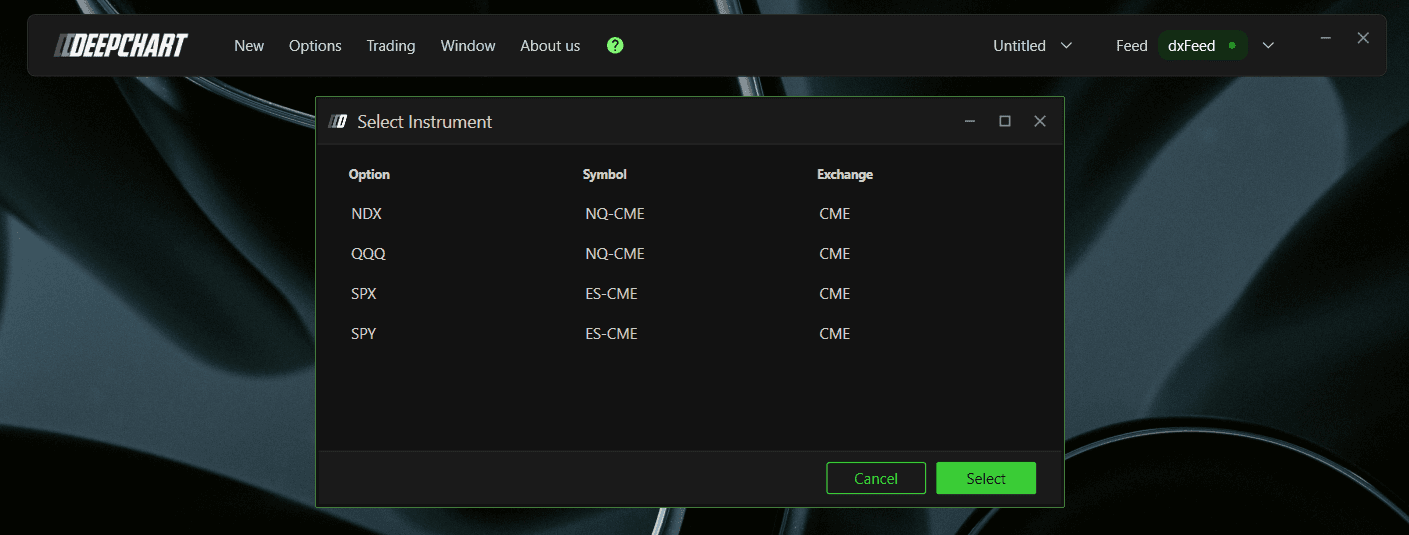
Select your preferred instrument and click to open the chart
Once the Option Chart is loaded, click the Indicator Add button on the chart toolbar
Search for Option Profile and click + to add it
Click the settings icon to open the configuration window
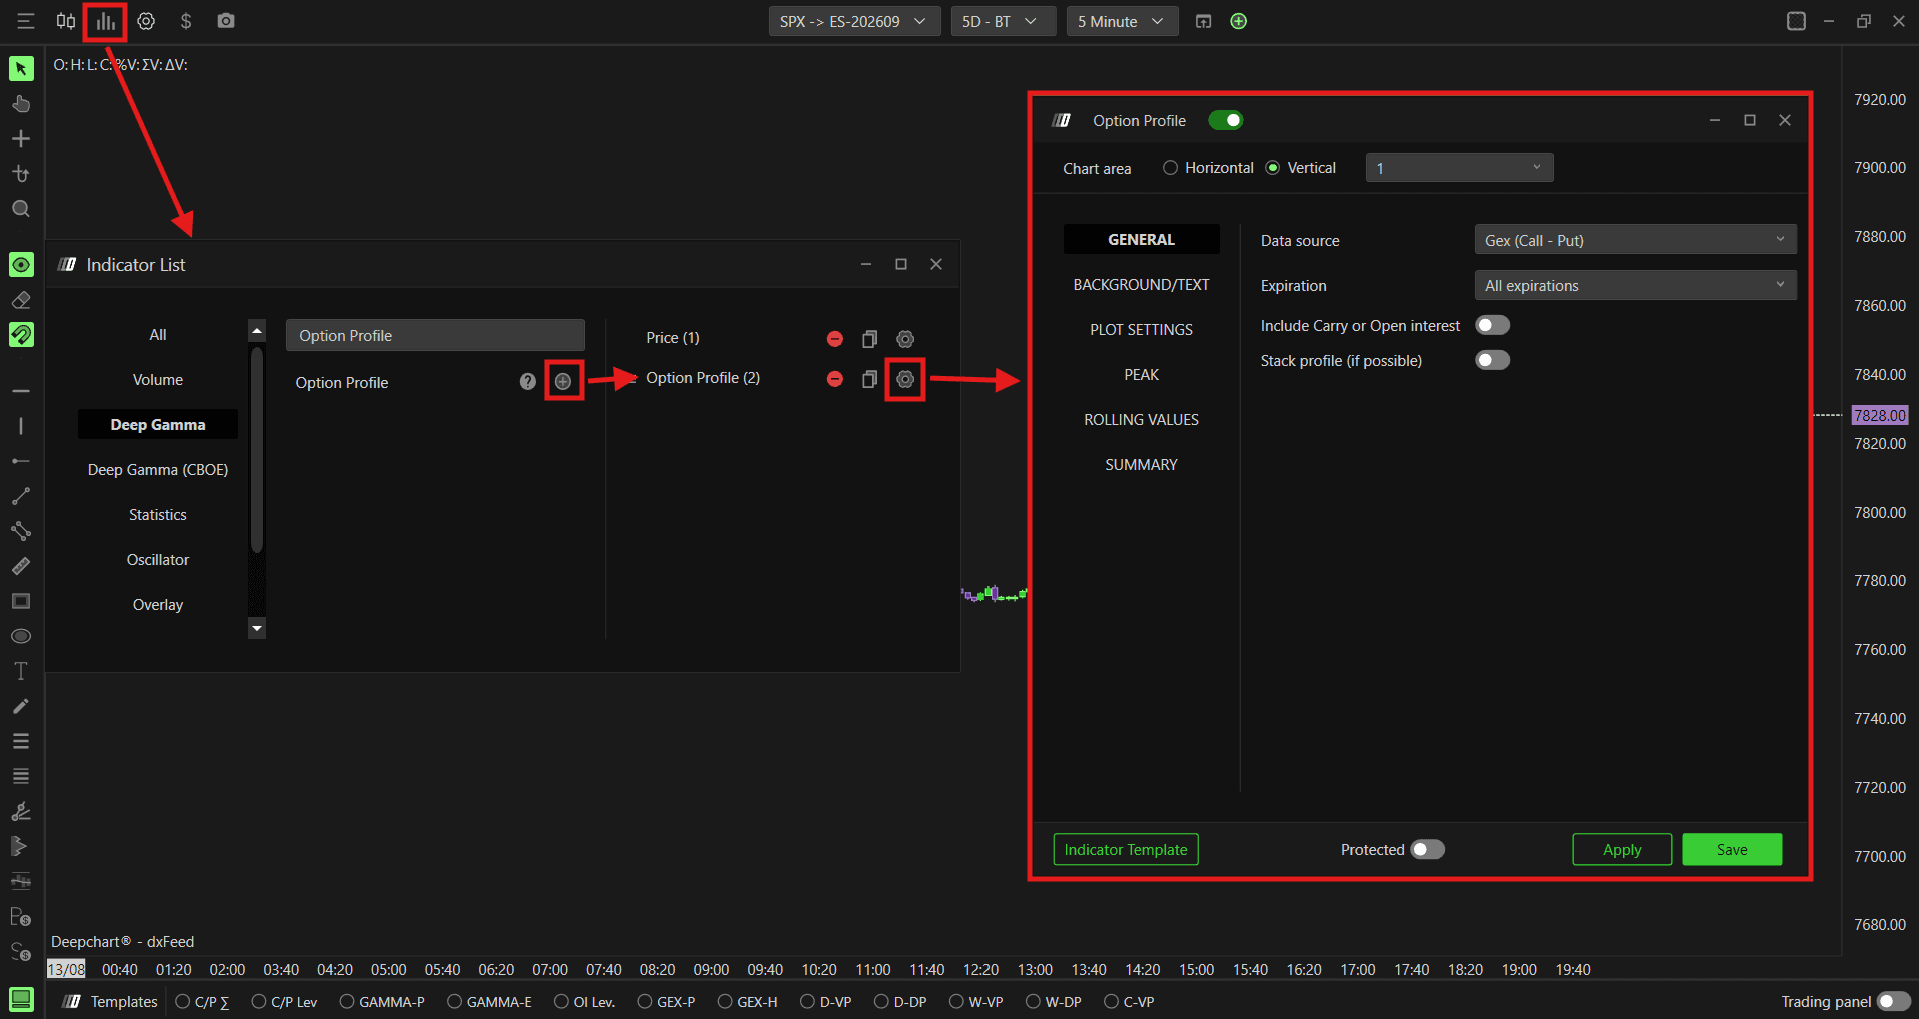
Method 2 - Via Templates Bar
Once the Option Chart is open, you can quickly enable the Option Profile directly from the Templates bar at the bottom of the chart.
Locate the Templates bar at the bottom of the Option Chart
Click on C/P Σ or GAMMA-P to instantly load the Option Profile on your chart

Once the Option Profile is enabled, you can access its settings at any time by right-clicking on the C/P Σ or GAMMA-P tab in the Templates bar and selecting Settings.
Understanding the Profile
The Option Profile displays two sides:
Green bars (left side) - Call side activity at each strike, based on your selected data source. A large concentration of green bars at a strike indicates a significant call wall, an area where price may face resistance as it moves up
Purple bars (right side) - Put side activity at each strike, based on your selected data source. A large concentration of purple bars at a strike indicates a significant put wall, an area where price may find support as it moves down
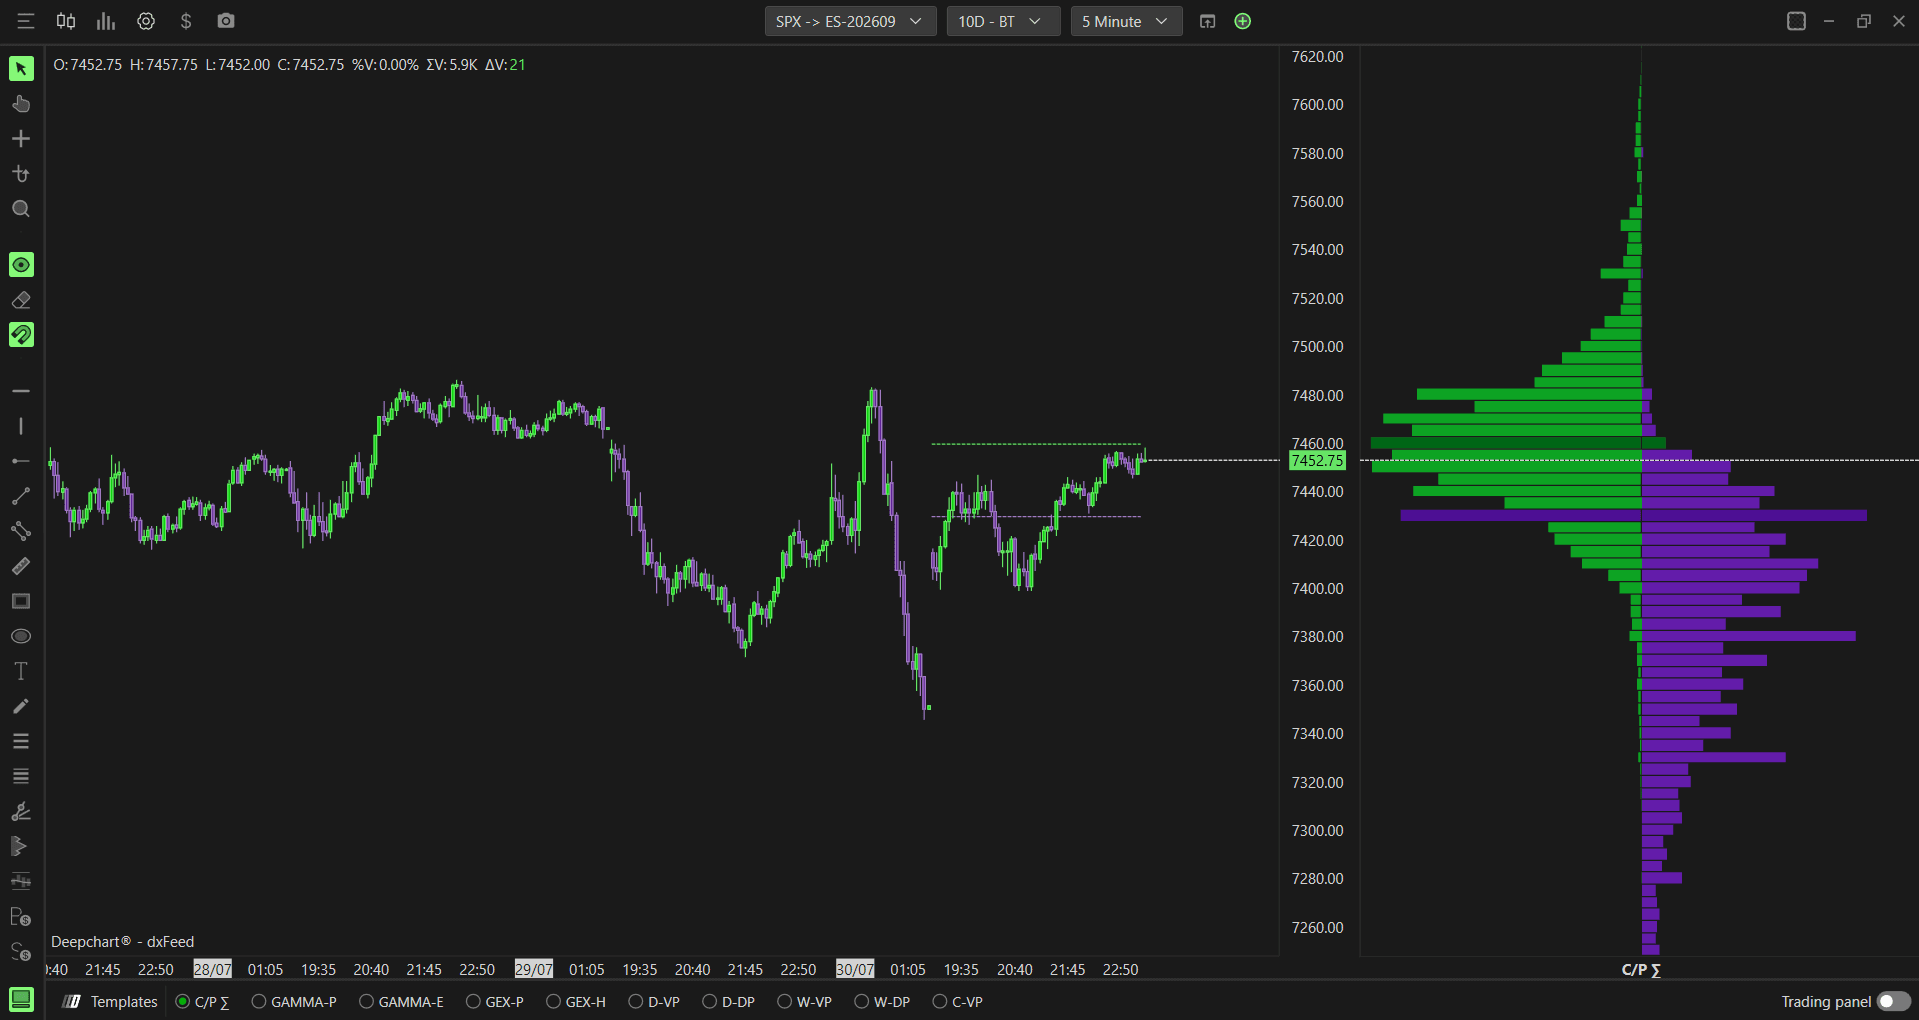
The values shown depend on which data source you have selected, ranging from raw contract volume to gamma-weighted exposure to end of day open interest. See the Data source setting below for details on each option.
Understanding Key Terms
Before choosing a data source, it helps to understand a few core options concepts:
Call - An option that gives the buyer the right to buy the underlying at a set price. Traders buy calls when they expect price to go up
Put - An option that gives the buyer the right to sell the underlying at a set price. Traders buy puts when they expect price to go down
Gamma - A measure of how much an option’s delta changes as price moves. High gamma means dealers need to hedge more aggressively as price approaches a strike, which is why gamma concentrations often act as support or resistance
GEX (Gamma Exposure) - An estimate of the gamma exposure dealers are carrying at a given strike, combining volume with the gamma greek to show where dealer hedging pressure is likely to be strongest
OI (Open Interest) - The total number of option contracts currently open and not yet closed or expired
EOD (End of Day) - Data based on the official open interest figures published at the close of the previous trading session, rather than live intraday activity
Settings
General
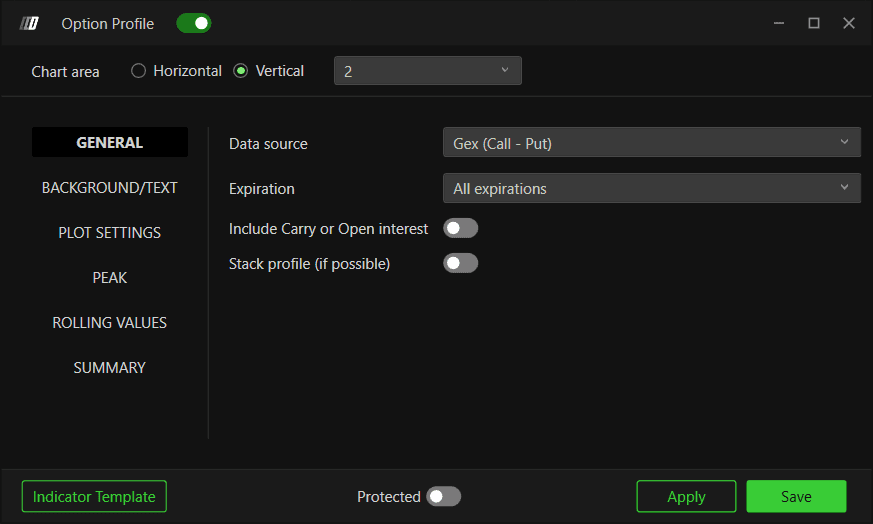
Data source - Choose how the profile is calculated. Options available:
Gex (Call - Put) - calculates the profile as net gamma exposure, showing call gamma minus put gamma at each strike, using the standard assumption that market makers are long calls and short puts.
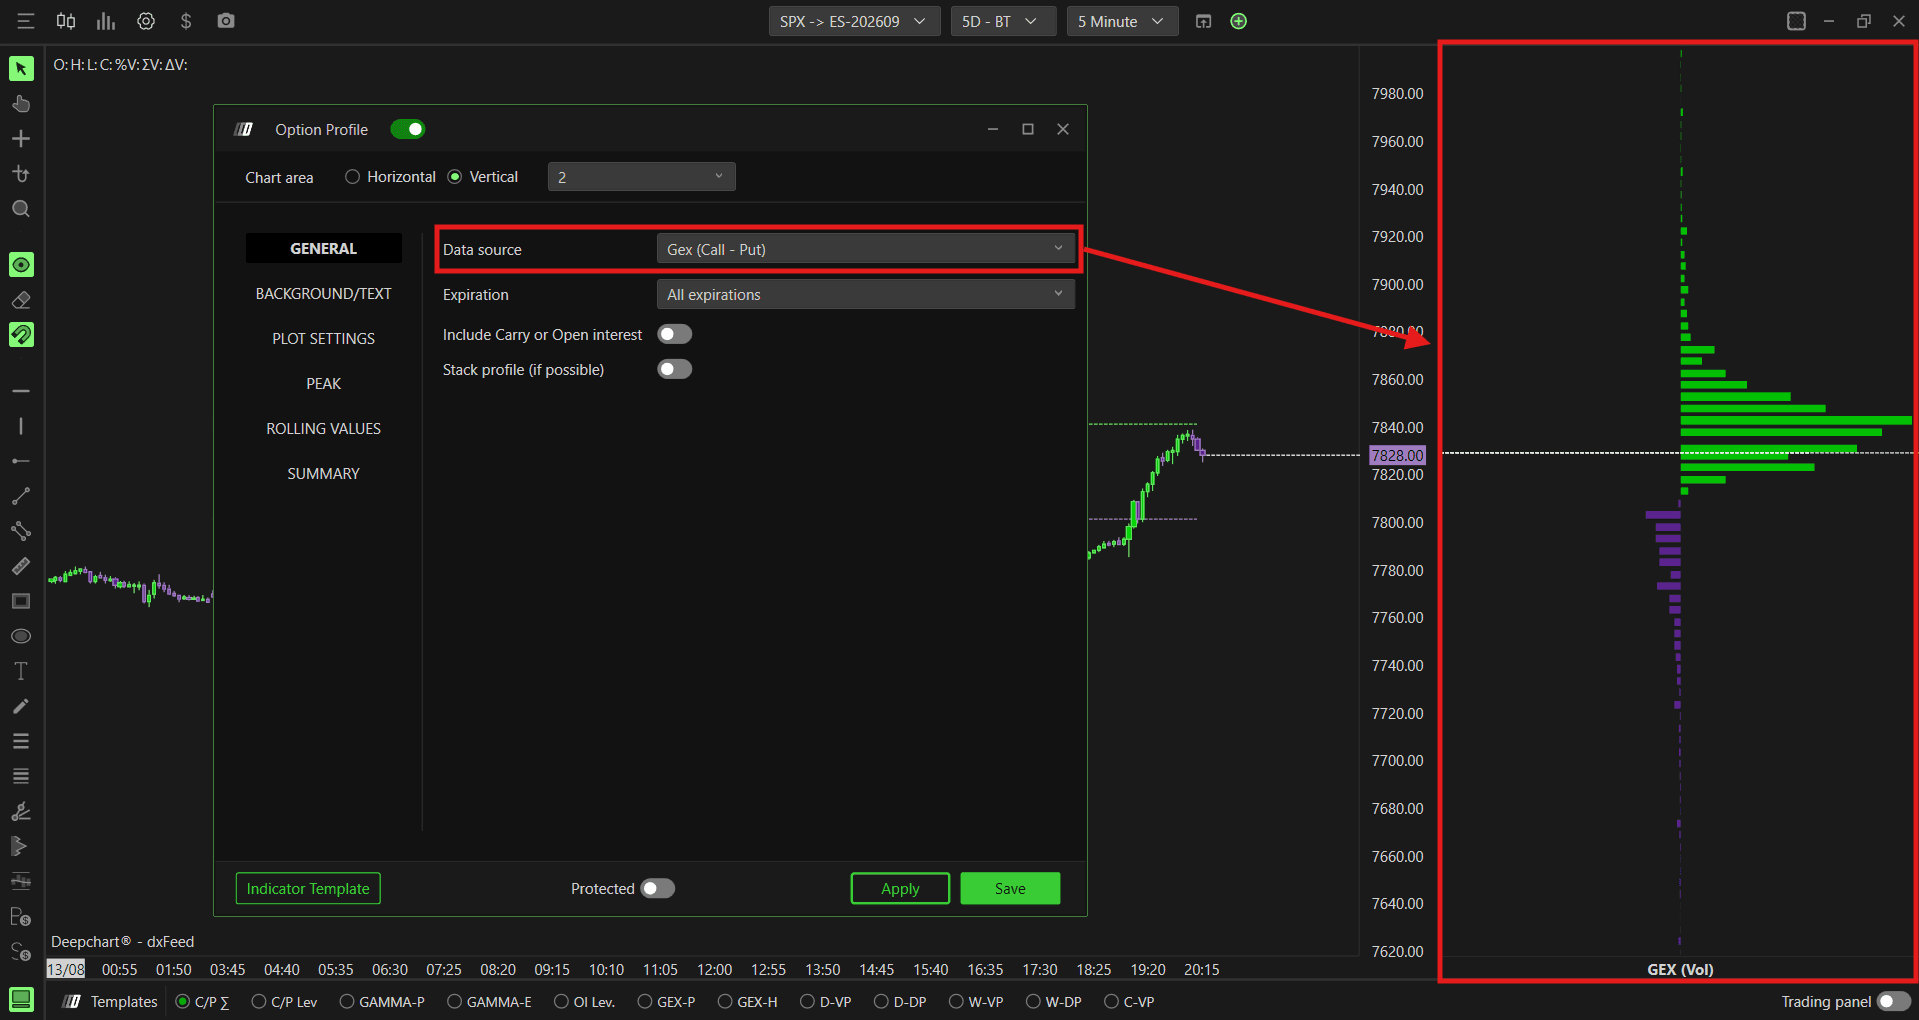
Use this when: you want a gamma-weighted read on positioning and market regime, similar to what you would use to read Option EnvelopesCall/Put Σ - displays raw call and put options volume at each strike, showing where the most contracts are concentrated.
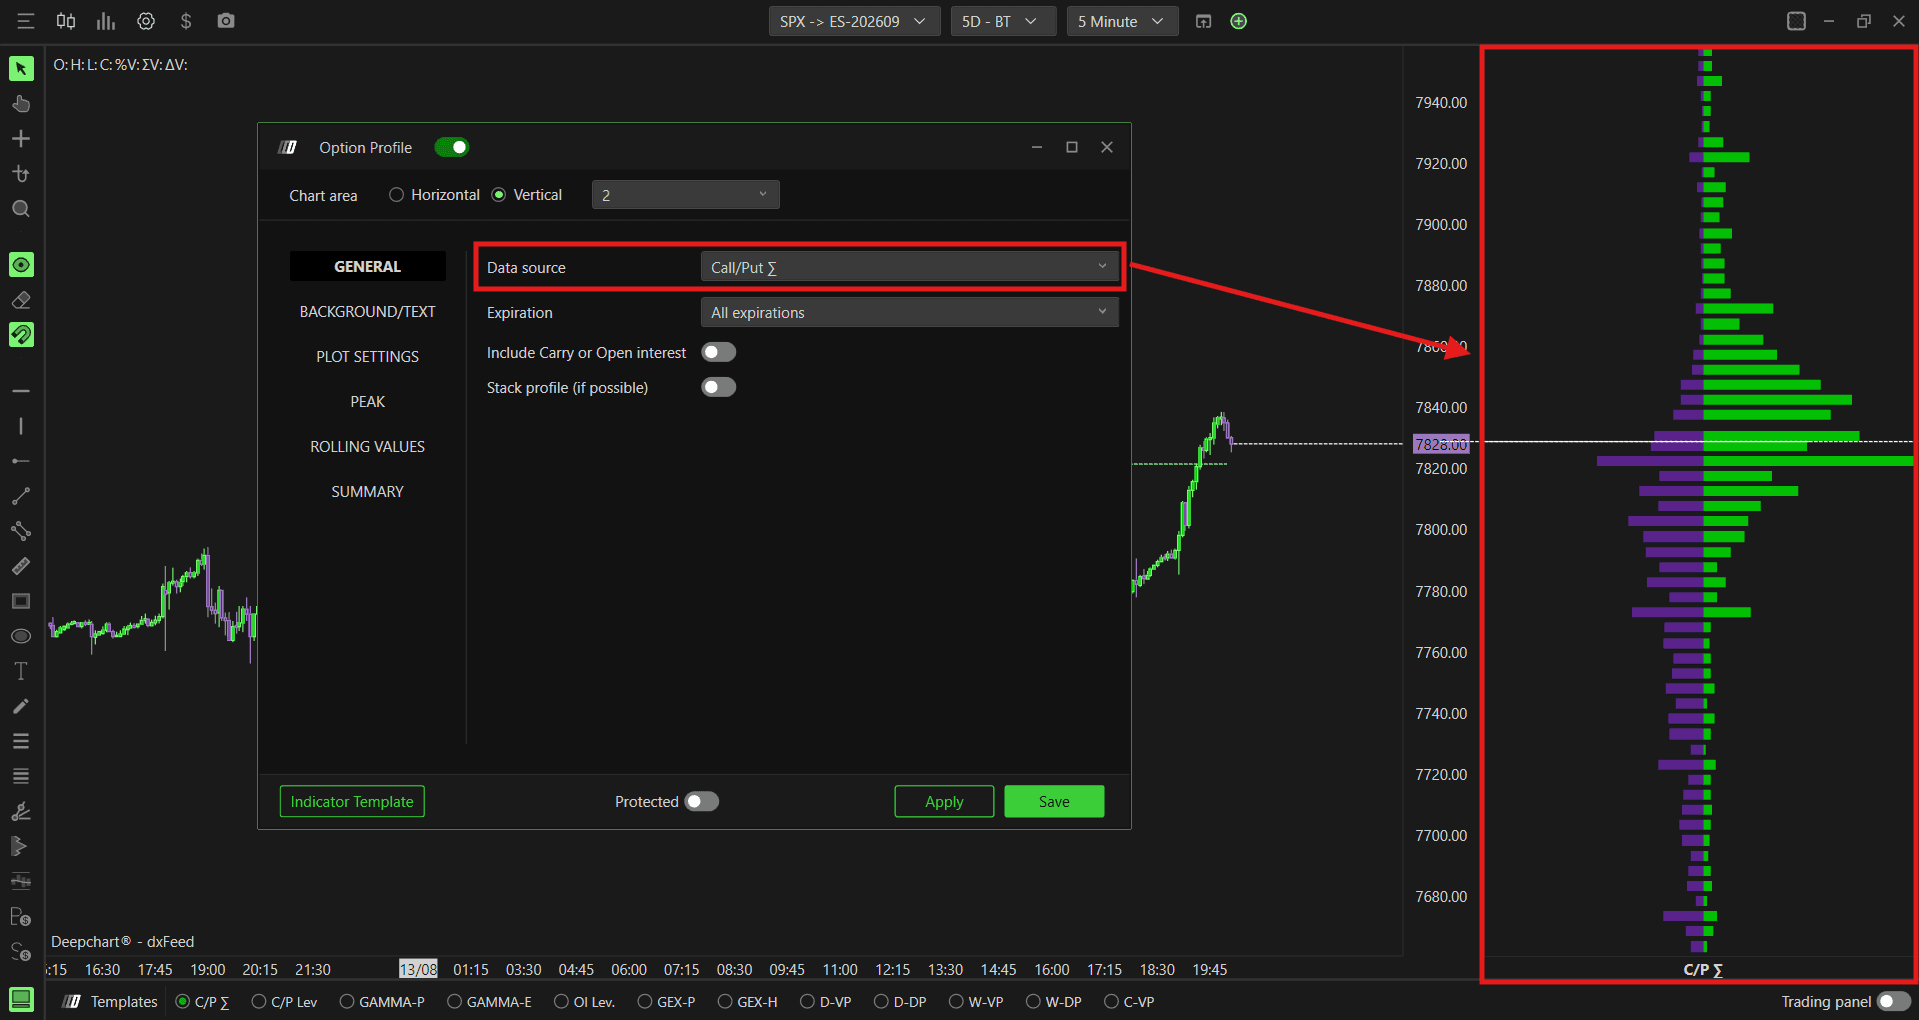
Use this when: you want a simple read on where the most contracts are trading, regardless of gamma weightingCall Σ - Put Σ - displays the net difference between call and put volume at each strike.
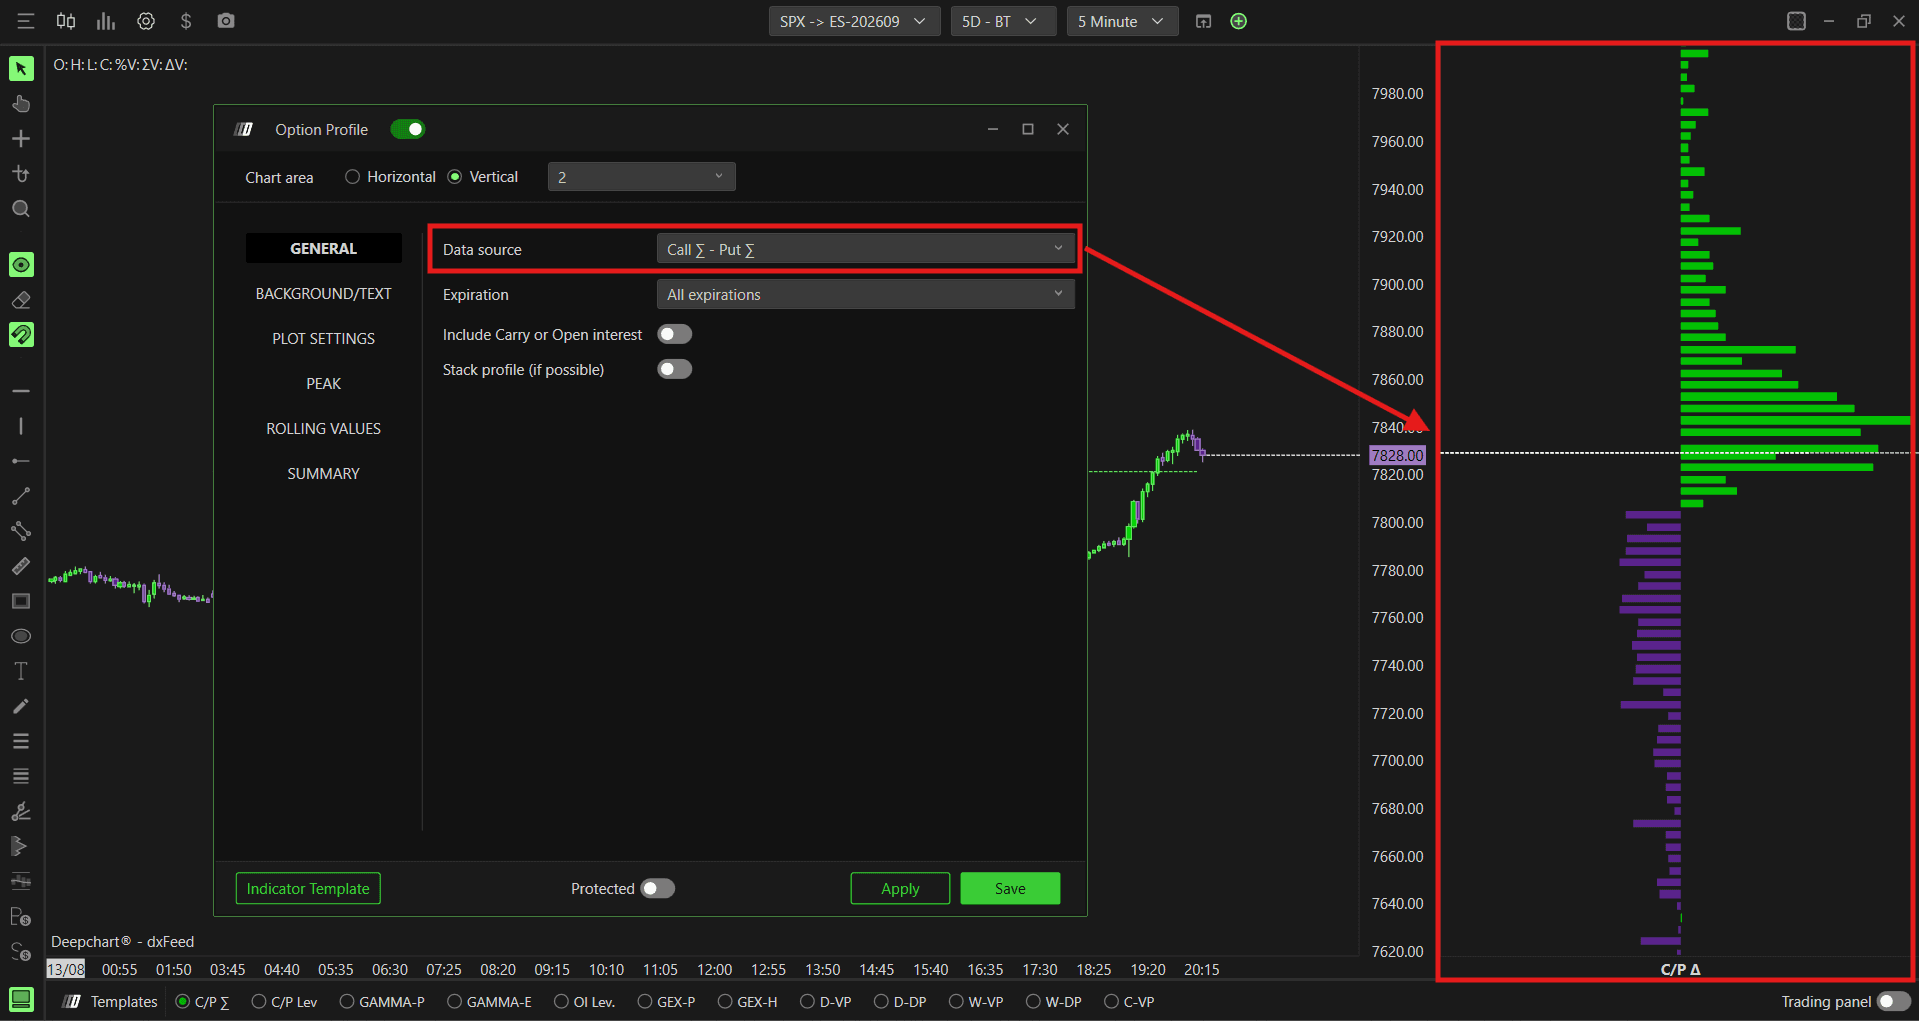
Use this when: you want to spot directional skew in raw contract activity, without factoring in gammaCall/Put OI (Eod) - displays the profile based on end of day open interest data for calls and puts.
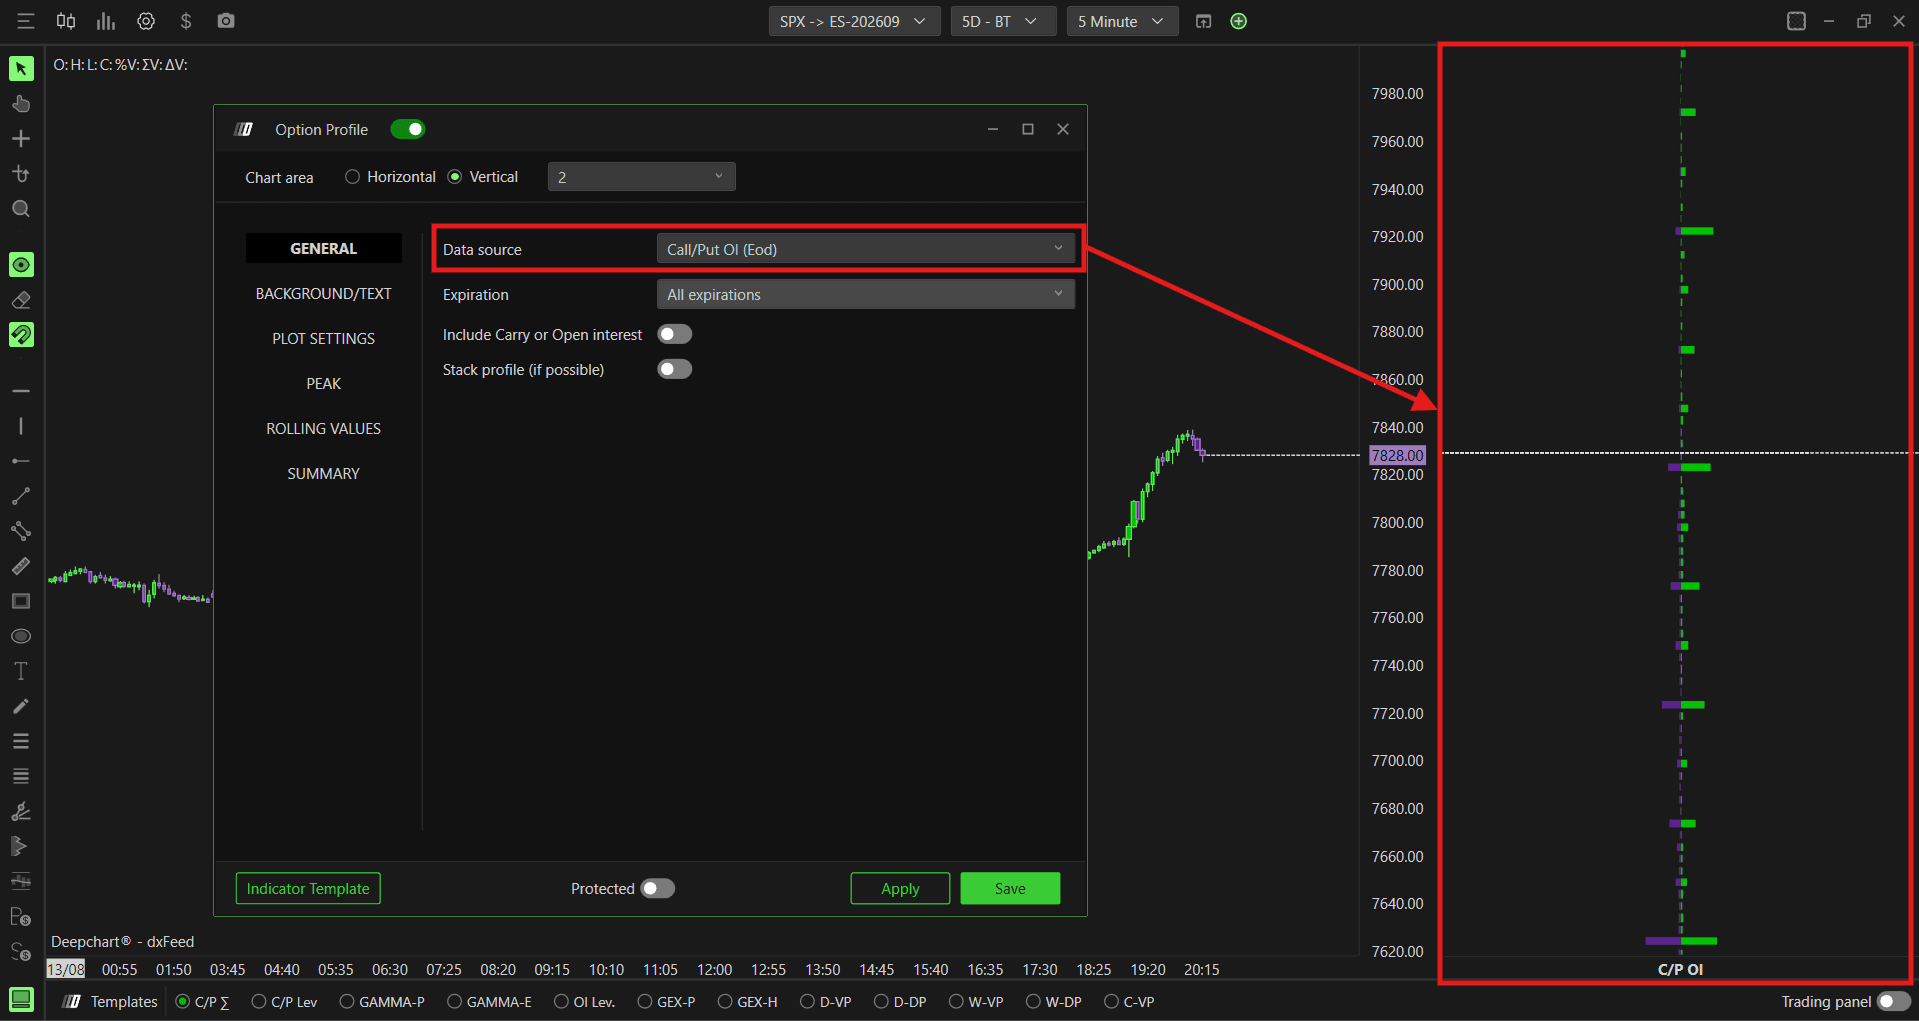
Use this when: you want a structural view of standing positions from the previous session’s close, rather than live intraday trading activity
Expiration - Filter the profile by expiration. Options available: 0 DTE, <= 1d, <= 7d, <= 31d, <= 91d, All expirations. Default is All expirations
Include Carry or Open Interest - When enabled, includes open interest carried over from previous sessions into the calculation, giving you a broader view of total positioning. When disabled, only the current session data is considered. Default is disabled
Stack profile (if possible) - When enabled, the call and put profiles are stacked together side by side for a combined view. When disabled, the call and put profiles are displayed separately. Default is disabled
Stack Profile Example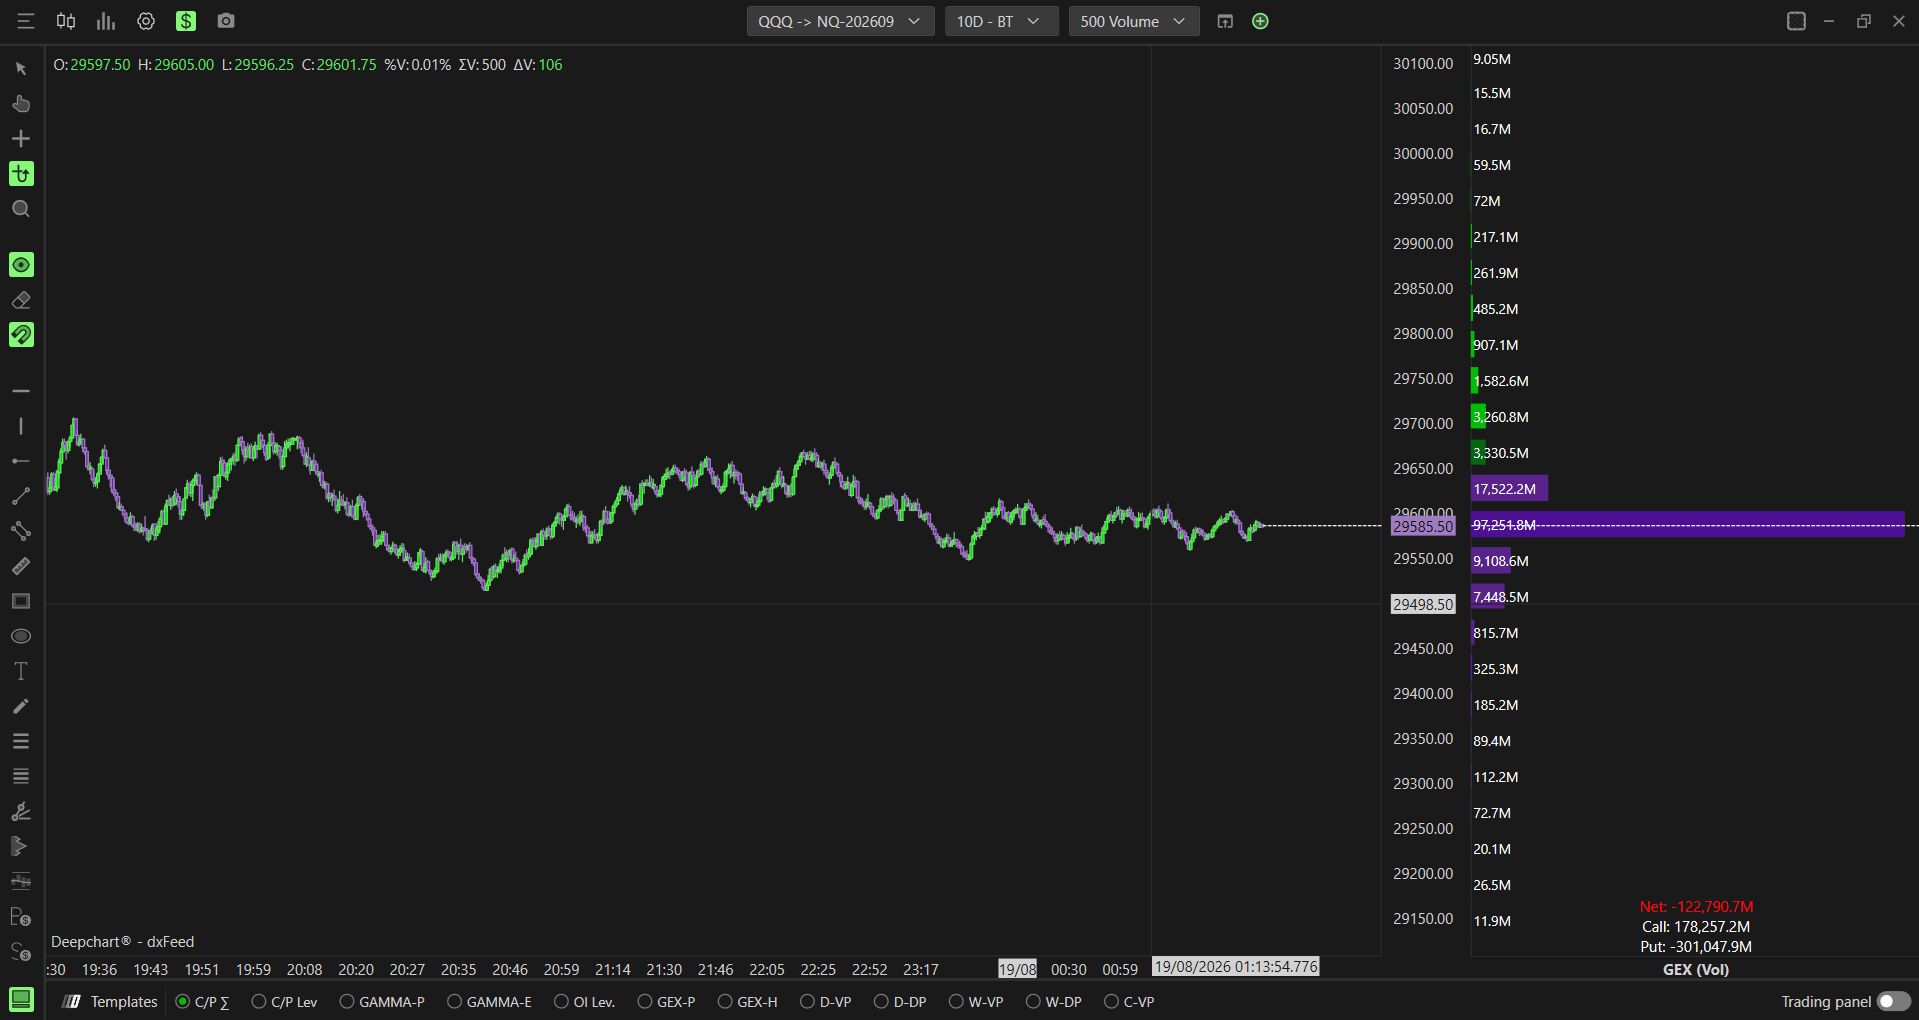
Background/Text
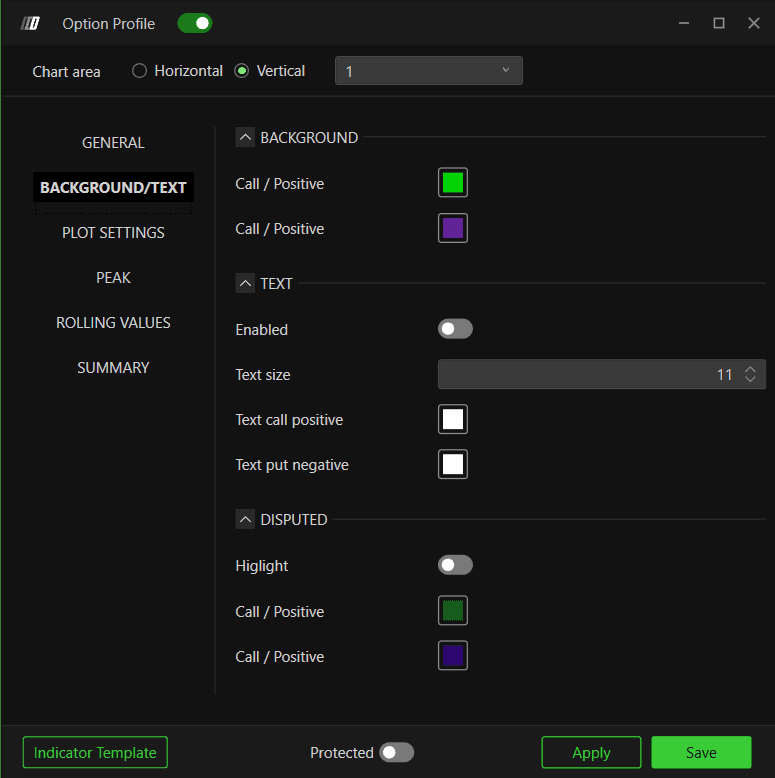
Background
Call / Positive - Set the color for the call side background. Default is green
Call / Positive (put side) - Set the color for the put side background. Default is purple
Text
Enabled - Toggle to show or hide text labels on the profile. Default is disabled
Text size - Set the font size for the text labels. Default is 11
Text call positive - Set the text color for call side labels. Default is white
Text put negative - Set the text color for put side labels. Default is white
Disputed
Highlight - When enabled, highlights strikes where the data is disputed or overlapping between call and put activity. Default is disabled
Call / Positive - Set the highlight color for the call side. Default is green
Call / Positive (put side) - Set the highlight color for the put side. Default is purple
Plot Settings
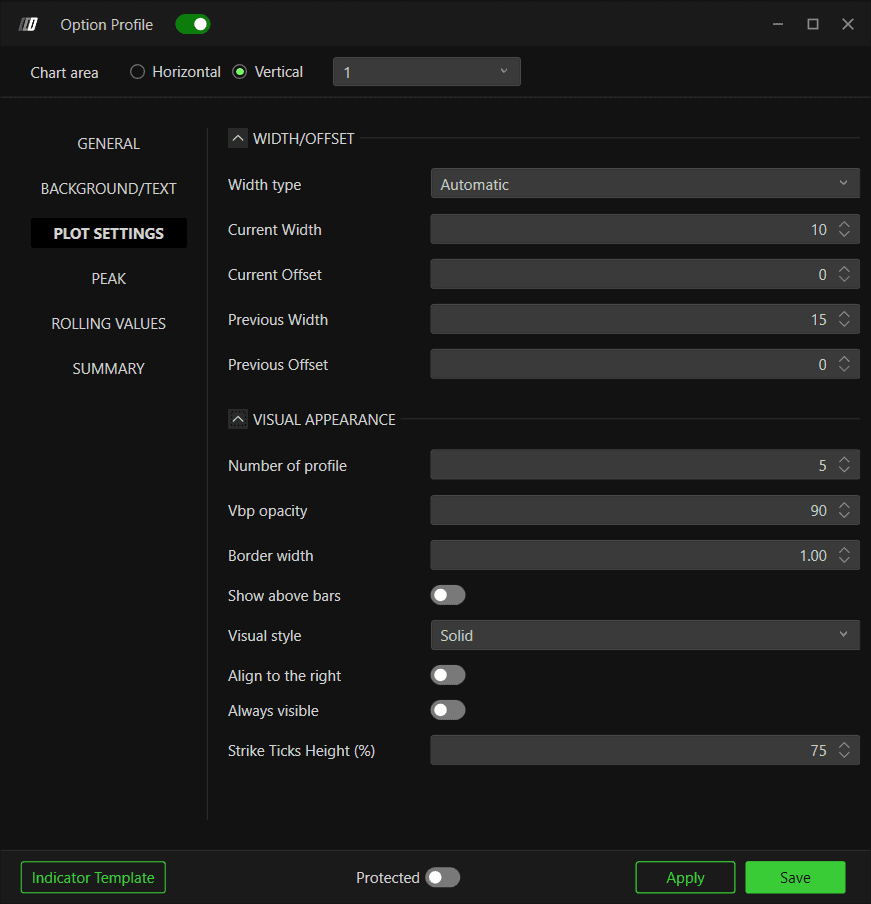
Width/Offset
Width type - Choose how the profile width is calculated. Options available:
Automatic (default) - DeepChart automatically sets the profile width based on the current chart view
Percentual period - sets the width as a percentage of the visible chart period
Window width - sets the width based on the current visible window
Fixed bars - sets a fixed number of bars for the profile width
Current Width - Set the width of the current session profile. Default is 10
Current Offset - Set the horizontal offset of the current session profile. Default is 0
Previous Width - Set the width of previous session profiles. Default is 15
Previous Offset - Set the horizontal offset of previous session profiles. Default is 0
Visual Appearance
Number of profile - Set how many session profiles are displayed on the chart. Default is 5
Vbp opacity - Set the opacity of the profile bars. Default is 90
Border width - Set the border width of the profile bars. Default is 1.00
Show above bars - When enabled, the profile is displayed on top of the price bars. Default is disabled
Visual style - Choose between Solid or Hollow profile bars. Default is Solid
Align to the right - When enabled, aligns the profile to the right side of the chart. Default is disabled
Always visible - When enabled, keeps the profile visible even when scrolling outside its range. Default is disabled
Strike Ticks Height (%) - Set the height of each strike’s bar as a percentage, controlling how thick or thin the individual strike ticks appear on the profile. Default is 75
Peak
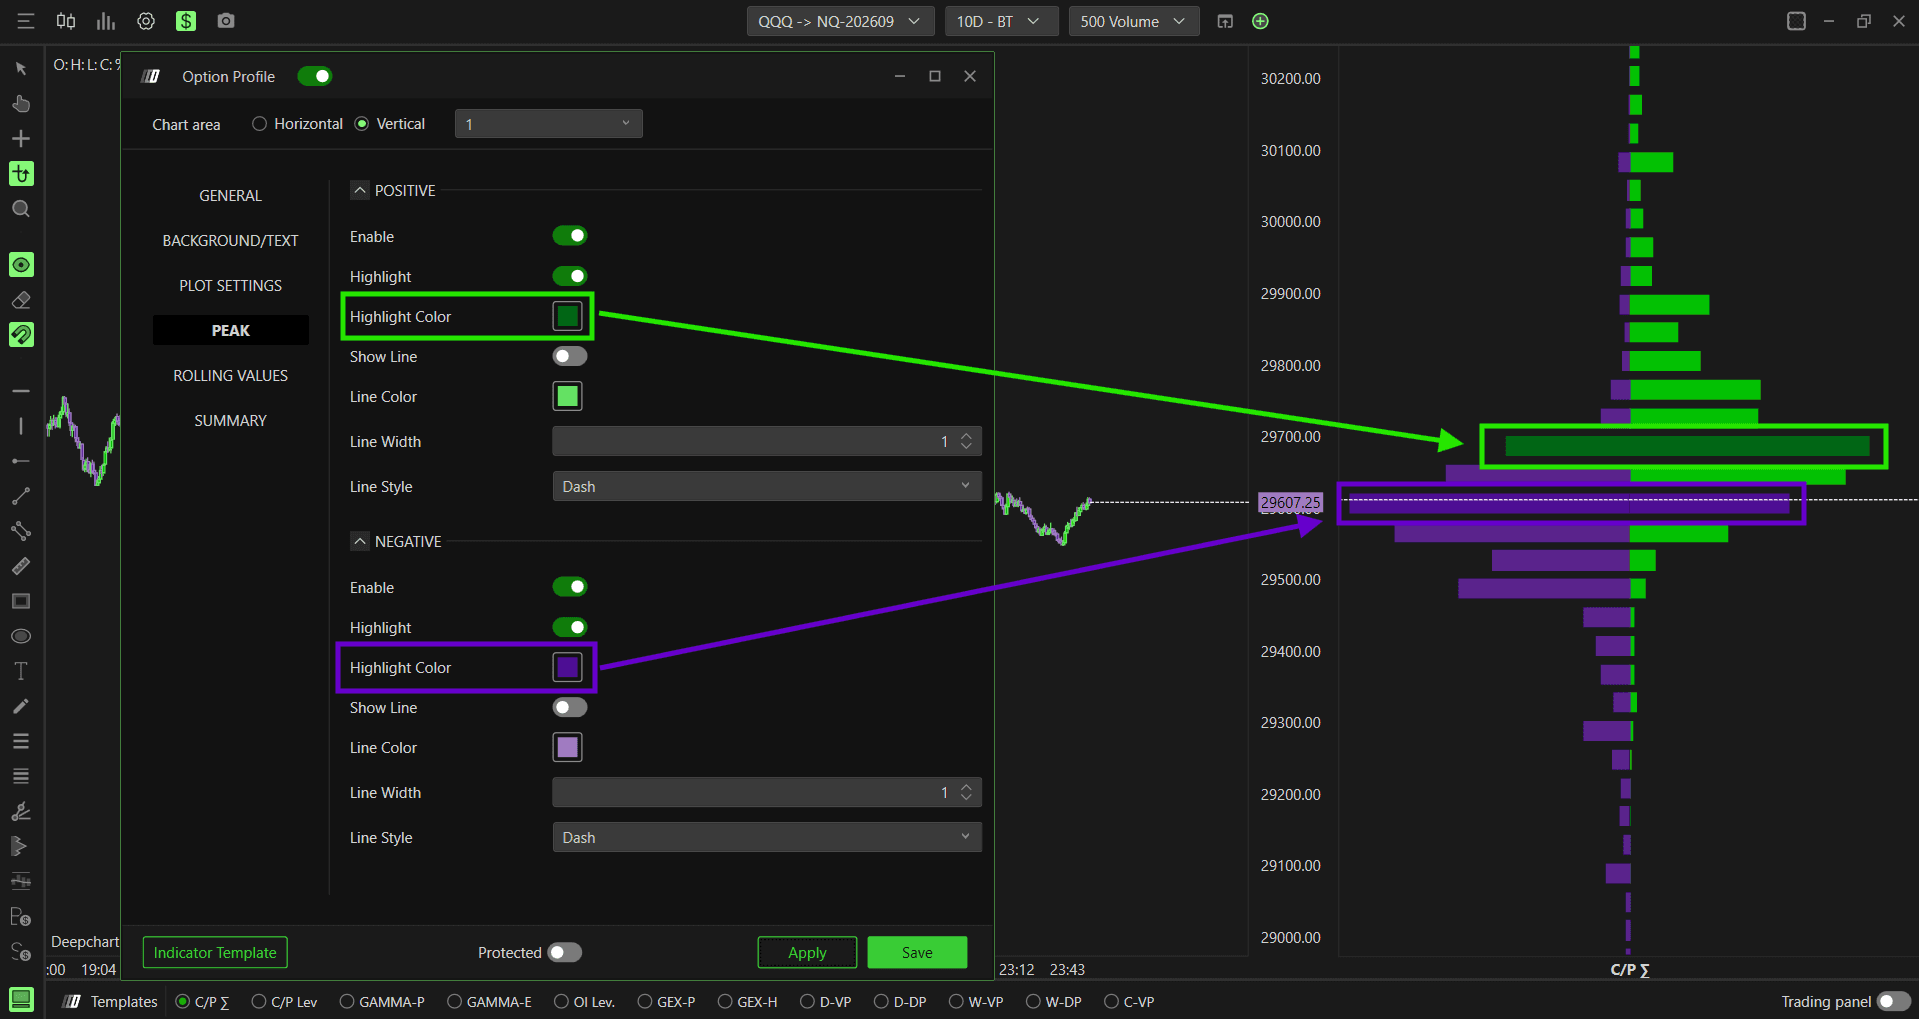
The Peak section highlights the highest concentration points on the profile for both the call and put sides.
Positive (Call Side)
Enable - Toggle to show or hide the positive peak highlight. Default is enabled
Highlight - When enabled, highlights the bar with the highest call concentration on the profile. Default is disabled
Highlight Color - Set the highlight color. Default is green
Show Line - When enabled, draws a horizontal line at the peak call level. Default is enabled
Line Color - Set the line color. Default is green
Line Width - Set the line width. Default is 1
Line Style - Choose between Solid, Dash, Dot, Dash dot, or Dash dot dot. Default is Dash
Negative (Put Side)
Enable - Toggle to show or hide the negative peak highlight. Default is enabled
Highlight - When enabled, highlights the bar with the highest put concentration on the profile. Default is disabled
Highlight Color - Set the highlight color. Default is purple
Show Line - When enabled, draws a horizontal line at the peak put level. Default is enabled
Line Color - Set the line color. Default is purple
Line Width - Set the line width. Default is 1
Line Style - Choose between Solid, Dash, Dot, Dash dot, or Dash dot dot. Default is Dash
Rolling Values
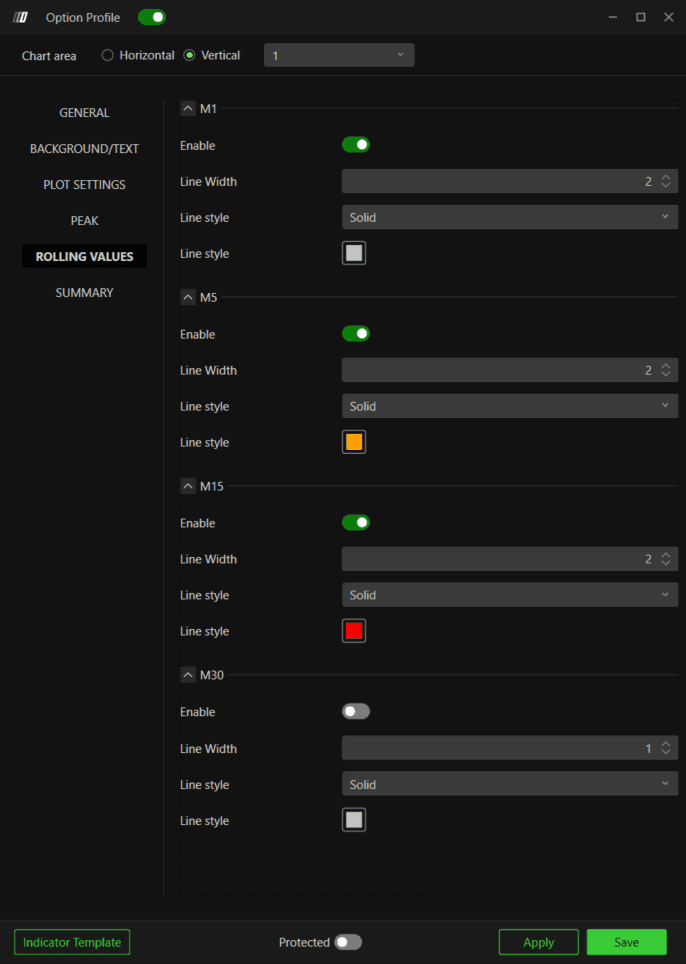
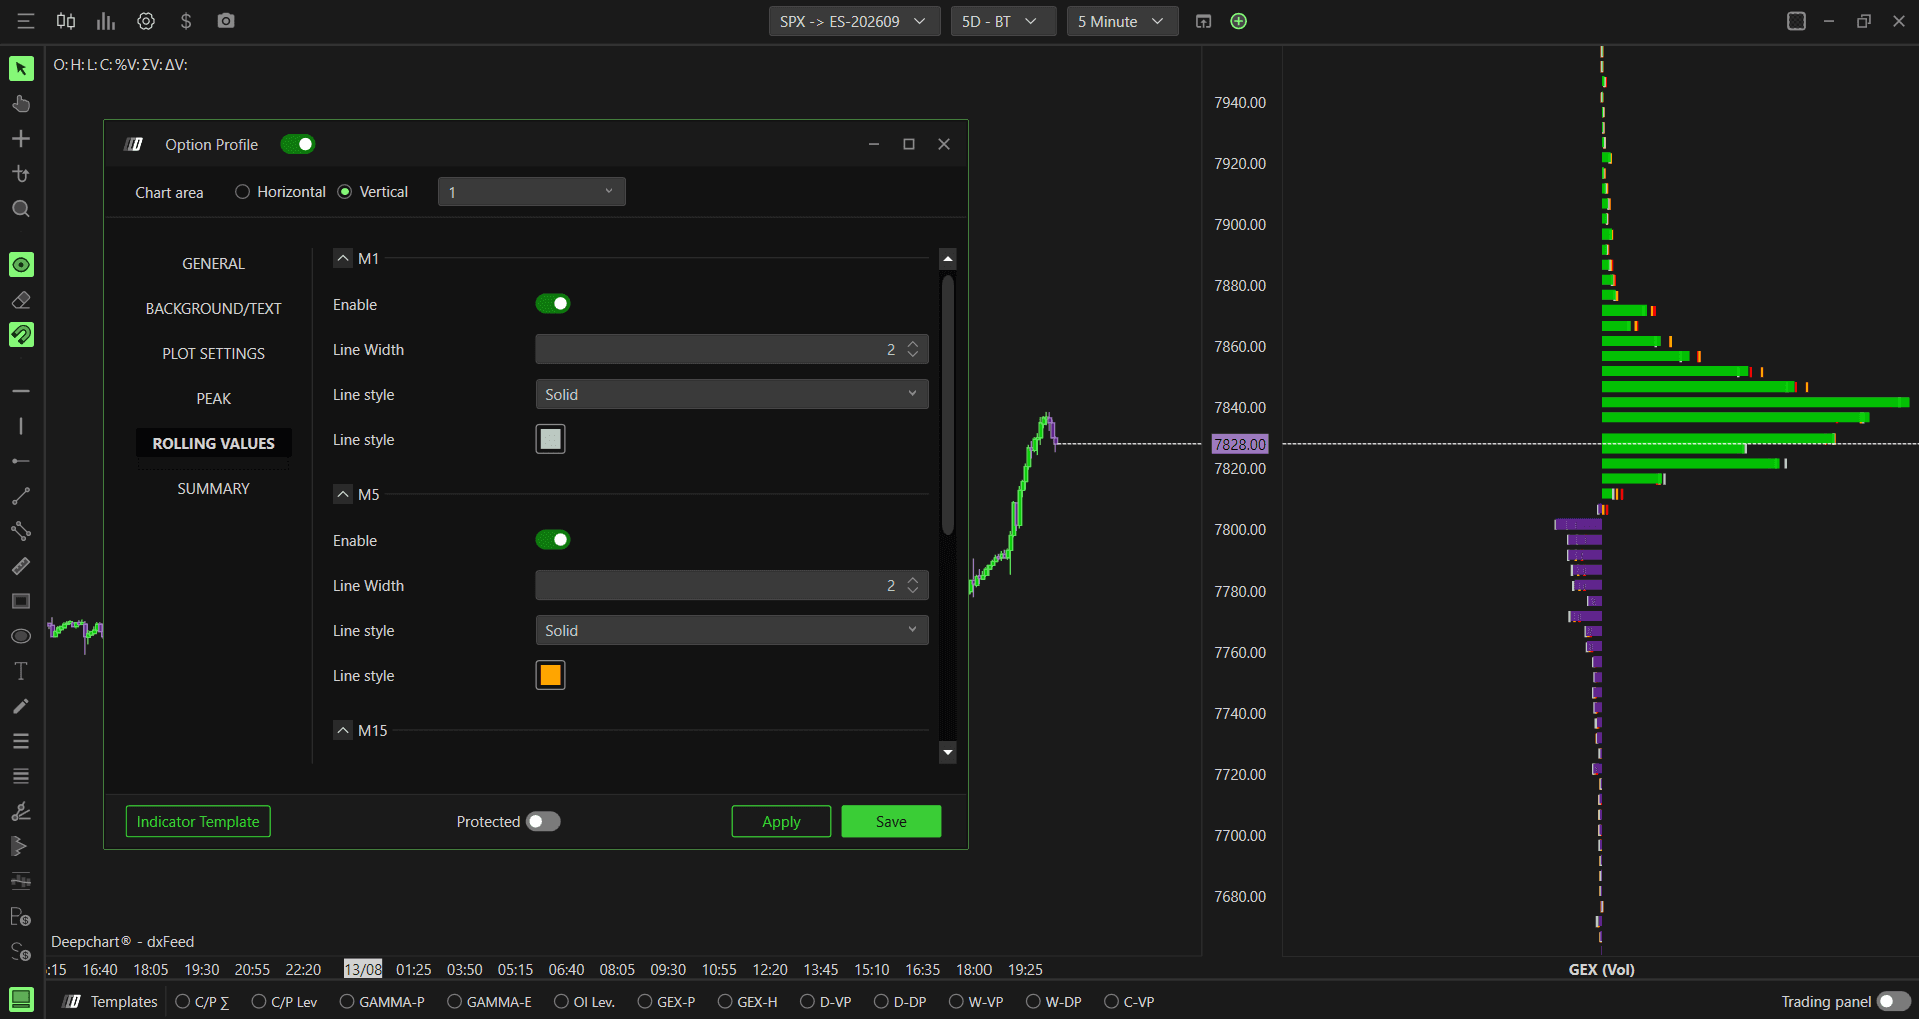
Rolling Values shows how the profile looked at specific time intervals ago, plotted as lines on the current profile. This helps you see how the options positioning has shifted over time during the session - for example, you can compare where the call and put walls were 30 minutes ago versus where they are now.
M1
Enable - Toggle to show or hide the 1 minute rolling value. Default is disabled
Line Width - Default is 1
Line Style - Choose between Solid, Dash, Dot, Dash dot, or Dash dot dot. Default is Dot
Line Style (color) - Set the color for this rolling value
M5
Enable - Toggle to show or hide the 5 minute rolling value. Default is disabled
Line Width - Default is 1
Line Style - Choose between Solid, Dash, Dot, Dash dot, or Dash dot dot. Default is Dot
Line Style (color) - Set the color for this rolling value
M15
Enable - Toggle to show or hide the 15 minute rolling value. Default is disabled
Line Width - Default is 1
Line Style - Choose between Solid, Dash, Dot, Dash dot, or Dash dot dot. Default is Dash
Line Style (color) - Set the color for this rolling value
M30
Enable - Toggle to show or hide the 30 minute rolling value. Default is disabled
Line Width - Default is 1
Line Style - Choose between Solid, Dash, Dot, Dash dot, or Dash dot dot. Default is Solid
Line Style (color) - Set the color for this rolling value
Gamma Profile View - With Rolling Values
Summary
The Summary section displays a running total of the current profile values directly on the chart, based on your selected Data source. It shows the net, call, and put totals so you can read the overall positioning at a glance without scanning the full profile.
Net - The combined call and put value for the profile, shown in green if positive
Call - The total call side value based on the selected data source, for example GEX (Vol)
Put - The total put side value based on the selected data source, shown as a negative number
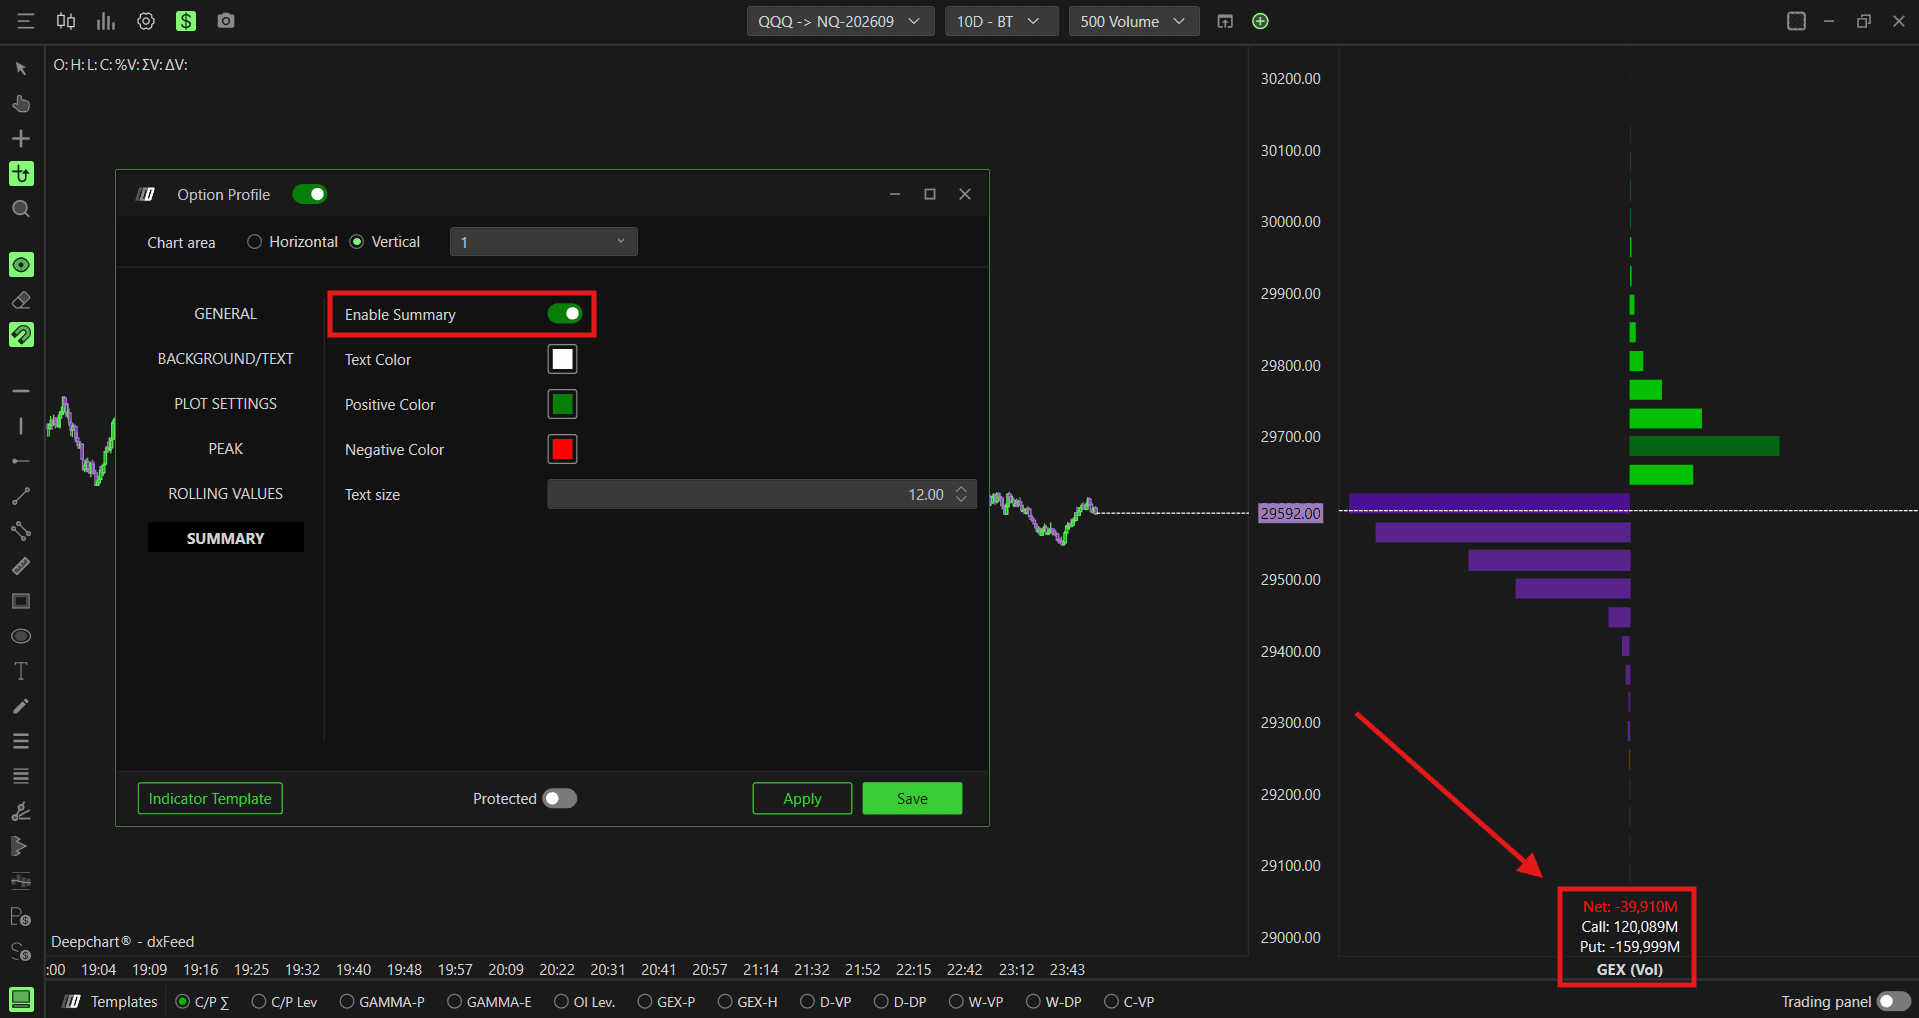
Example - How to Use Option Profile
Looking at the chart, the Option Profile appears as a vertical panel on the right side of your chart by default. Here is a simple way to read it:
The largest green bar on the profile shows the strike with the most call activity - this is your call wall. Price approaching this level from below may face selling pressure as dealers hedge their exposure
The largest purple bar on the profile shows the strike with the most put activity - this is your put wall. Price approaching this level from above may find buying support as dealers hedge their exposure
When price is trading between the call wall and put wall, it is in a balanced zone and may oscillate between the two levels
Use the Peak lines (dashed green and purple horizontal lines) as quick reference levels without having to read the full profile
Any Questions?
Our support team is available 24/7 and ready to help you with any question.
When reaching out, please include:
Screenshot (if any)
Briefly describe the assistance or support you require
DeepCharts Live Support - Chat with our agents directly using the live chat box on www.deepcharts.com, or click here for 24/7 Live Chat for immediate access.
Email Support - Reach us at support@deepcharts.com - please note that email responses may take a little longer than a live support chat.
