




One line on every positioning dashboard gets quoted more than all the others combined: the flip. Above it, the story goes, markets compress; below it, they expand. Some days it works so well it feels like cheating. Other days the line is simply in the wrong place. This episode explains what zero gamma actually is, why the border exists, how the level is computed, why serious maps disagree about where it sits, and how to use it without being used by it. Episode 9 of our Greeks series.
Two regimes, one border
You already own the physics. Episode 3 built the two seats: when dealer books are net long gamma, their hedging leans against the market — selling pushes, buying dips — and moves tend to get dampened. Net short gamma, and the same arithmetic flips sign: hedging chases, and moves tend to extend. Seatbelt weather; fuel weather.
Episode 8 then gave you the rendering that matters here: sum the whole board’s estimated dealer gamma as a function of price and you get a single curve winding up the price axis — positive through one region, negative through another. Follow that curve and somewhere it crosses zero.
That crossing is zero gamma — the gamma flip. The formal definition matters, every word of it: the price level at which the estimated aggregate dealer gamma changes sign. It’s the map’s border between the two regimes — the altitude where the seatbelt, on paper, becomes fuel.
Notice what the definition does not say. It doesn’t say “the level where the market becomes volatile.” It says where an estimate changes sign. What price actually does around a crossing is a tape-reading job, not an assumption — and by the end of this article you’ll know exactly why that distinction earns its italics.
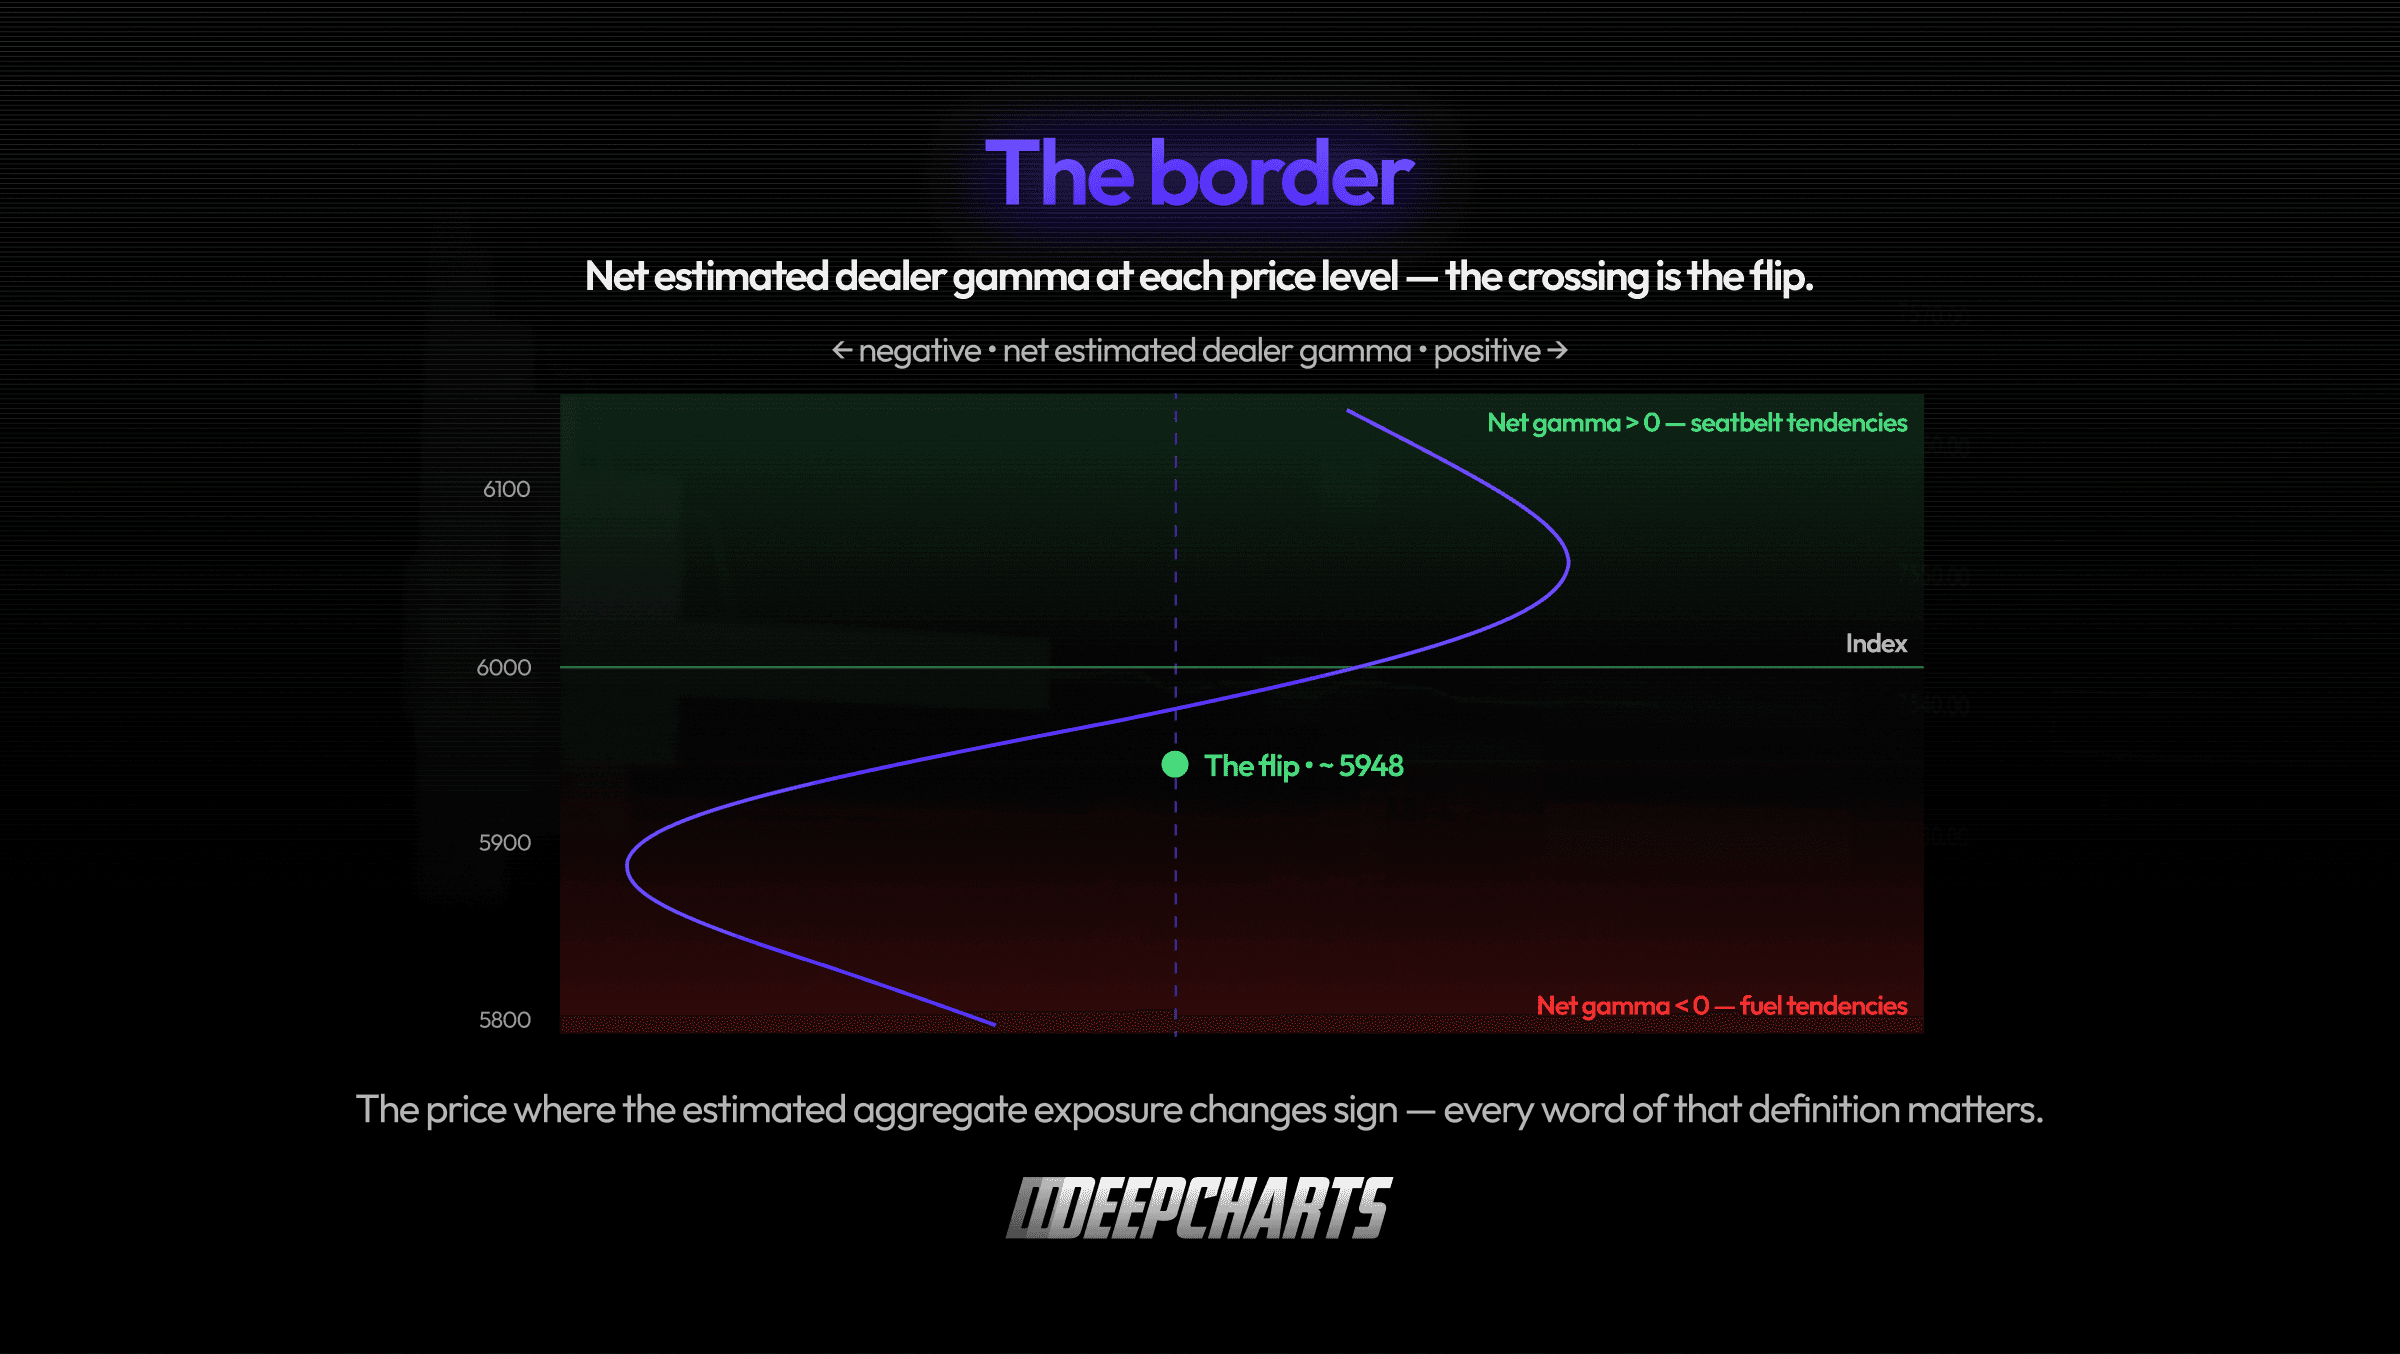
Figure 1 · The border
Why the border exists at all
The flip isn’t drawn arbitrarily — it’s where a tug-of-war balances, and knowing the two teams tells you why the line lives where it usually lives.
Dealer books are a blend of everything this series has catalogued. From above the market: the covered calls and yield-program sales that pile up at high strikes (Episode 8) leave dealers long calls — long gamma, concentrated up there. From below: the protective puts the structural buyers never stop buying (Episode 4) leave dealers short puts — short gamma, concentrated down there.
Now remember gamma’s geography: it peaks at the money (Episode 3). So which team dominates the net depends on where price stands. With the index near its highs, the call-side concentrations are close and alive — their long gamma dominates: net positive, dampened regime. Let price slide: the call gamma fades with distance while the put strikes below grow closer and hotter — their short gamma swells. At some altitude the negative contribution overtakes the positive. That balance point is the flip.
Two practical corollaries fall out immediately. First, in calm, drifting markets the flip usually sits below spot — the market lives in its dampened region most of the time, which is part of why most days feel like range days. Second, the flip is a creature of composition: it moves when positioning moves — after big expirations clear the board, when protection gets rolled down, when 0DTE flow floods a strike — not on any schedule of its own.

Figure 2 · The tug-of-war
What crossing it is supposed to mean — said honestly
The behavioral claim, in its honest clothes: above the flip, hedging tendencies lean stabilizing; below it, destabilizing. A market that breaks down through its flip hasn’t just crossed a line — on the map’s estimate, it has moved from the region where dealer flow absorbs its moves to the region where dealer flow feeds them. Ranges should widen. Follow-through should improve. The character of pullbacks should change.
Three honesty notes before you tattoo that anywhere.
Tendency, not switch. Nothing snaps at the line. The curve passes through zero gradually — just above it, the stabilizing flow is already weak; just below, the amplifying flow is still mild. The regimes are the curve’s ends, not its every point.
Crossings rarely travel alone. Think about what’s usually happening when price falls through the flip: the market is selling off, which means implied vol is usually spiking — which means vanna is deepening every put delta and forcing dealer selling at the same time (Episode 7), while the fear itself widens spreads and thins books. The violence you see below the flip is never gamma’s signature alone; it’s a chord, not a note. Attribution is genuinely hard, and anyone who tells you “that candle was the flip” is guessing with confidence.
And the claim inherits the map. Which brings us to the part of this episode that matters most.

Figure 3 · The chord, not the note
How the level is actually computed
No exchange publishes zero gamma. Every flip you’ve ever seen was manufactured, and the recipe is worth knowing by heart — it’s one loop:
Sweep. Pick a hypothetical price for the index — say 5,950.
Re-price. Using a model and a volatility surface, compute every listed option’s gamma as if the index were there.
Sign. Multiply each by the dealer’s assumed or estimated inventory — long this, short that.
Sum. Add up the board. That’s one point of the net curve.
Move the hypothetical price, repeat, and the curve emerges; wherever it crosses zero, print “the flip.”
Now audit that loop with Episode 8’s chain. The open interest driving it: observed. The holder’s side, which determines every sign in the sum: assumed (or estimated, if you’re doing it properly). The gammas: modeled, off a surface that is itself fitted. The output: a zero of an estimated function — and that phrase should ring an alarm for anyone who remembers any numerical math: zeros are where functions are most fragile. Near the crossing, the curve is by construction small — so small errors in the inputs translate into large movements of the crossing itself.
This is why the single most important sentence in this episode is one our readers have seen before, about the naive convention: get the dealer’s side wrong and the flip doesn’t move a little — it moves to a different part of the chart.

Figure 4 · The manufacturing loop
Why serious maps disagree
Take everything above and you can now explain, precisely, a phenomenon that confuses everyone on positioning Twitter: two reputable services quoting flips roughly 40 points apart, on the same morning, in the same market. Neither is broken. They’re computing zeros of different estimated functions:
Expirations. One includes all of them; the other weights the front month.
0DTE. One counts it — its gamma is enormous and dies daily, so the flip can migrate intraday as that flow builds; the other deliberately excludes it.
Netting. One nets calls against puts per strike; the other doesn’t.
The holder question. Above all, they resolve the dealer’s side differently — pure convention on one side, flow-based estimation on the other.
Small divergences anywhere in the chain, amplified at the zero, land the line in visibly different places.
The practical conclusions write themselves:
Treat the flip as a zone, not a line. If the curve near zero is flat, the honest rendering of the crossing is a band, sometimes a wide one — and inside that band, whipsaw is the expected texture, not a betrayal.
Know the recipe behind any flip you use — same rule as Episode 8, doubled, because the flip is the most input-sensitive object on the whole map.
Read precision as a warning. A flip quoted to the decimal, with no recipe attached, is precision theater. The real thing comes with error bars — stated or not.

Figure 5 · Three maps, three flips
Using it without being used by it
So what does a futures trader actually do with an estimated border between regimes? Three disciplined uses, one session walkthrough.
Use it as regime context, not as a level to trade. Above the flip, Episode 8’s asymmetries apply: breakouts into heavy strikes deserve skepticism, fades have structural help. Below it, invert the respect: follow-through is the base case to disprove, and catching knives is fighting the current. The flip doesn’t tell you what to do; it tells you which tendencies get the benefit of the doubt today.
Audit crossings; don’t predict them. The map says the market’s character should change below the line. Character is checkable: after a cross, do dips keep finding buyers, or do they run? Do ranges hold, or expand? Does the tape absorb, or vacate? If the character changes where the map said it should, weight the map higher for the rest of the session. If price crosses and nothing changes, you’ve learned something better than any level: today’s map is mislocated — or the flow that matters today isn’t dealer hedging. Both are tradeable knowledge.
Assemble the full map. Flip plus walls, together, complete the geography this series has been building: a corridor with edges where hedging thickens (Episode 8) and an internal border where its direction is estimated to reverse. A morning glance at that combined picture — three prices and a band — pre-structures the entire session’s attention for the cost of thirty seconds.

Figure 6 · The full map
The walkthrough, honestly narrated: the index opens mid-corridor, above the flip band. Morning behavior audits clean — pushes sold, dips bought, the dampening hypothesis earning weight. Early afternoon, a data shock: price drops through the band. You don’t short the cross — you watch it: the first pullback after the cross stalls lower than any morning dip and rolls over; the range doubles within the hour; vol is bid. Character confirmed, tendencies re-weighted — from here, respect for downside follow-through until the tape says otherwise. No prophecy anywhere in that sequence: just a hypothesis, an address, and an audit. That’s the whole discipline this series has been teaching, applied to its most famous line.
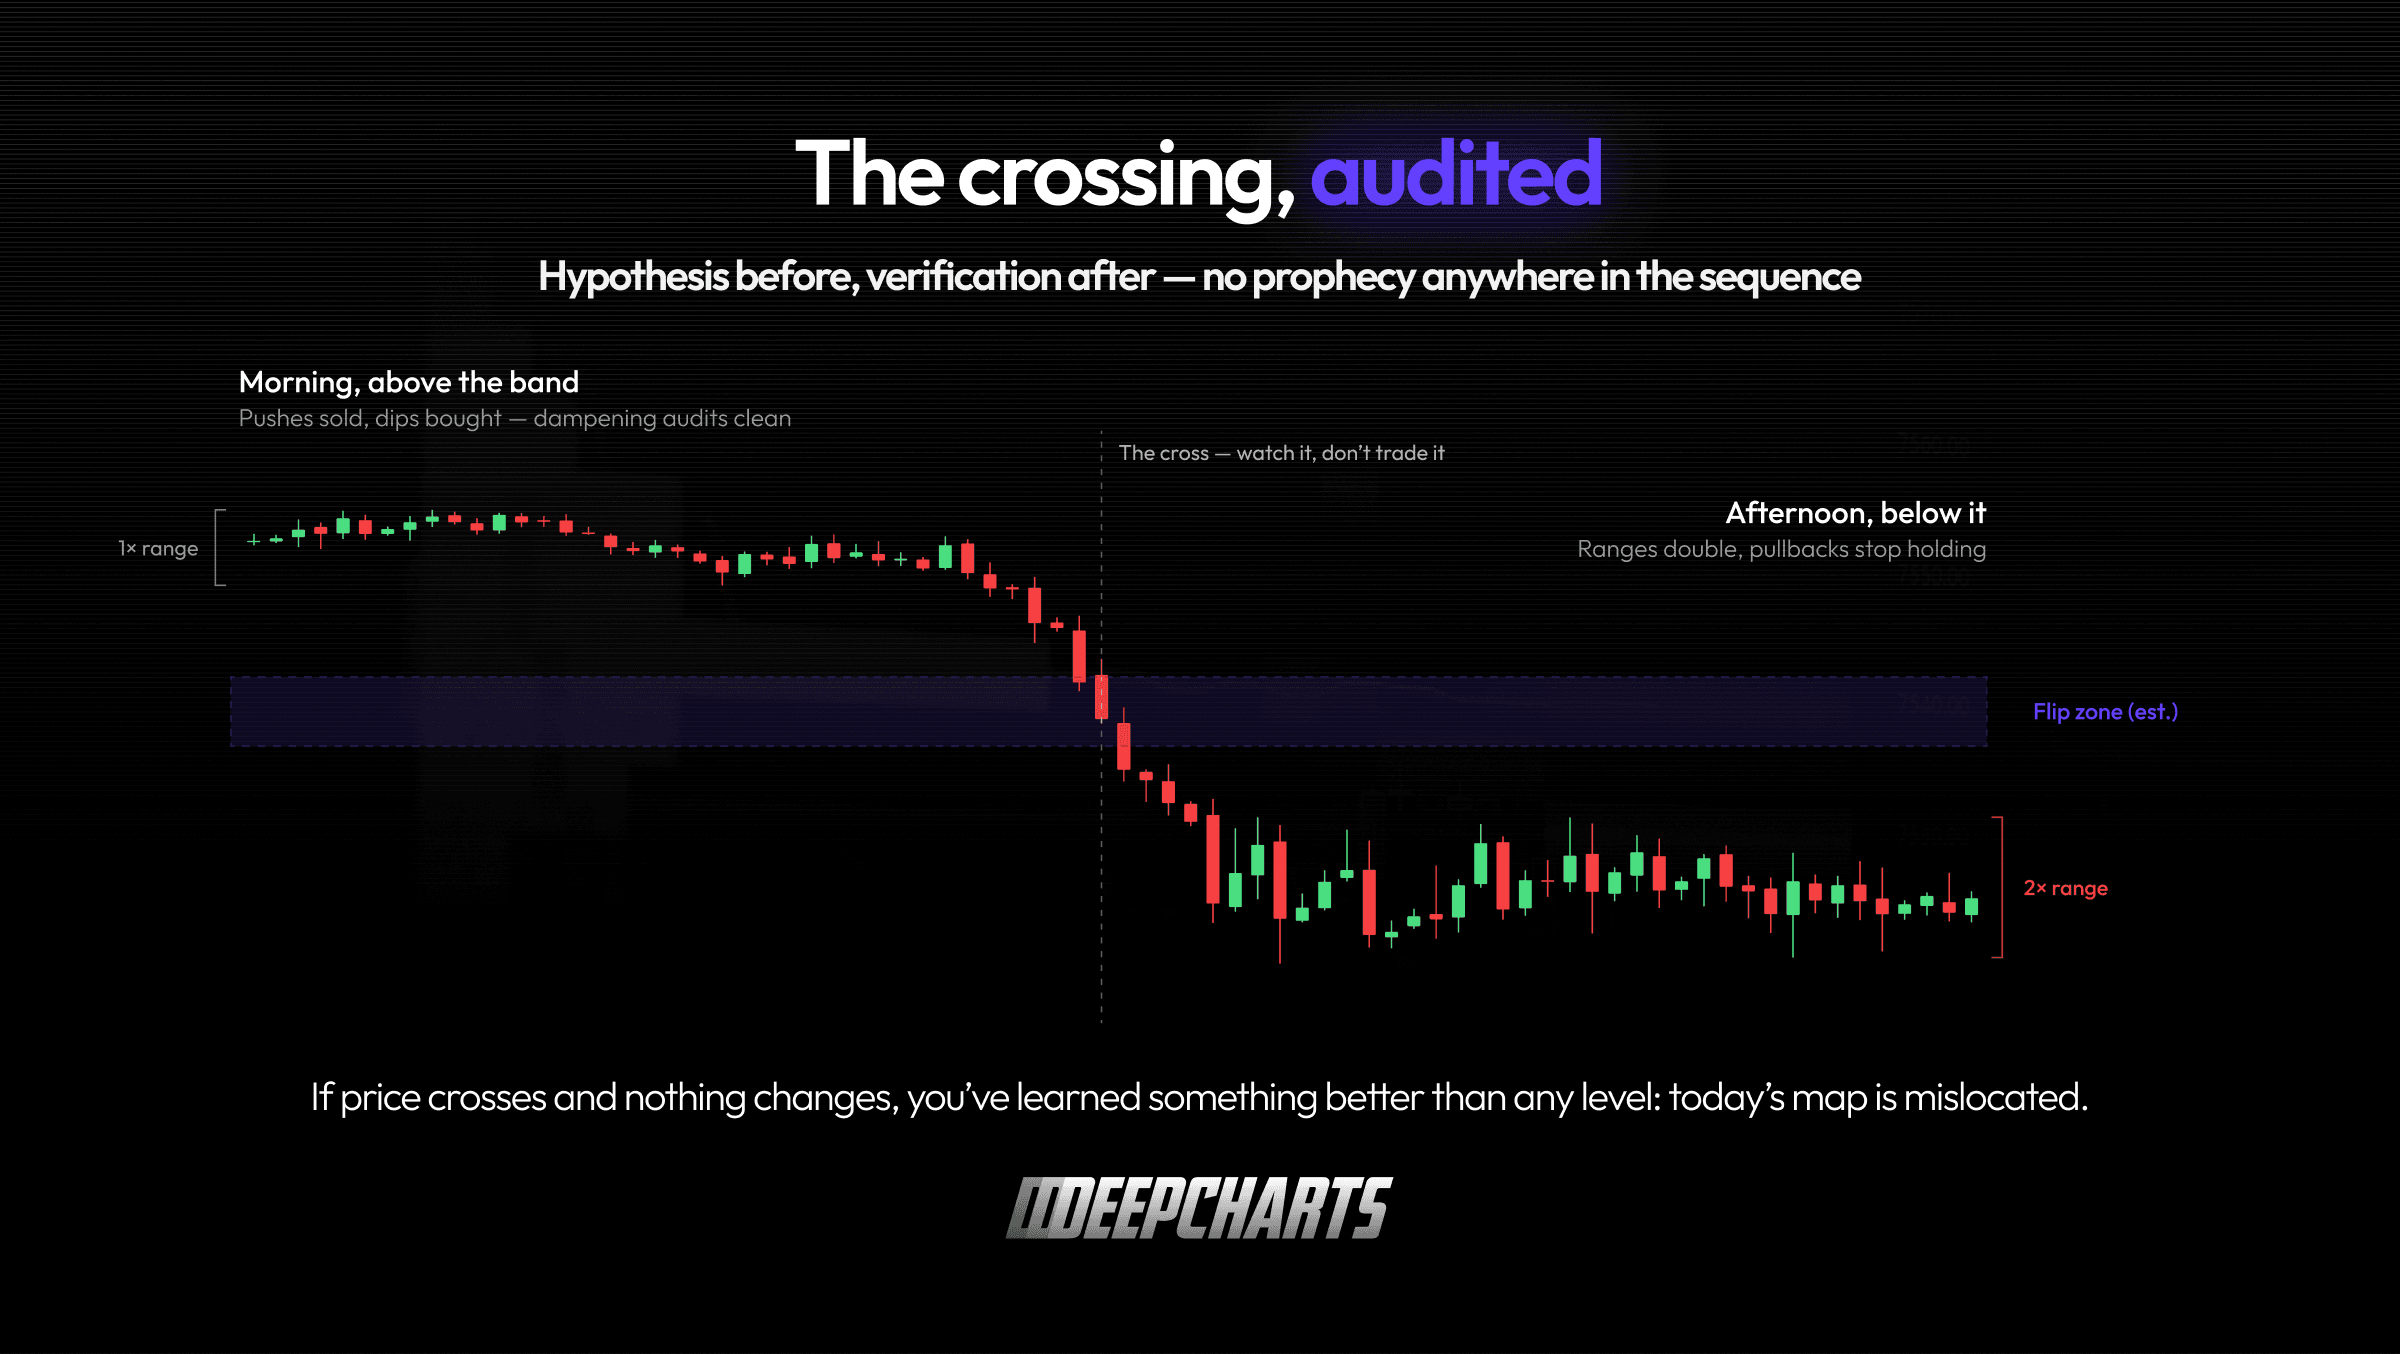
Figure 7 · The crossing, audited
FAQ
What is zero gamma (the gamma flip) in simple terms?
The price level at which the estimated aggregate dealer gamma changes sign — the map’s border between the regime where hedging tends to dampen moves (above) and the one where it tends to amplify them (below).
Is the market always volatile below zero gamma?
No. Below the flip, amplifying tendencies get stronger the deeper you go — but it’s a gradient, not a switch, and sell-offs below the flip mix gamma with vanna flows, vol spikes and thin books. Treat it as a change in which tendencies to respect, not a volatility guarantee.
Why do different services show different zero gamma levels?
Because the flip is the zero of an estimated function, and estimates differ: which expirations are included, whether 0DTE counts, netting choices, units, and above all how the dealer’s side is resolved. Small input differences move a zero a lot — a 40-point disagreement can be two defensible recipes.
How is zero gamma calculated?
By a model sweep: for each hypothetical index price, re-price every option’s gamma, apply the assumed or estimated dealer inventory signs, and sum the board. The price where that net curve crosses zero is the flip.
Is zero gamma a support or resistance level?
Neither. It’s not a level where orders live — it’s an estimated border between hedging regimes. Price doesn’t bounce off it; the market’s character is hypothesized to change across it, which is a claim you verify on the tape.
How often does the flip move?
Whenever positioning moves: daily with open interest, sharply after big expirations, and even intraday as 0DTE flow builds and dies. A flip computed at the open can be stale by lunch.
The finale is next: dynamic delta hedging — the discipline that has been hiding inside every episode of this series, finally shown start to finish, the way a desk actually runs it.
Deepcharts Team
·
Share this on
