Updated:
Option Expected Move plots a dynamic price range band directly on your chart, showing the expected price movement for the session based on the implied volatility of options. The band gives you a statistically derived estimate of how far price is likely to move from its current level by the end of the session.
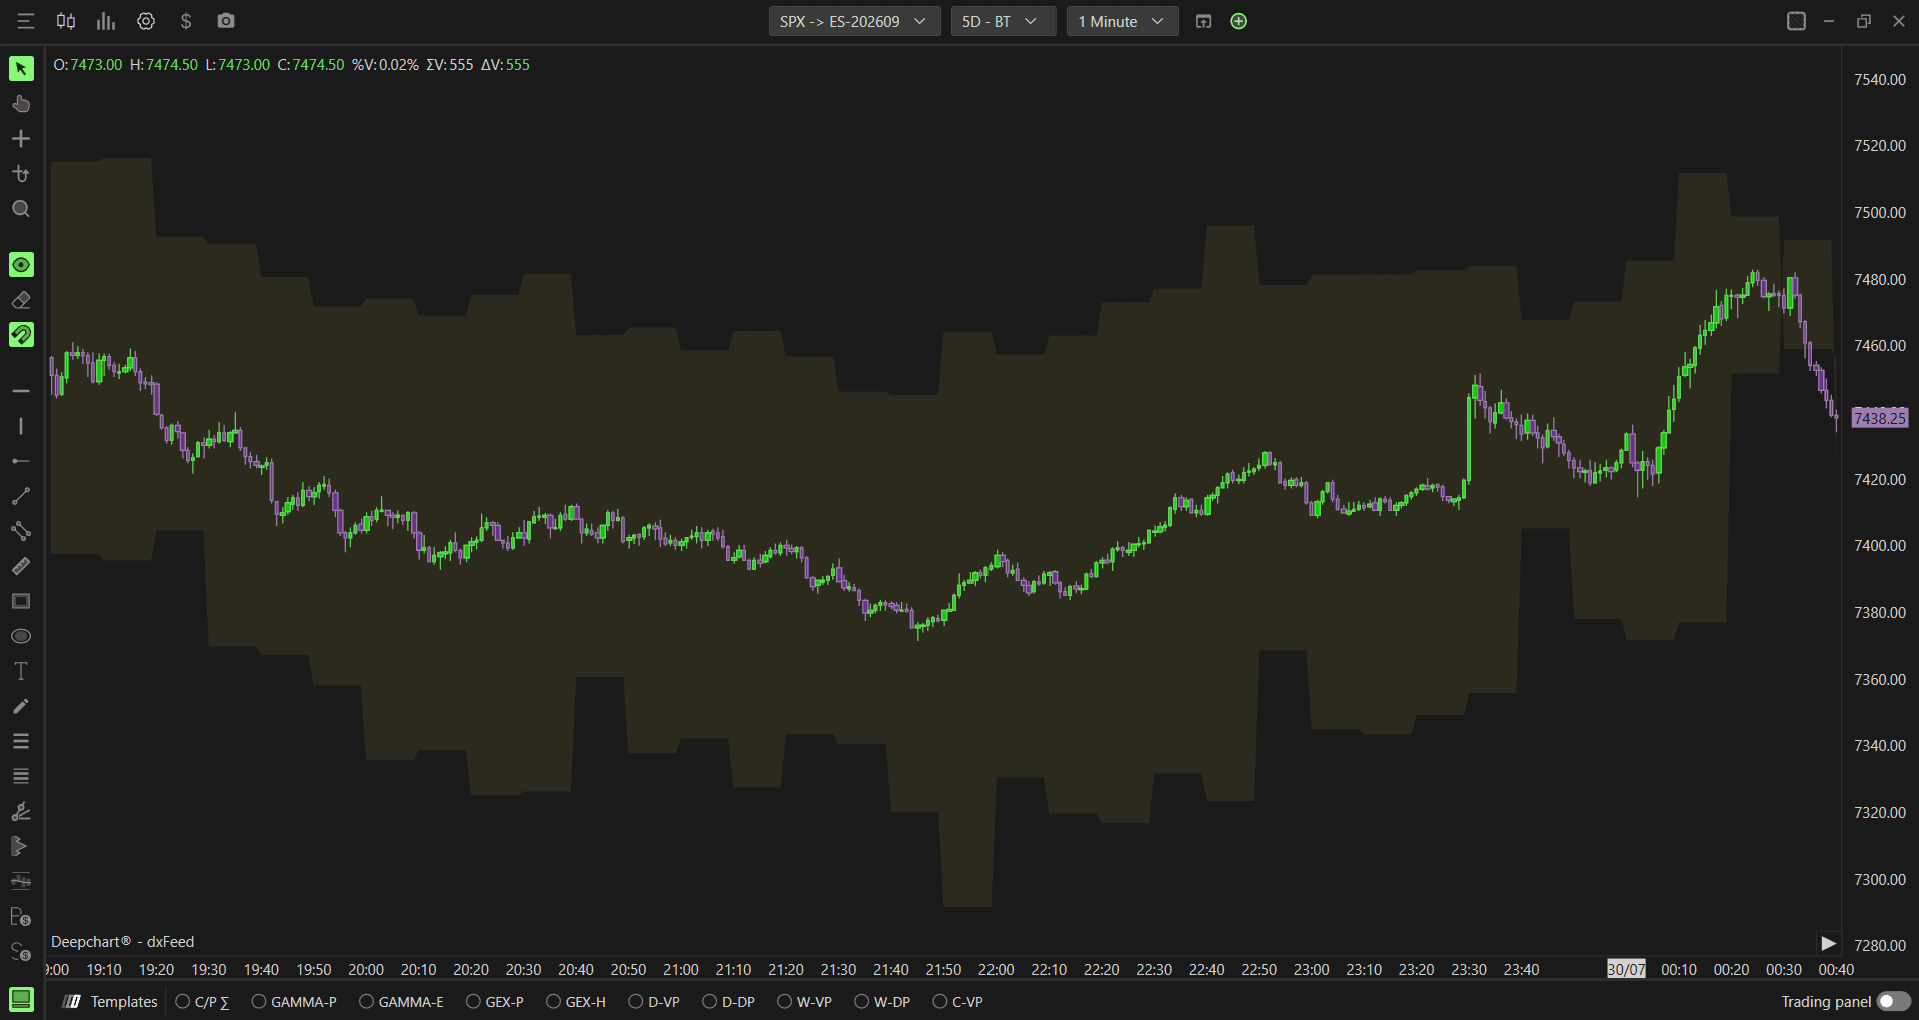
Note: Option Expected Move is available on NDX, QQQ, SPY, and SPX.

How to Add Option Expected Move
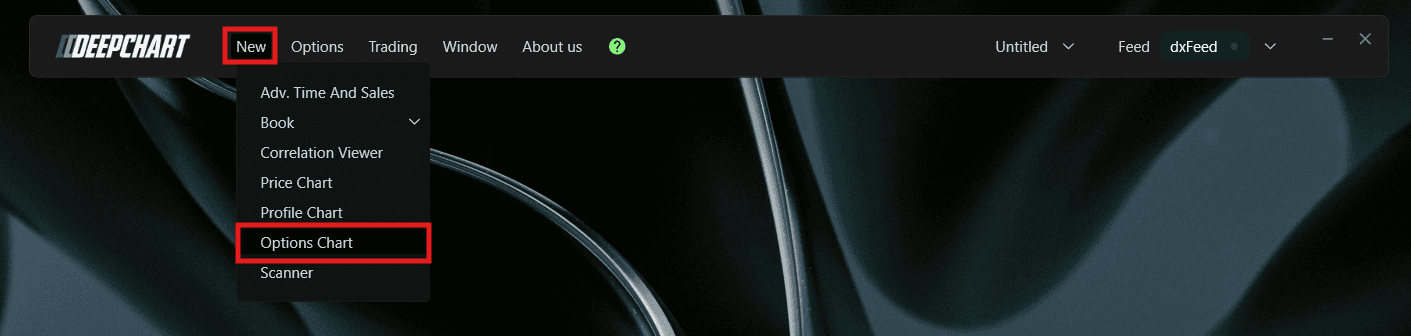
Go to New in the top menu
Click on Option Chart
A Select Instrument dialog will appear with the following options:
NDX - Symbol: NQ-CME, Exchange: CME
QQQ - Symbol: NQ-CME, Exchange: CME
SPX - Symbol: ES-CME, Exchange: CME
SPY - Symbol: ES-CME, Exchange: CME
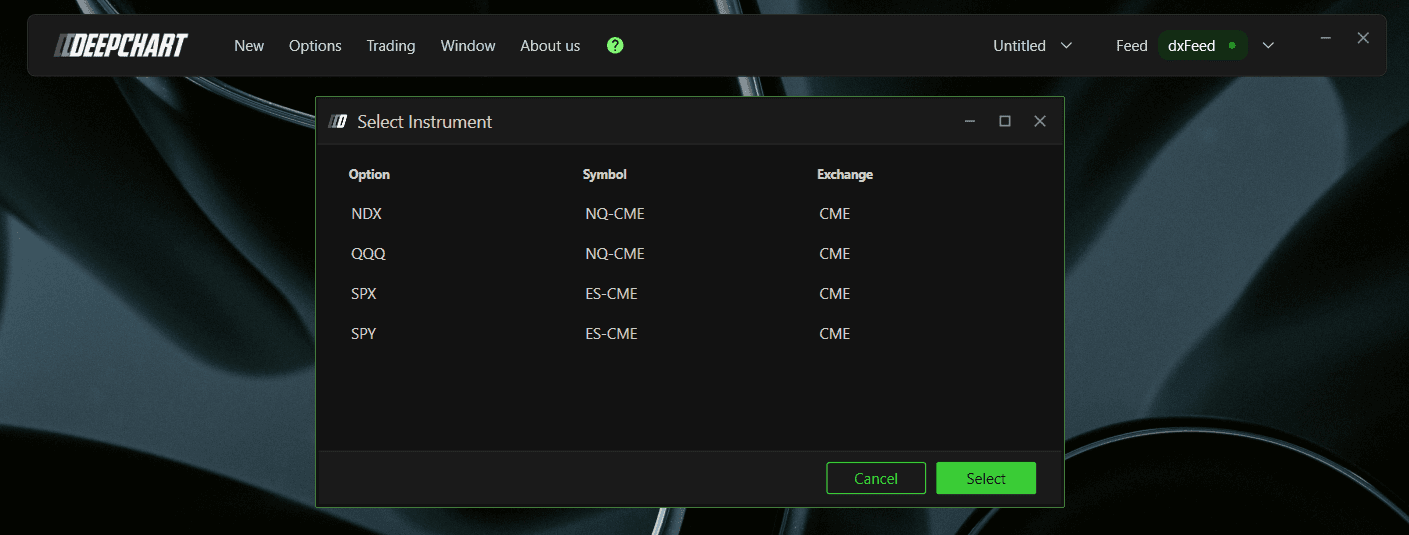
Select your preferred instrument and click to open the chart
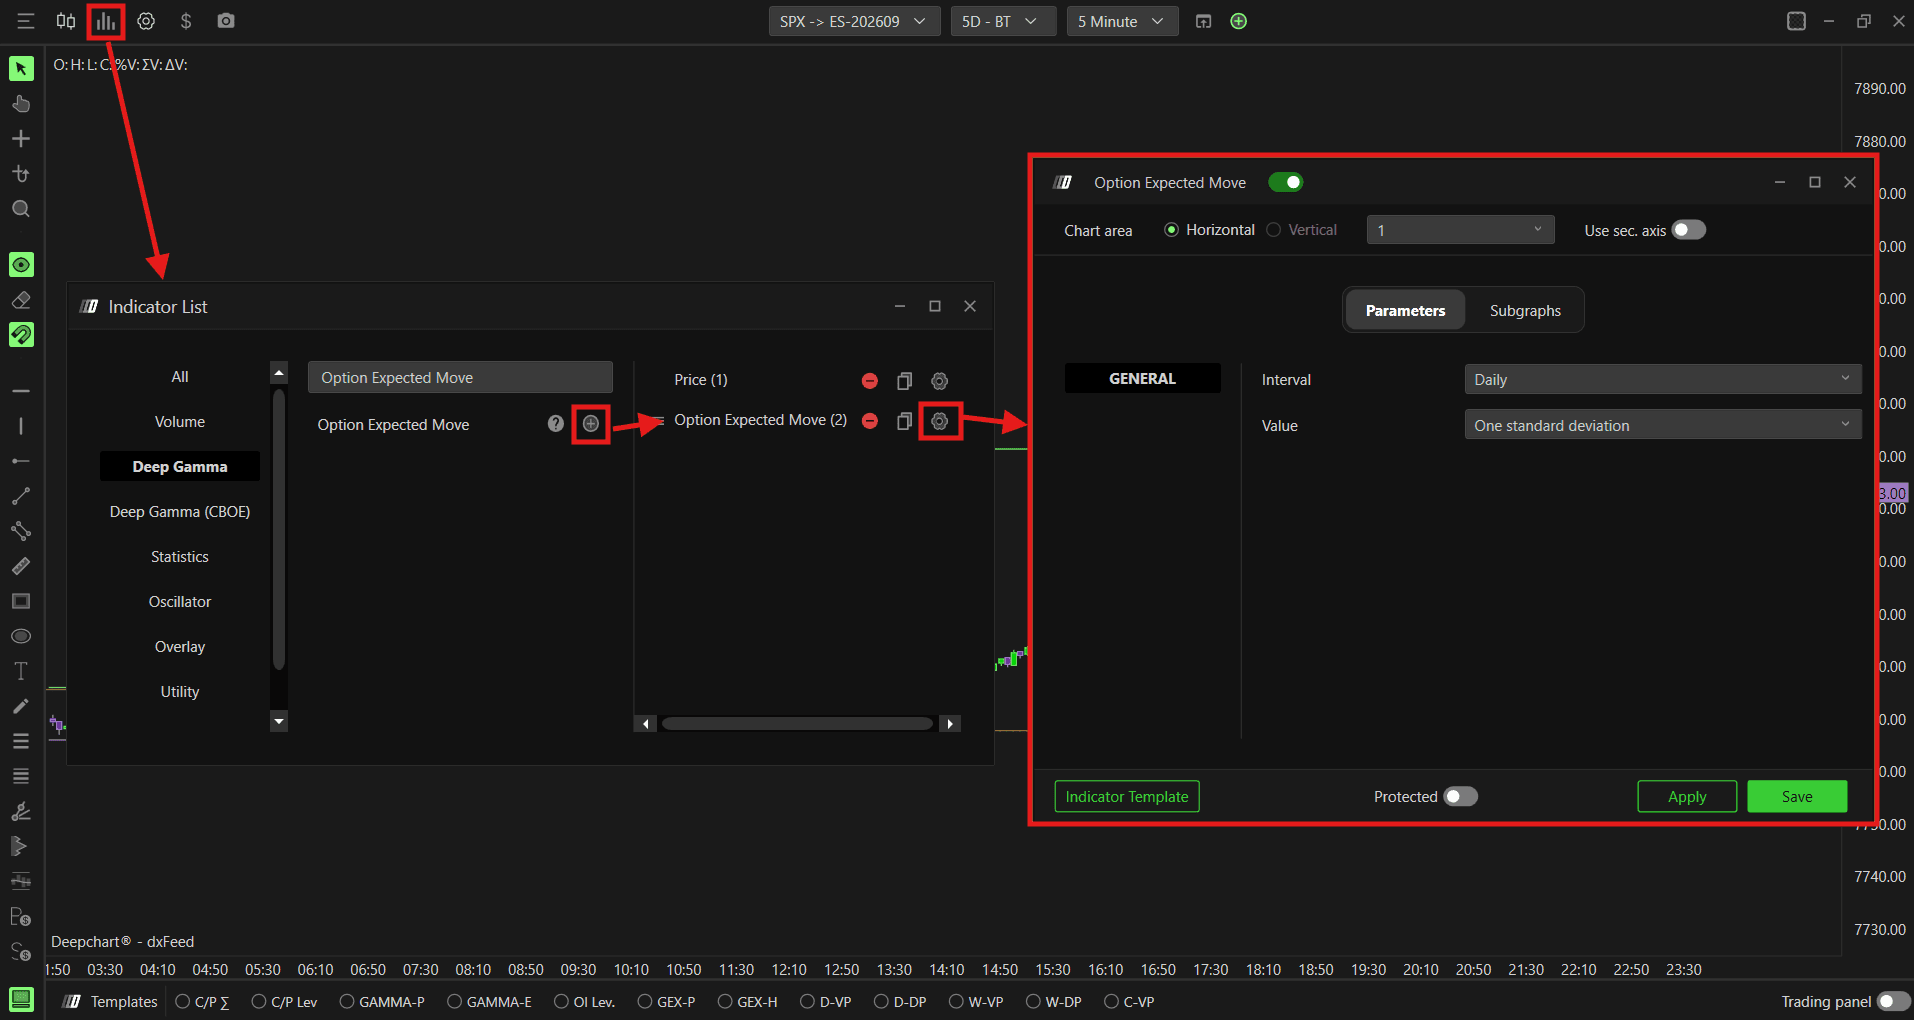
Once the Option Chart is loaded, click the Indicator Add button on the chart toolbar
Search for Option Expected Move and click + to add it
Click the settings icon to open the configuration window
Understanding the Band
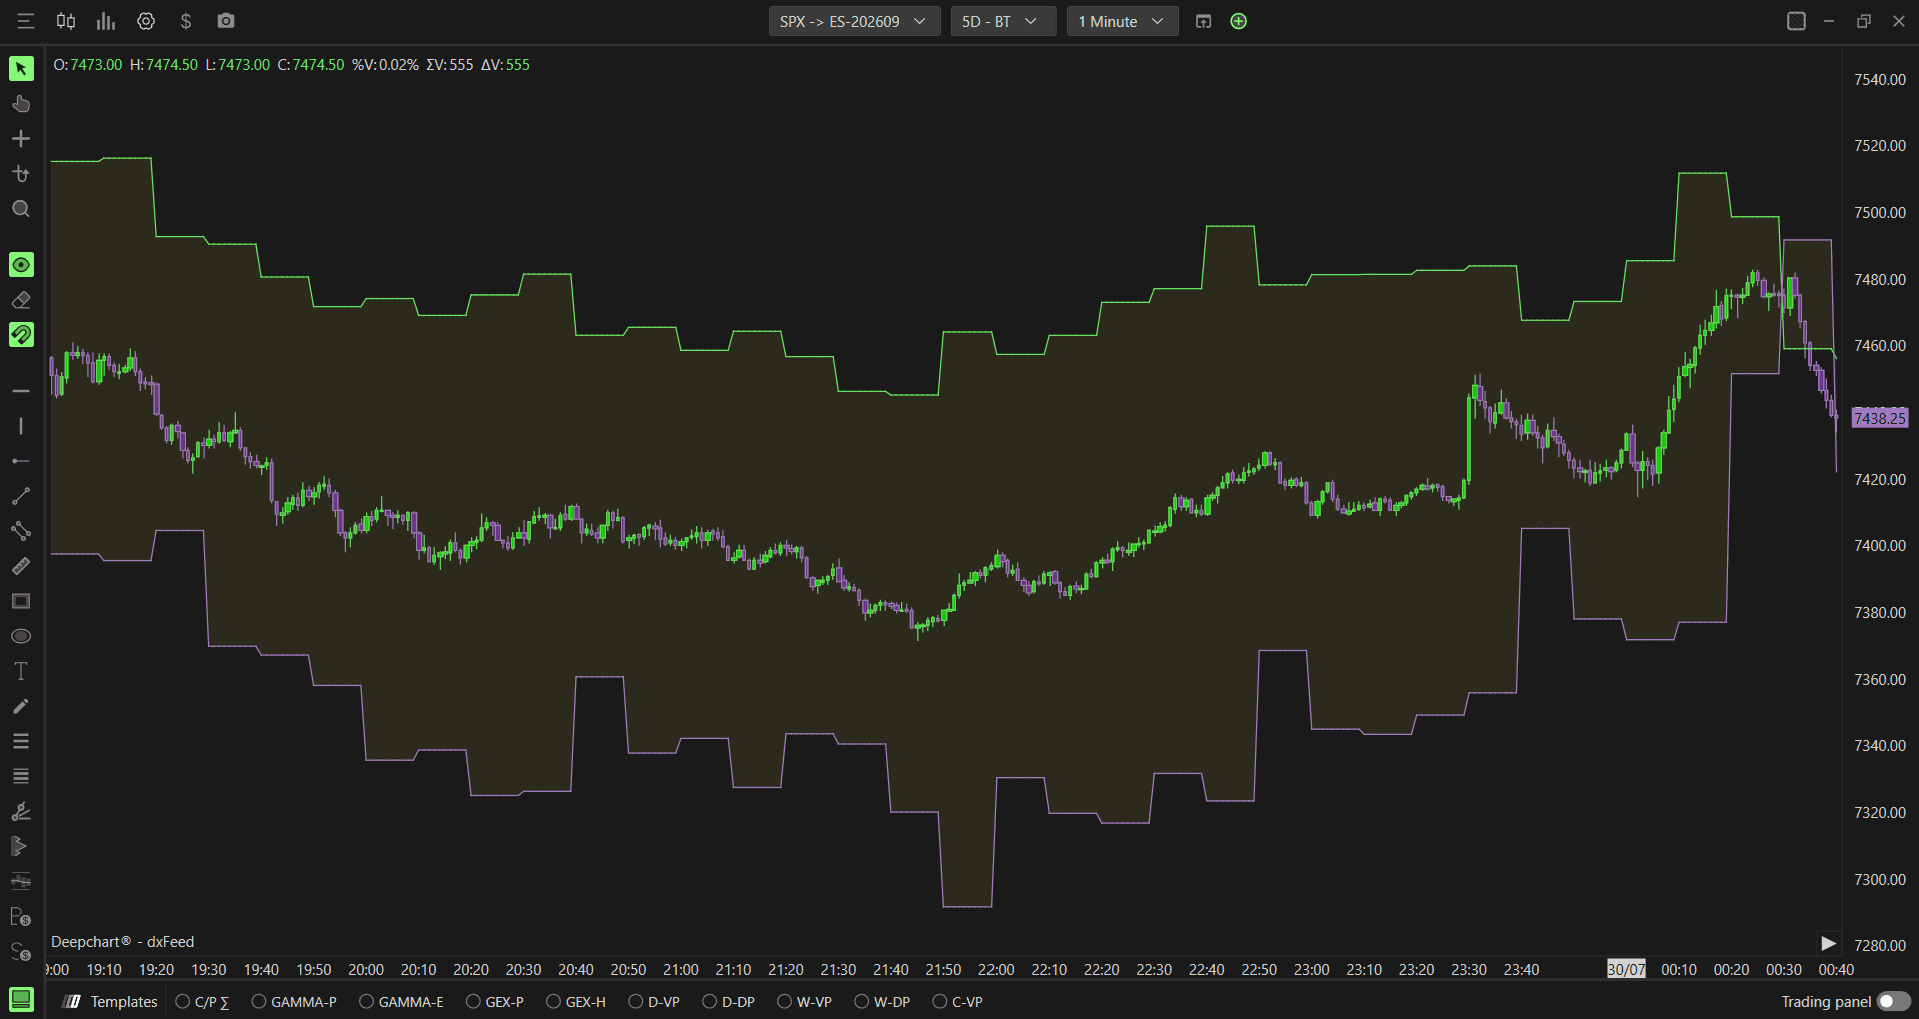
The Option Expected Move displays a shaded band on your chart with three components:
Range (1) - the main shaded band showing the full expected price range for the session. Price is statistically expected to close within this band
Range + (2) - the upper boundary of the expected move. This is the upper price target the market is pricing in for the session
Range - (3) - the lower boundary of the expected move. This is the lower price target the market is pricing in for the session
Understanding Key Terms
Before choosing a value, it helps to understand a few core options concepts:
Implied Volatility - The market’s expectation of how much the underlying price will move, derived from options pricing. Higher implied volatility means the market expects larger price swings
Standard Deviation - A statistical measure of how spread out price movements are expected to be. One standard deviation covers roughly 70% of expected outcomes, while two standard deviations covers roughly 95%, giving a wider but less likely range
Settings
Parameters
General
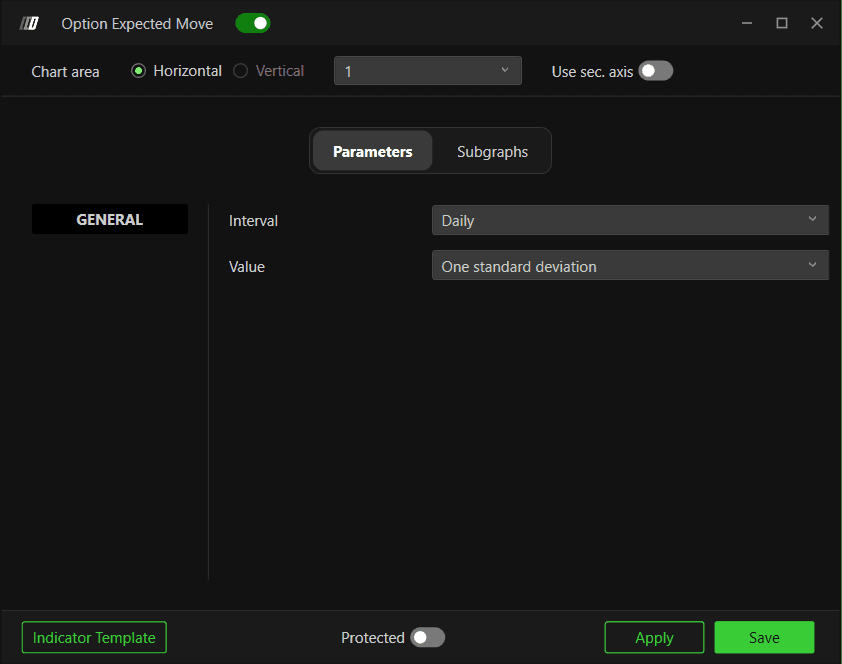
Interval - Choose the timeframe for which the expected move is calculated. Options available:
Daily (default) - calculates the expected move for the full trading session.
Use this when: you want a target range for the full sessionThirty minute - calculates the expected move for a rolling 30 minute window.
Use this when: you want a shorter term intraday target rather than a full session range
Value - Choose the statistical measure used to calculate the expected move. Options available:
Average - uses the average implied volatility to calculate the expected range.
Use this when: you want a simpler, single estimate of the expected range without a specific probability attachedOne standard deviation (default) - the range within which price has approximately a 70% probability of closing by the end of the session.
Use this when: you want the most commonly used and statistically grounded range for typical session movesTwo standard deviation - a wider range within which price has approximately a 95% probability of closing by the end of the session.
Use this when: you want a broader view of extreme potential moves, useful for identifying outlier scenarios
Subgraphs
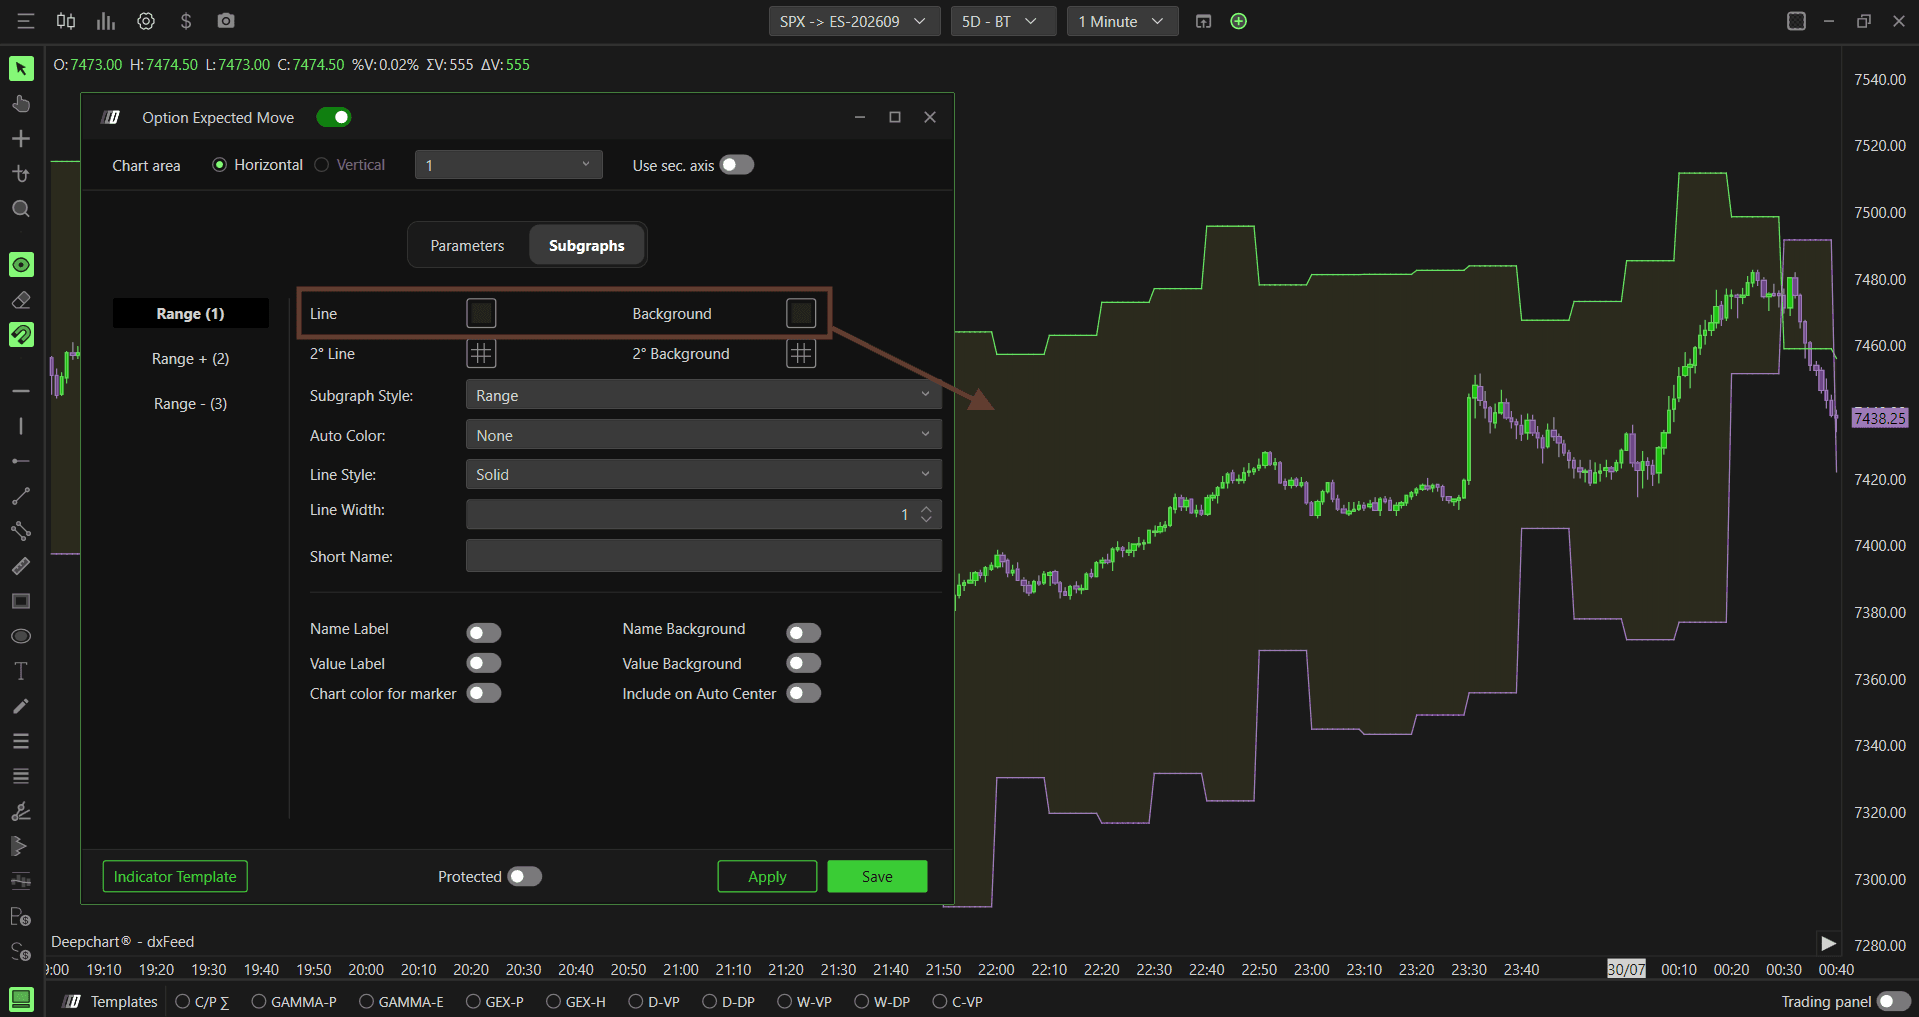
Range (1)
Line - Set the color of the range band border line
Background - Set the color of the shaded band background
2° Line - Set a secondary line color
2° Background - Set a secondary background color
Subgraph Style - Choose between Hidden or Range. Default is Range
Auto Color - Options: None, Slope, +/-. Default is None
Line Style - Choose between Solid or Dash. Default is Solid
Line Width - Default is 1
Short Name - Set a custom label for this series
Name Label - Toggle visibility of the name label
Value Label - Toggle visibility of the value label
Name Background - Toggle the name label background
Value Background - Toggle the value label background
Chart color for marker - Enable to use chart color for markers
Include on Auto Center - Enable to include this series in auto centering. Default is disabled
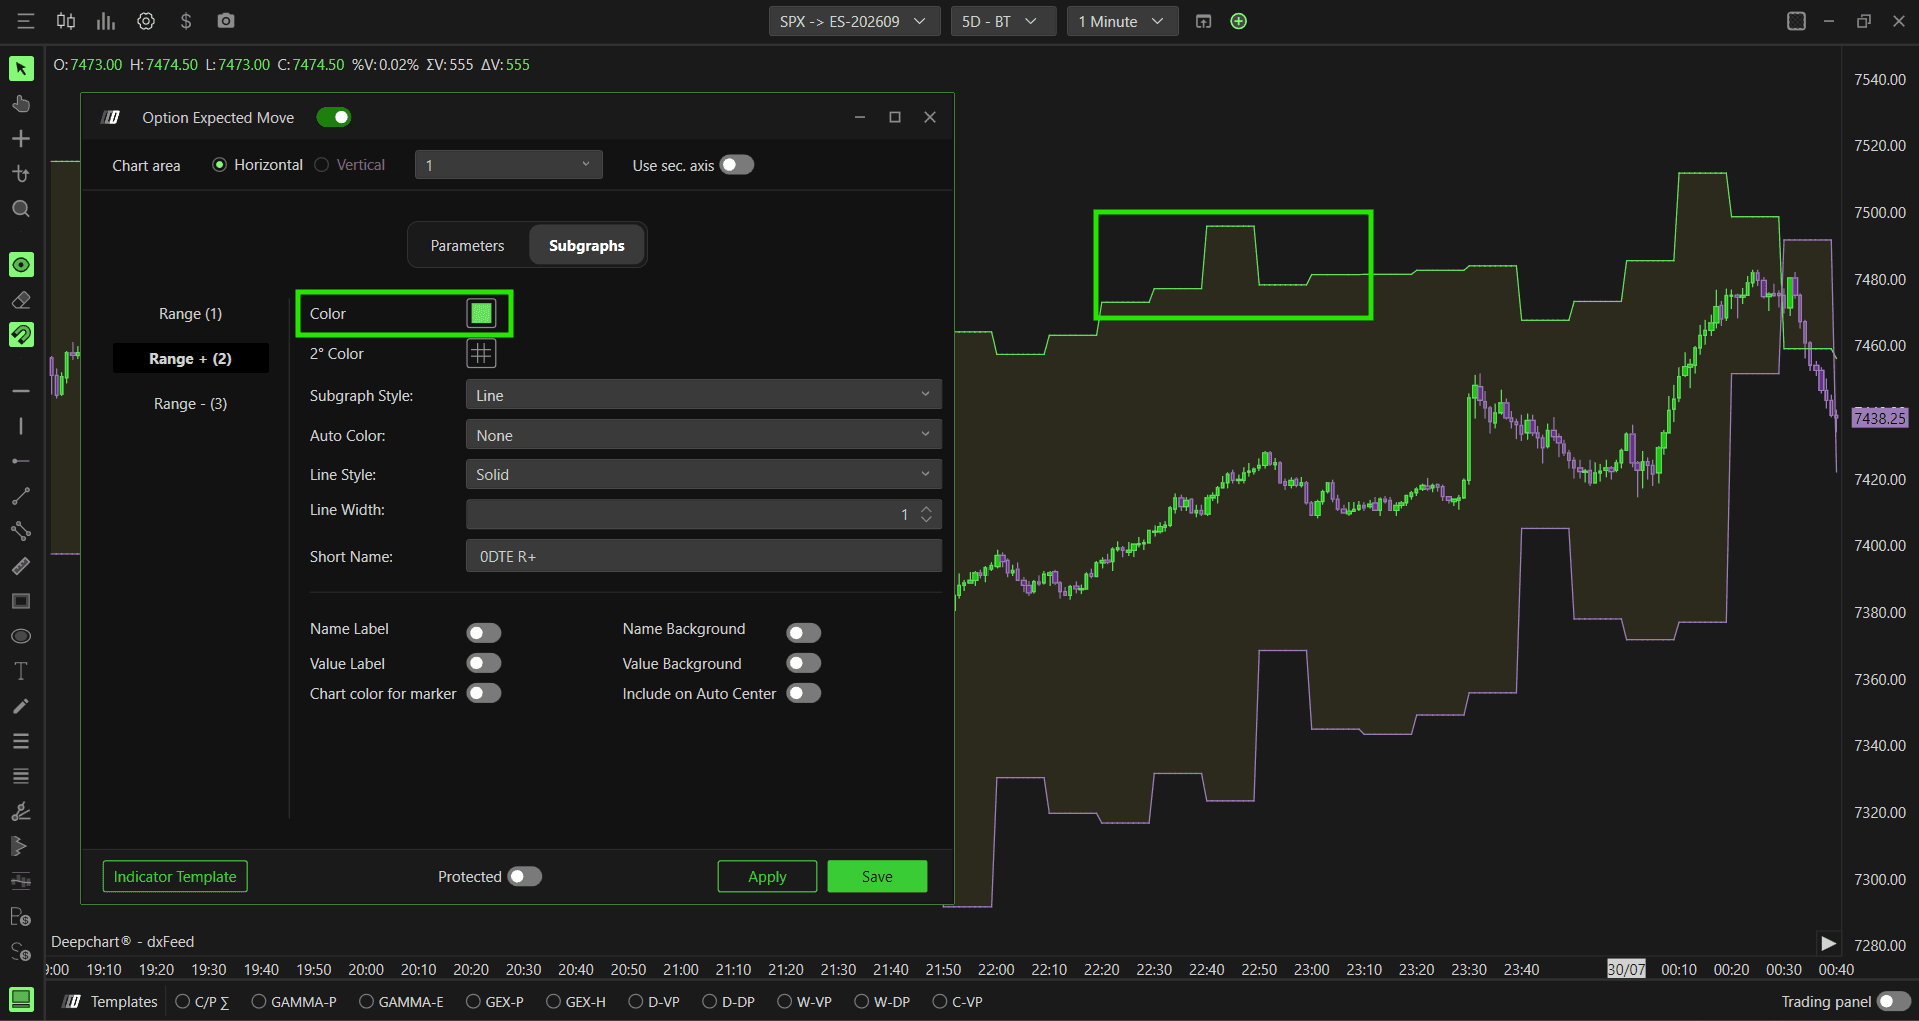
Range + (2)
Color - Set the color for the upper boundary line. Default is green
2° Color - Set a secondary color
Subgraph Style - Choose between Line, Hidden, or BrokerLine. Default is Hidden
Auto Color - Options: None, Slope, +/-. Default is None
Line Style - Choose between Solid or Dash. Default is Solid
Line Width - Default is 1
Short Name - Default label is 0DTE R+
Name Label - Toggle visibility of the name label
Value Label - Toggle visibility of the value label
Name Background - Toggle the name label background
Value Background - Toggle the value label background
Chart color for marker - Enable to use chart color for markers
Include on Auto Center - Enable to include this series in auto centering. Default is disabled
Range - (3)
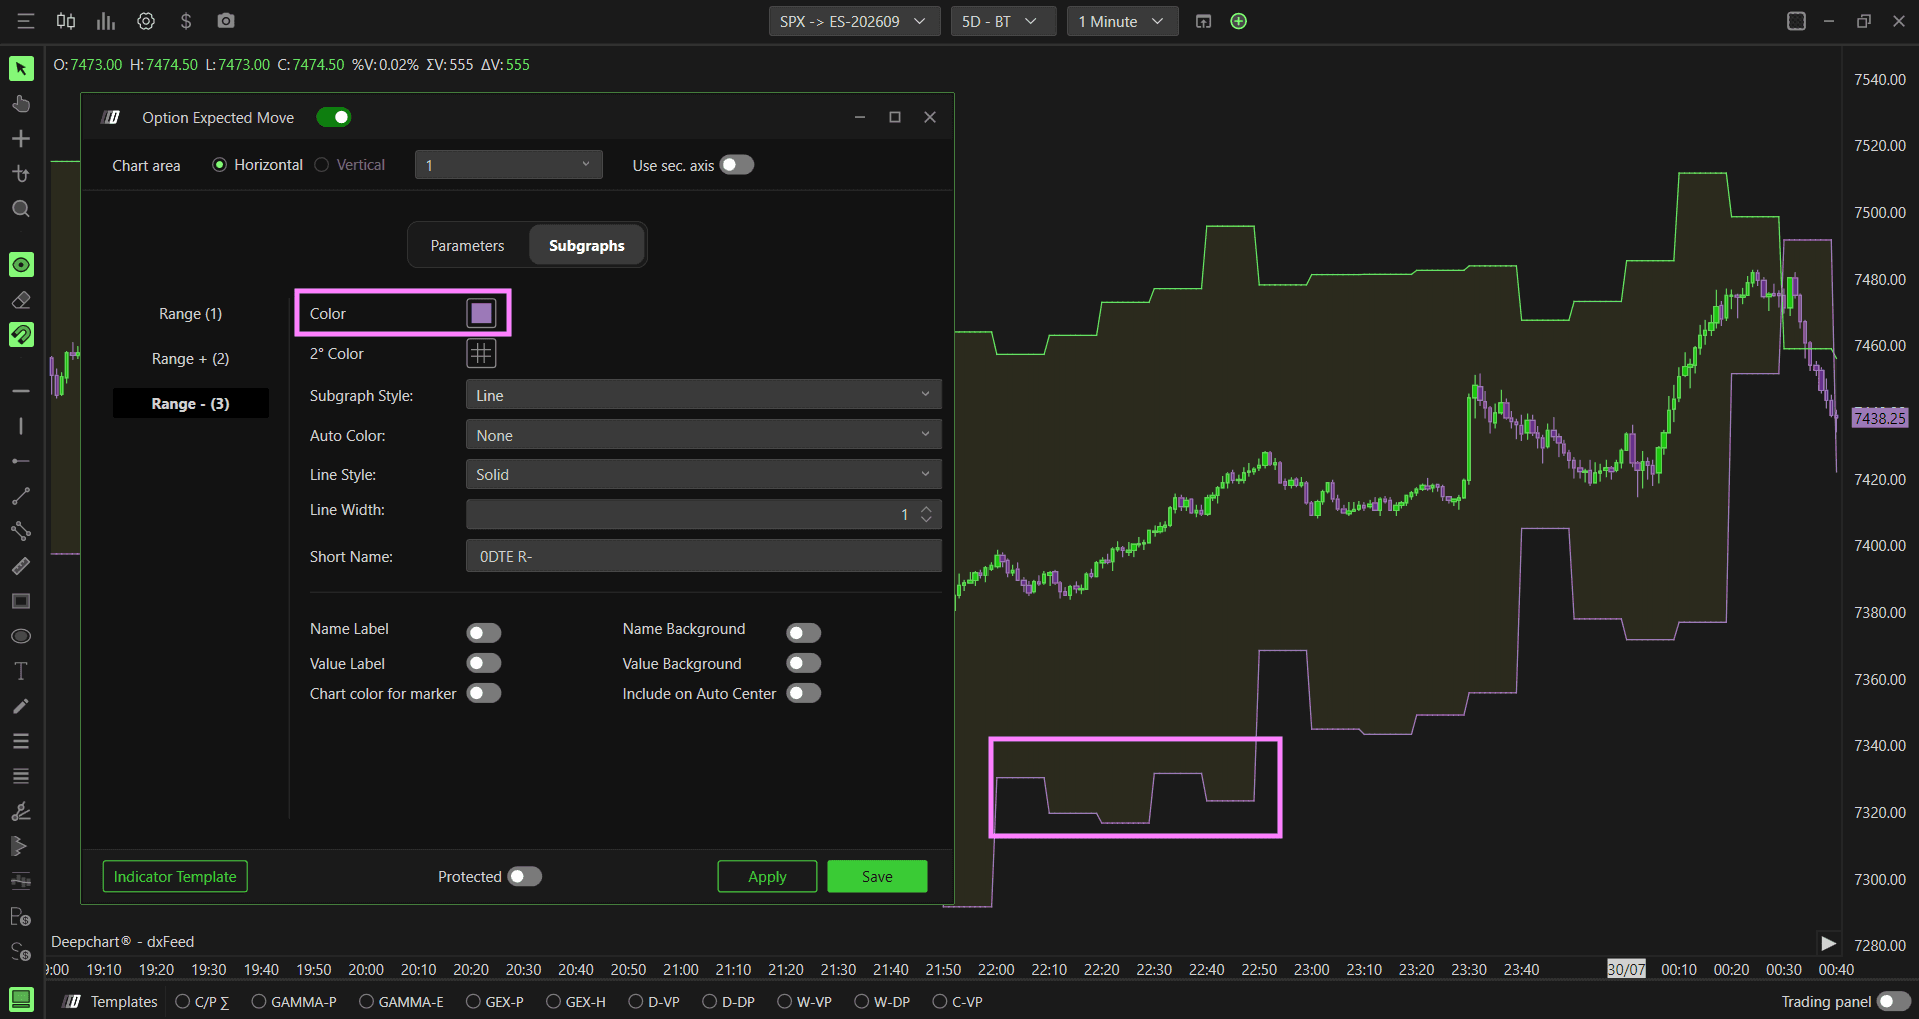
Color - Set the color for the lower boundary line. Default is purple
2° Color - Set a secondary color
Subgraph Style - Choose between Line, Hidden, or BrokerLine. Default is Hidden
Auto Color - Options: None, Slope, +/-. Default is None
Line Style - Choose between Solid or Dash. Default is Solid
Line Width - Default is 1
Short Name - Default label is 0DTE R-
Name Label - Toggle visibility of the name label
Value Label - Toggle visibility of the value label
Name Background - Toggle the name label background
Value Background - Toggle the value label background
Chart color for marker - Enable to use chart color for markers
Include on Auto Center - Enable to include this series in auto centering. Default is disabled
Example - How to Use Option Expected Move
Once added to your chart, you will see a shaded band plotted directly on the price chart. Here is a simple way to use it:
Price inside the band - When price is trading within the expected move band, it is behaving within the range the options market has priced in. Moves inside the band are considered normal for the session
Price approaching the upper boundary (Range +) - When price is pushing into the upper boundary, it is reaching the limit of what the options market expected. This can act as a potential target for long trades or a warning level to be cautious about chasing breakouts
Price approaching the lower boundary (Range -) - Similarly, when price is pushing into the lower boundary, it is reaching the downside limit. This can act as a potential target for short trades or a support area to watch for reversals
Price breaking outside the band - When price moves outside the expected range, it signals an unusually large move that the options market did not fully price in. These moves can be significant and often indicate a strong directional day
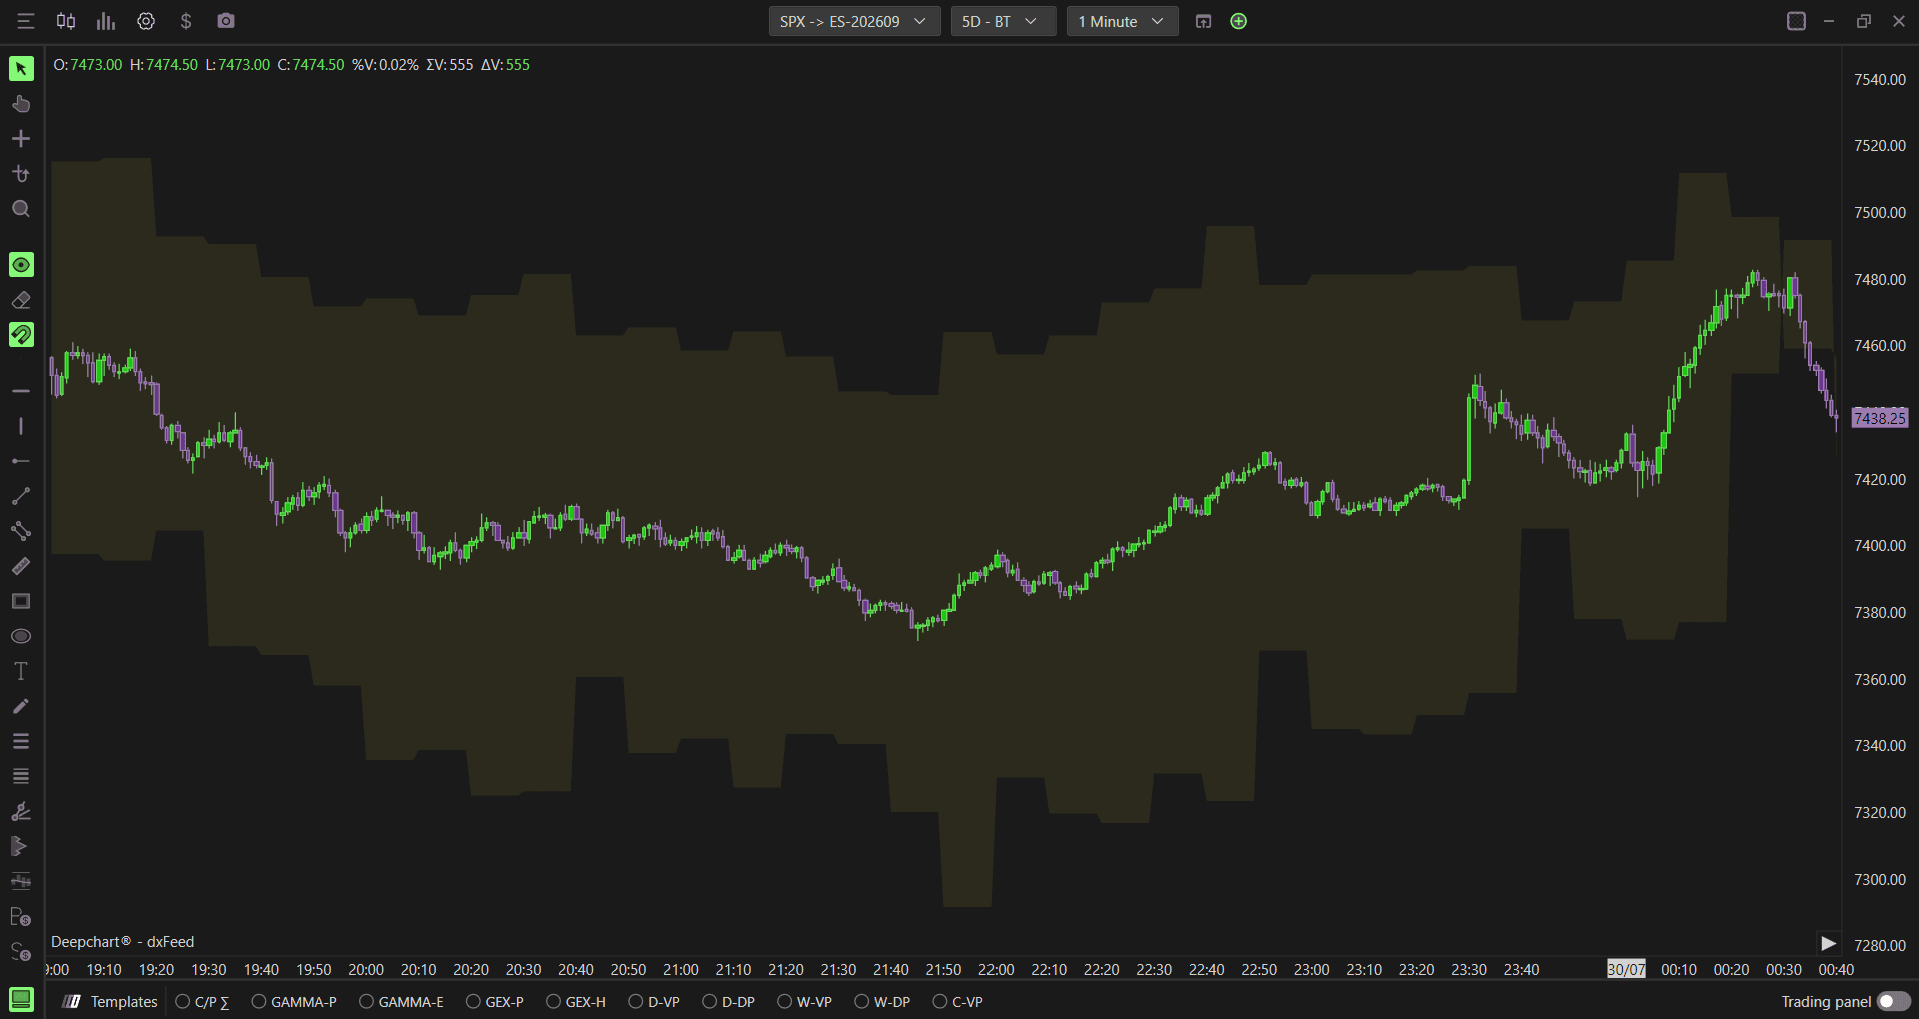
Tip: Use the expected move band in combination with your GEX levels and key price structure to identify high probability trade targets for the session.
Any Questions?
Our support team is available 24/7 and ready to help you with any question.
When reaching out, please include:
Screenshot (if any)
Briefly describe the assistance or support you require
DeepCharts Live Support - Chat with our agents directly using the live chat box on www.deepcharts.com, or click here for 24/7 Live Chat for immediate access.
Email Support - Reach us at support@deepcharts.com - please note that email responses may take a little longer than a live support chat.
