Updated:
Option Volume displays the total volume of options traded, broken down into Call Volume and Put Volume, plotted as bars on a subgraph below your chart. It helps you quickly identify which side of the market - calls or puts - is seeing more activity at any given time, giving you a broader view of options market participation alongside your price action.
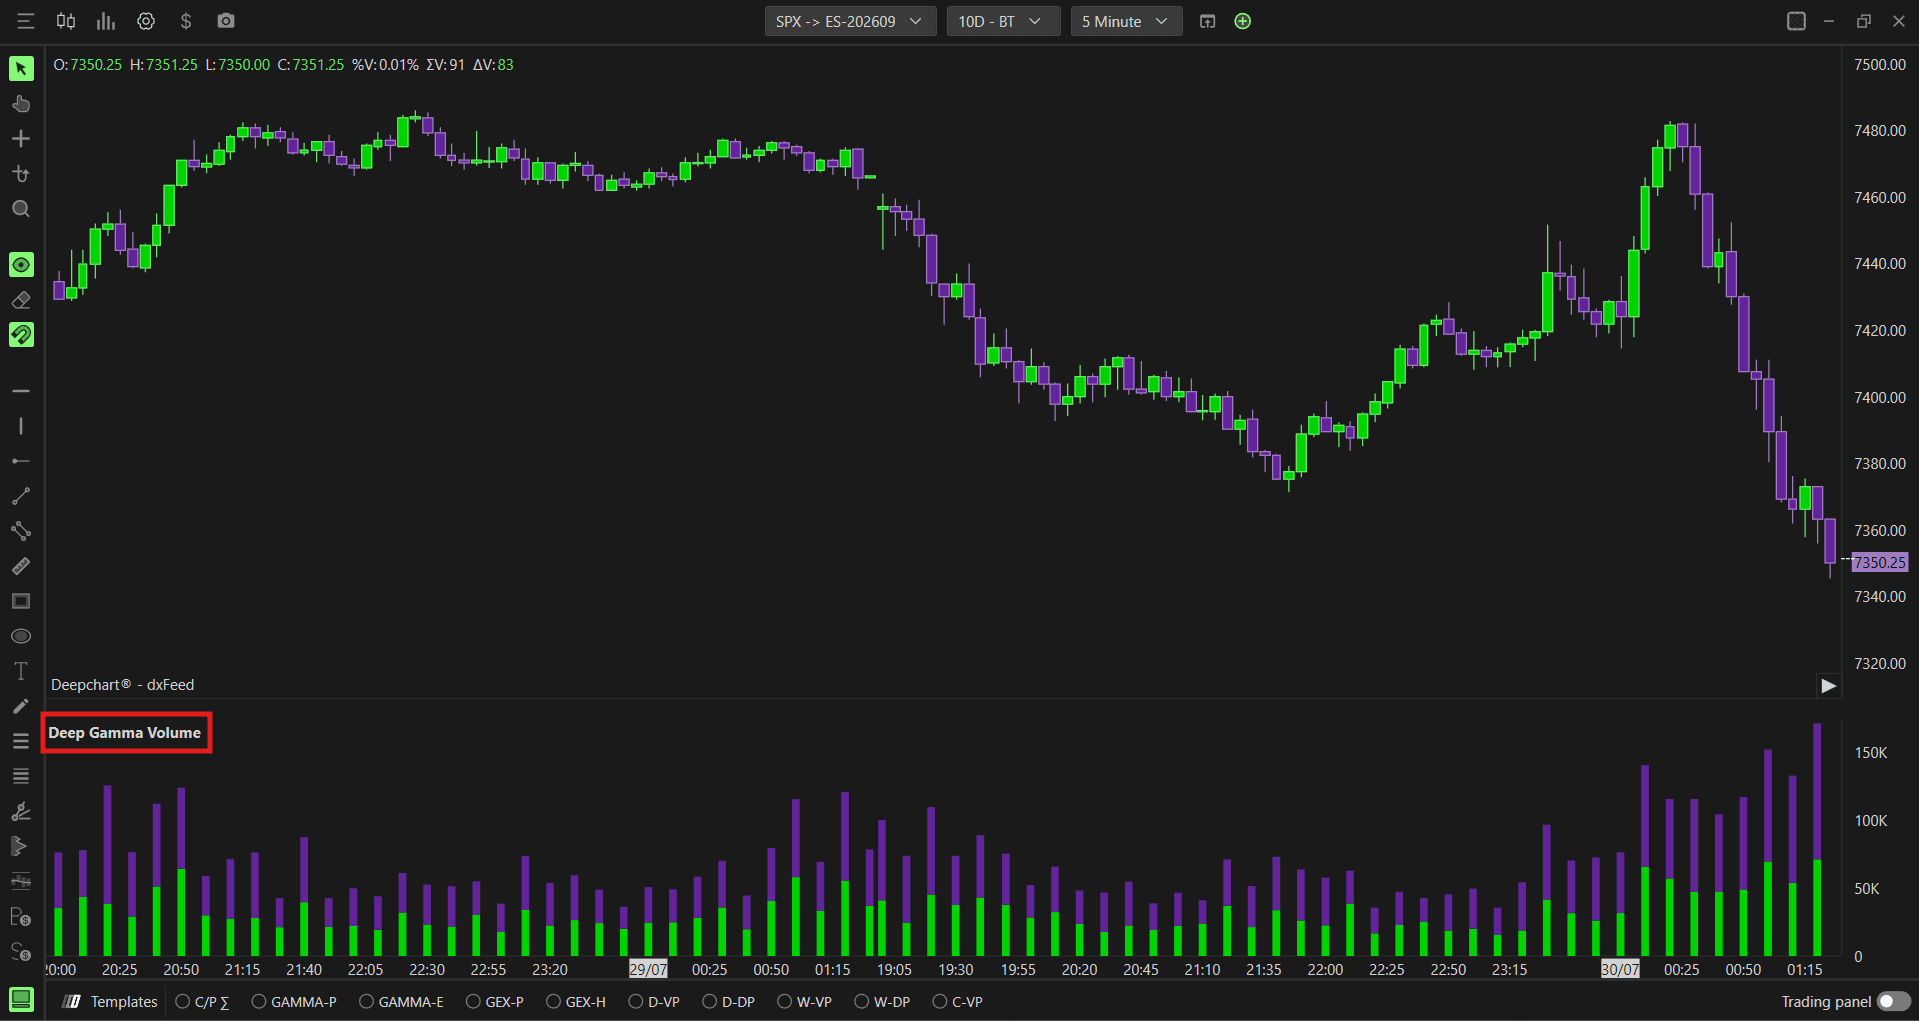
Note: Option Volume is available on NDX, QQQ, SPY, and SPX.

How to Add Option Volume
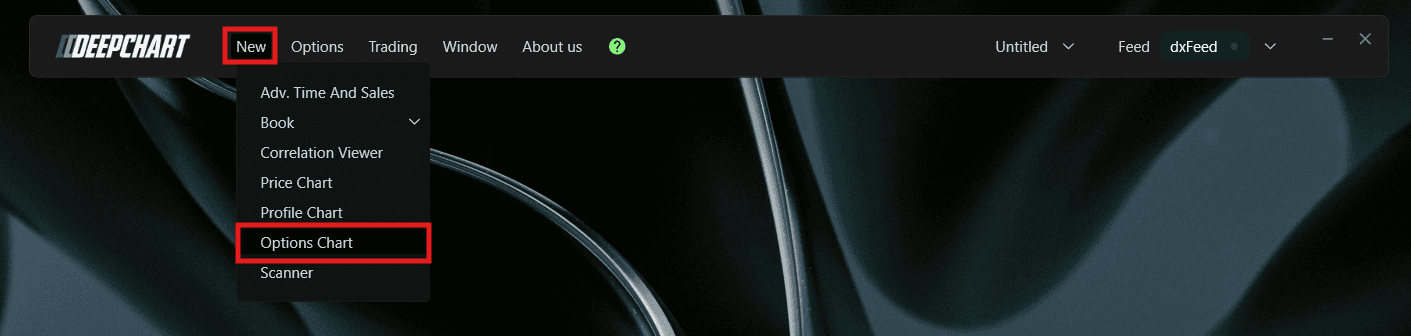
Go to New in the top menu
Click on Option Chart
A Select Instrument dialog will appear with the following options:
NDX - Symbol: NQ-CME, Exchange: CME
QQQ - Symbol: NQ-CME, Exchange: CME
SPX - Symbol: ES-CME, Exchange: CME
SPY - Symbol: ES-CME, Exchange: CME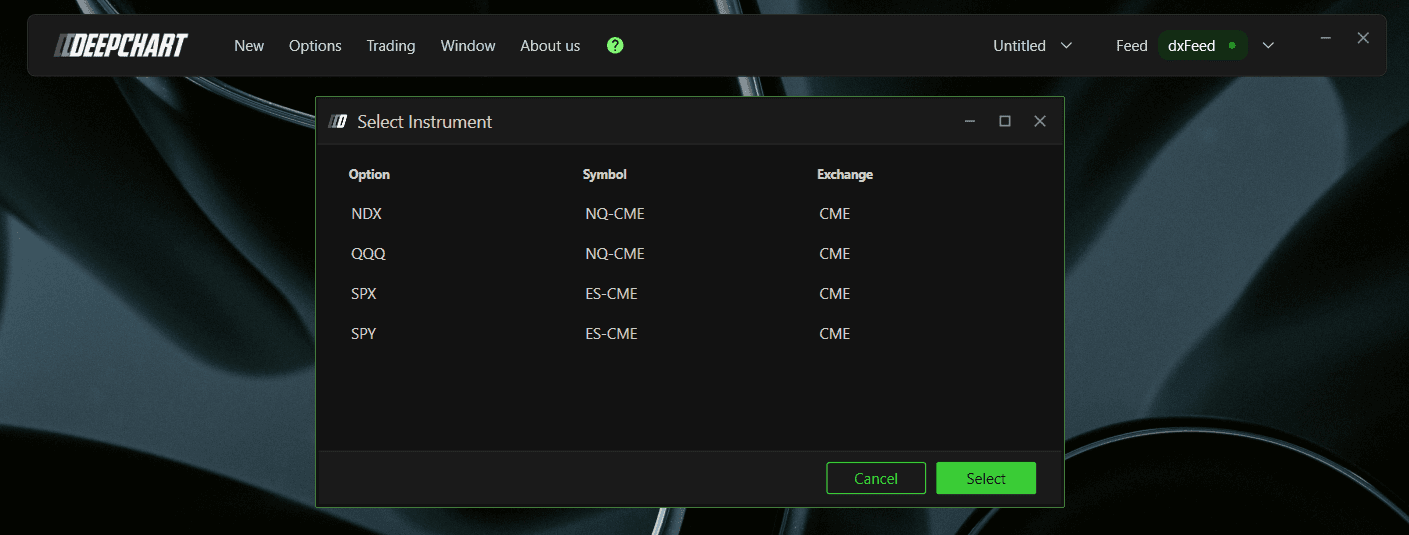
Select your preferred instrument and click to open the chart
Once the Option Chart is loaded, click the Indicator Add button on the chart toolbar
Search for Option Volume and click + to add it
Click the settings icon to open the configuration window
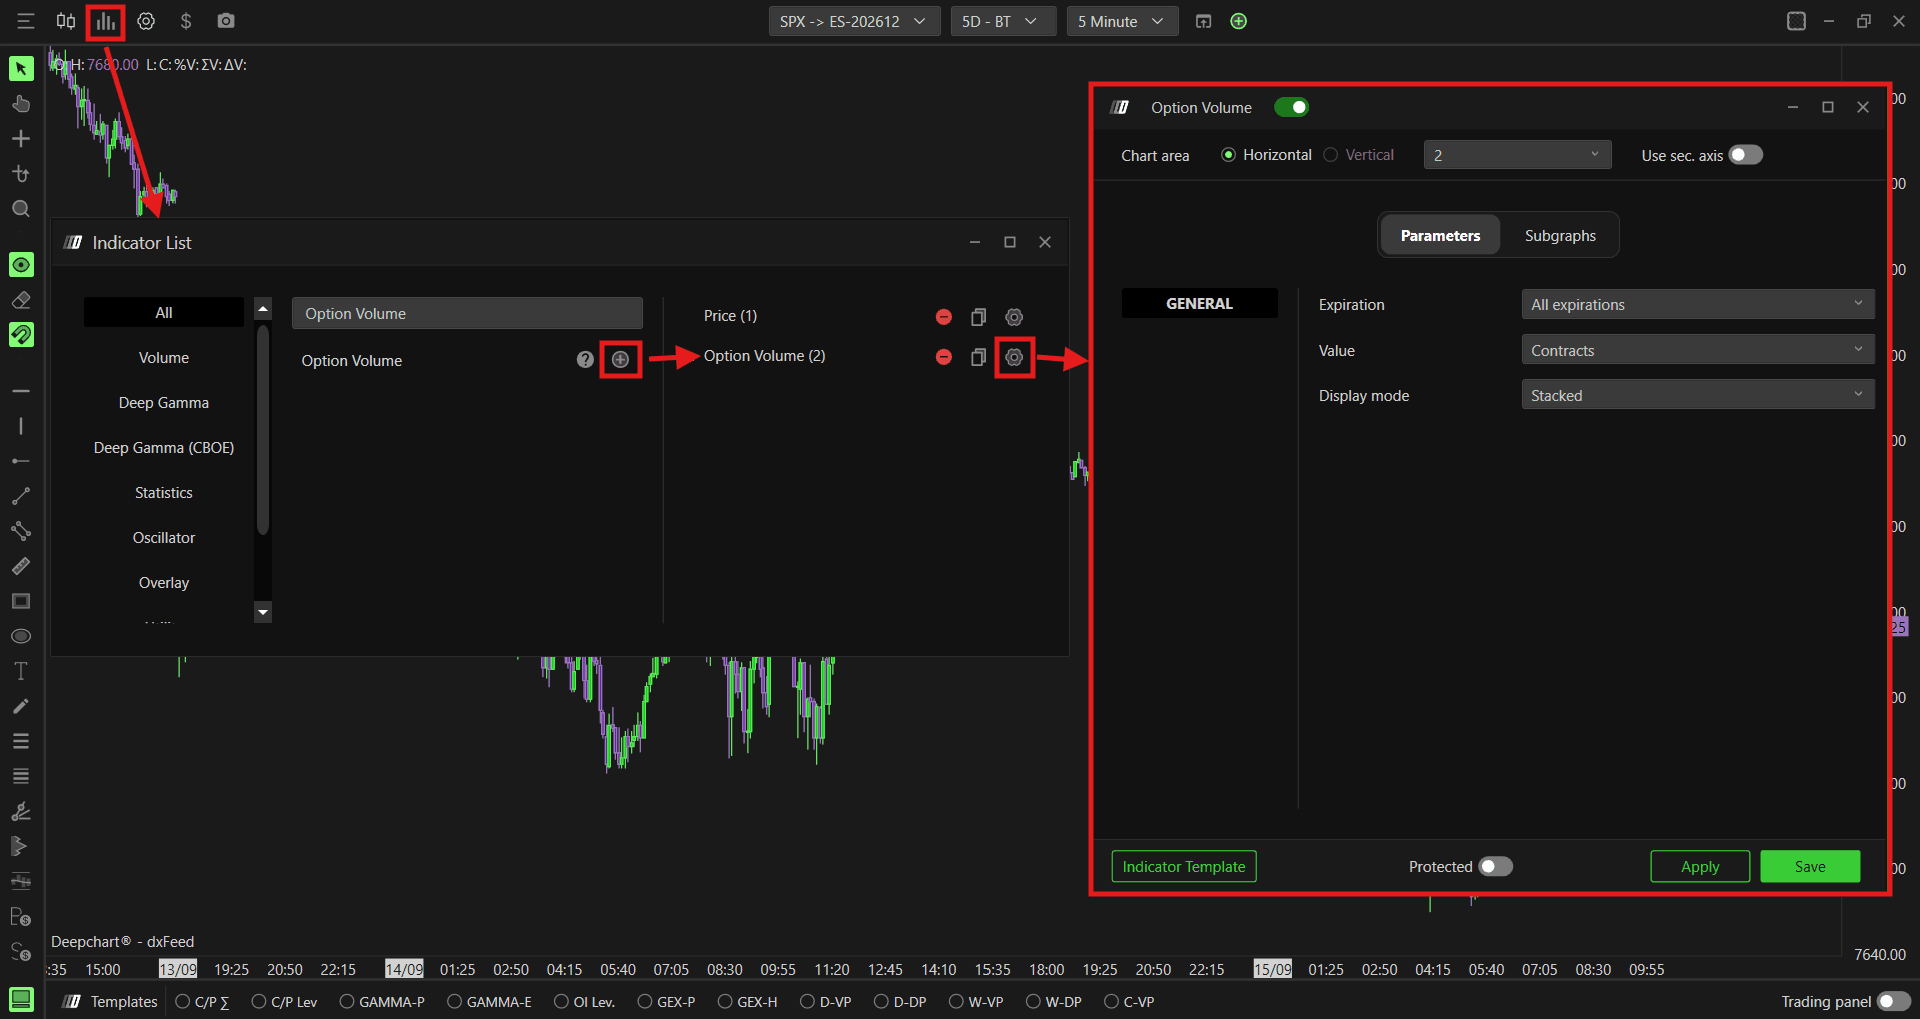
Settings
Parameters
General
Expiration - Filter volume by expiration. Options available: 0 DTE, <= 1d, <= 2d, <= 3d, <= 4d, <= 5d, <= 6d, <= 7d, <= 31d, <= 91d, All expirations. Default is All expirations
Value - Choose how the volume is measured. Options available:
Contracts (default) - displays the raw number of option contracts traded.
Use this when: you want a simple count of trading activity, regardless of pricePremium - displays volume in terms of total dollar premium traded.
Use this when: you want to weigh volume by dollar value, since a small number of expensive contracts can matter more than a large number of cheap onesFuture contracts - displays volume converted into equivalent futures contracts.
Use this when: you want to compare options volume directly against futures volume on the same chart
Display mode - Choose how the call and put volume bars are displayed. Options available:
Splitted (default) - shows call and put volume as separate bar sets side by side, making it easier to compare the two independently
Stacked - combines call and put volume into a single stacked bar per candle, making it easier to read total volume at a glance while still showing the call/put split within each bar

Subgraphs
The Subgraphs tab lets you control how each series is displayed on the chart. There are 3 subgraphs:
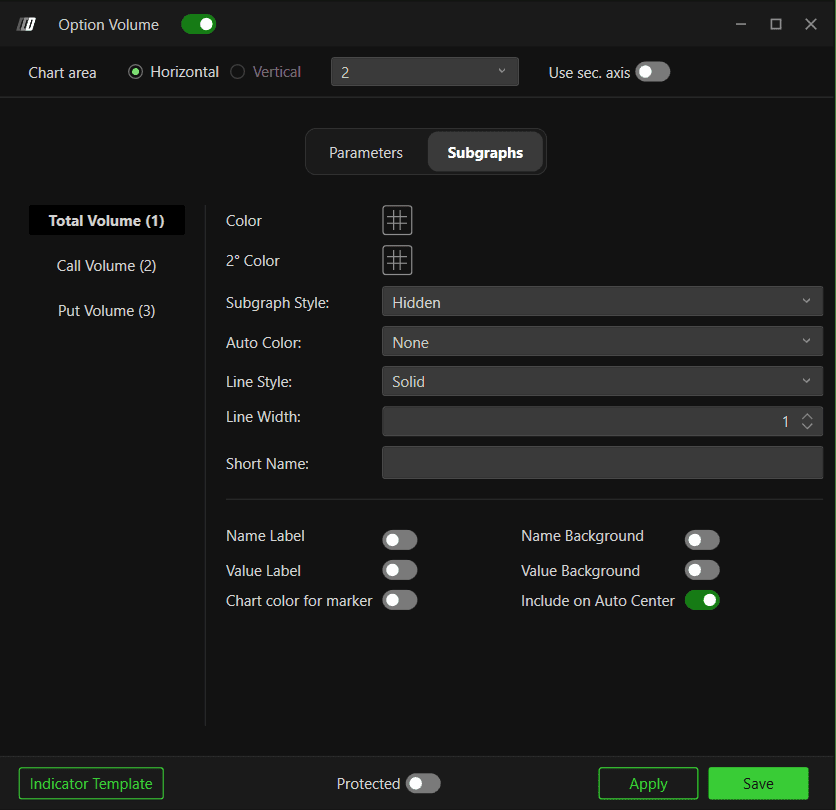
Total Volume (1)
Color - Set the color for total volume
2° Color - Set a secondary color
Subgraph Style - Choose between Line or Hidden. Default is Hidden
Auto Color - Options: None, Slope, +/-. Default is None
Line Style - Choose between Solid or Dash. Default is Solid
Line Width - Set the line width. Default is 1
Short Name - Set a custom label for this series
Name Label - Toggle visibility of the name label
Value Label - Toggle visibility of the value label
Name Background - Toggle the name label background
Value Background - Toggle the value label background
Chart color for marker - Enable to use chart color for markers
Include on Auto Center - Enable to include this series in auto centering. Default is enabled
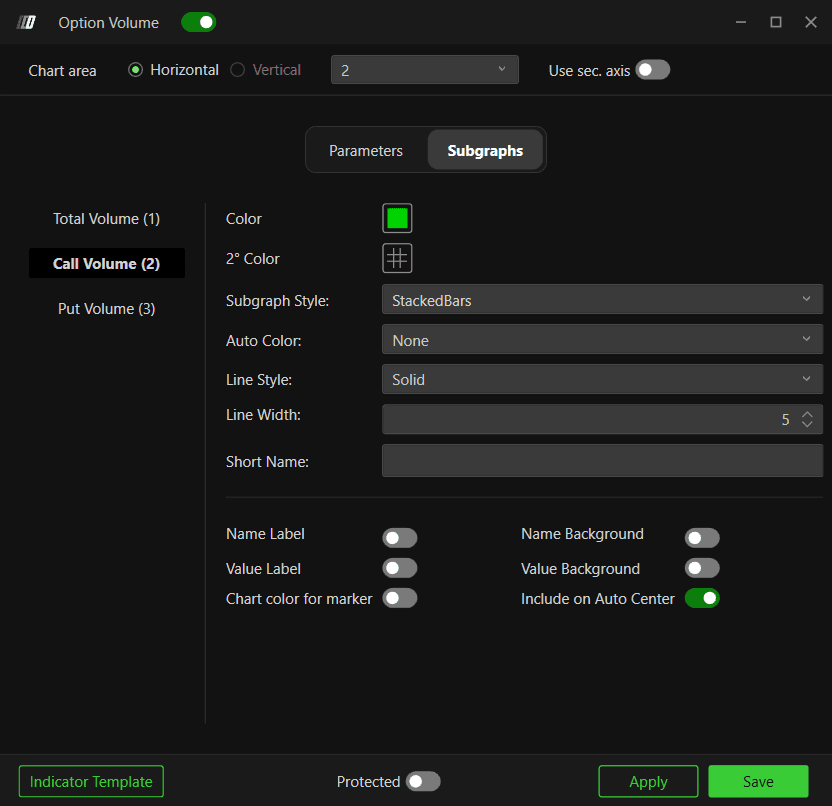
Call Volume (2)
Color - Set the color for call volume. Default is green
2° Color - Set a secondary color
Subgraph Style - Default is StackedBars
Auto Color - Options: None, Slope, +/-. Default is None
Line Style - Choose between Solid or Dash. Default is Solid
Line Width - Default is 5
Short Name - Set a custom label for this series
Name Label - Toggle visibility of the name label
Value Label - Toggle visibility of the value label
Name Background - Toggle the name label background
Value Background - Toggle the value label background
Chart color for marker - Enable to use chart color for markers
Include on Auto Center - Enable to include this series in auto centering. Default is enabled
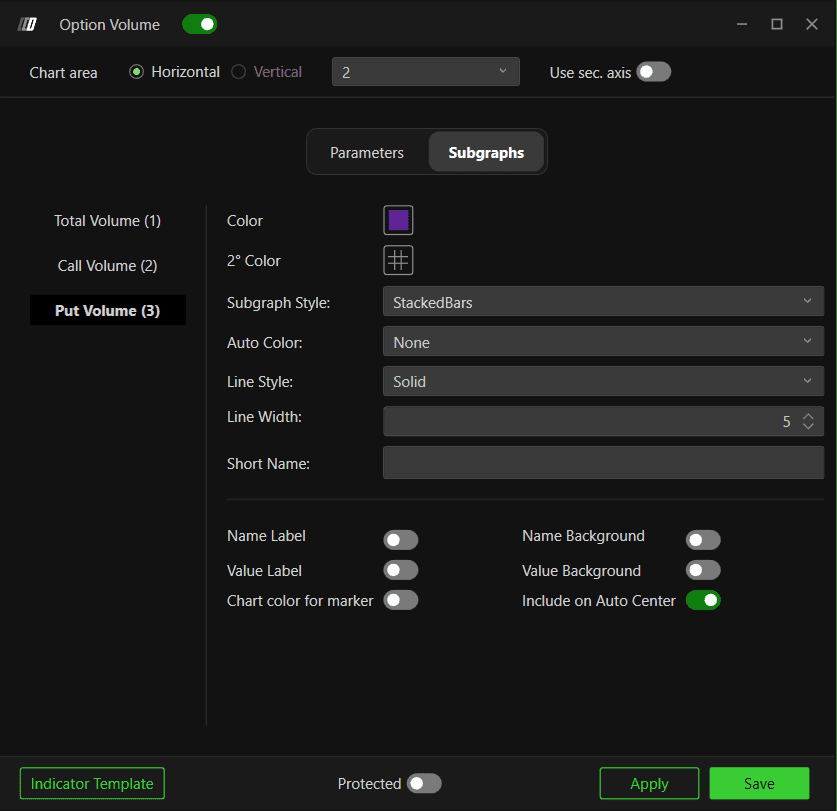
Put Volume (3)
Color - Set the color for put volume. Default is purple
2° Color - Set a secondary color
Subgraph Style - Default is StackedBars
Auto Color - Options: None, Slope, +/-. Default is None
Line Style - Choose between Solid or Dash. Default is Solid
Line Width - Default is 5
Short Name - Set a custom label for this series
Name Label - Toggle visibility of the name label
Value Label - Toggle visibility of the value label
Name Background - Toggle the name label background
Value Background - Toggle the value label background
Chart color for marker - Enable to use chart color for markers
Include on Auto Center - Enable to include this series in auto centering. Default is enabled
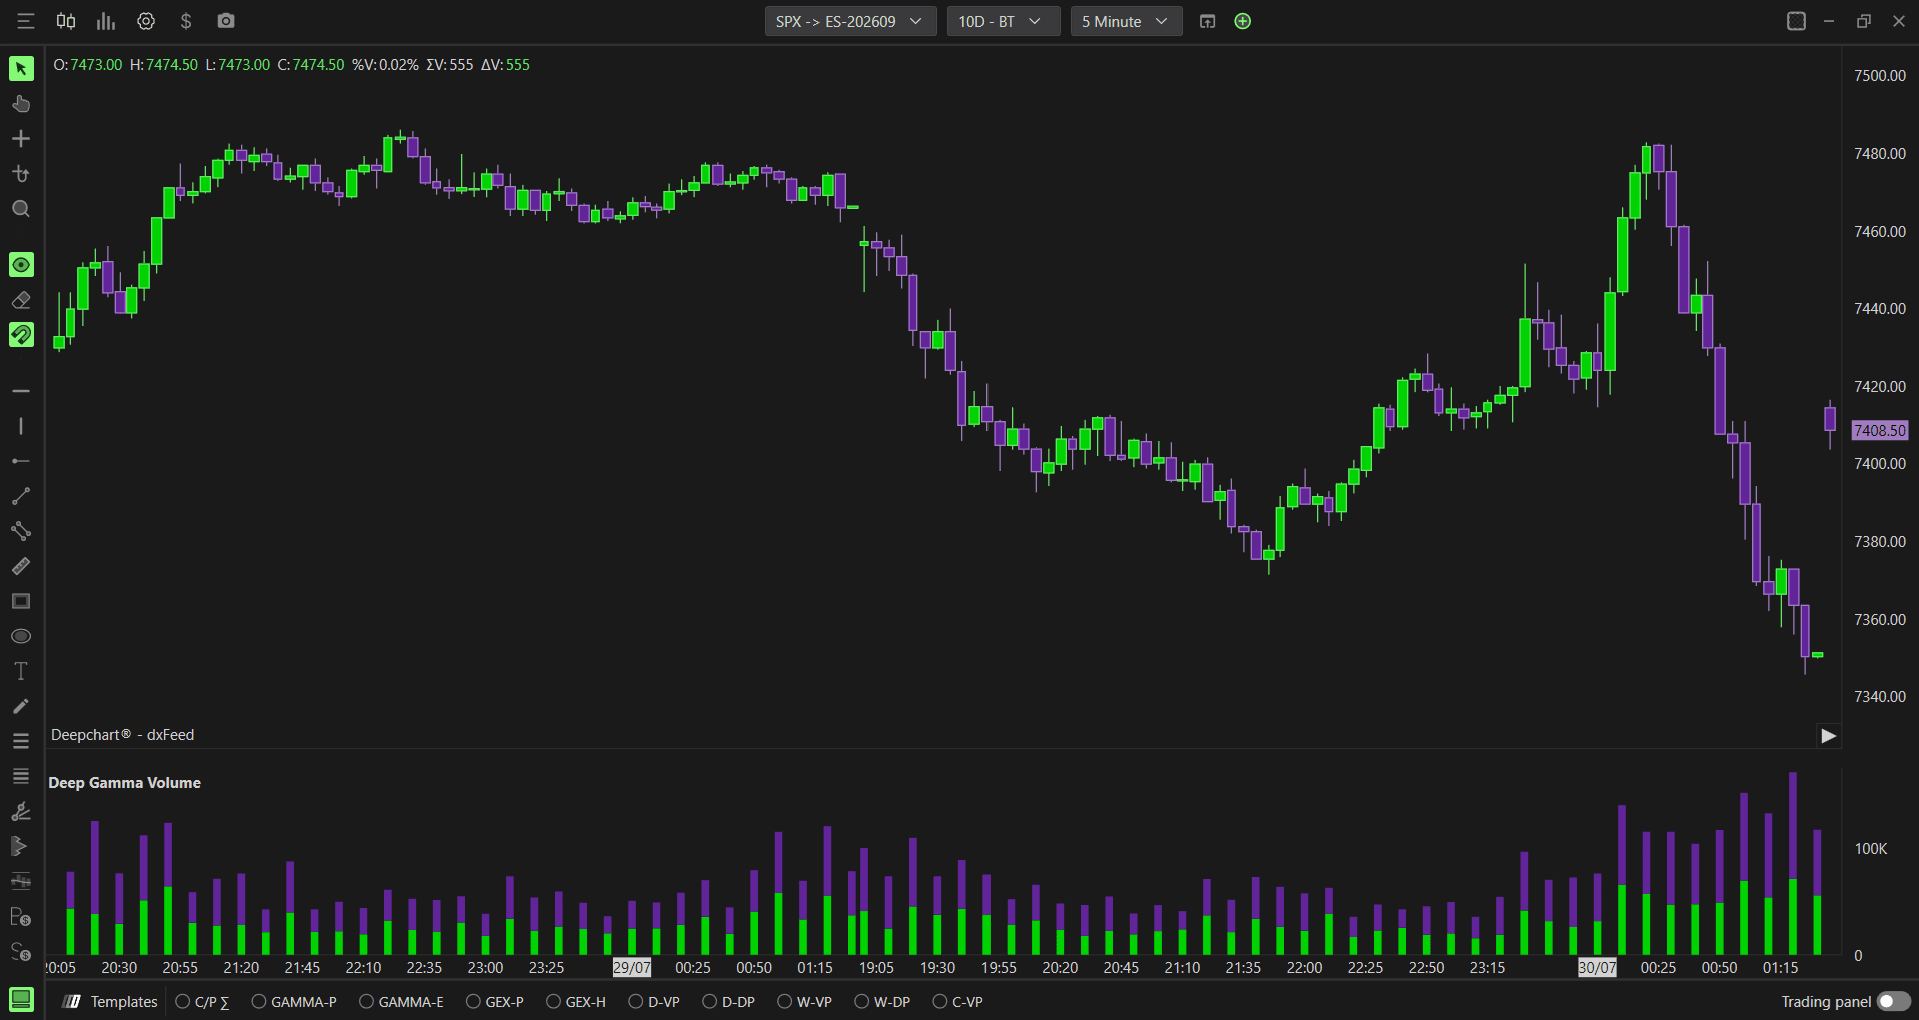
Option Volume Indicator View -

Example - How to Use Option Volume
Option Volume helps you understand which side of the options market is more active at any given time. Here are some practical ways to use it:
Reading the Bars
Green bars = Call volume
Purple bars = Put volume
The taller the bar, the more activity on that side
Practical Uses
Identifying directional bias - When call volume is consistently higher than put volume throughout the session, it suggests more bullish activity in the options market. When put volume dominates, it suggests more bearish activity
Spotting volume spikes - A sudden spike in call or put volume can signal that large participants are entering positions. When this happens near a key GEX level it adds confluence to that level
Comparing call vs put activity - Switch to Stacked mode to quickly see combined volume at a glance and spot which side is dominating, or use Splitted mode to compare call and put bars independently side by side. A balanced view suggests the market is in a neutral state. A clear dominance of one side suggests directional pressure
Filtering by expiration - Use the 0 DTE filter to focus only on same day options activity which has the most immediate impact on price movement
Note: Option Volume gives you a broad view of market participation. Always combine it with your GEX levels, footprint and DOM for a complete picture before making any trading decisions.
Any Questions?
Our support team is available 24/7 and ready to help you with any question.
When reaching out, please include:
Screenshot (if any)
Briefly describe the assistance or support you require
DeepCharts Live Support - Chat with our agents directly using the live chat box on www.deepcharts.com, or click here for 24/7 Live Chat for immediate access.
Email Support - Reach us at support@deepcharts.com - please note that email responses may take a little longer than a live support chat.
