Indicators

Updated:

Feb 11, 2026

Average Directional Index (ADX)

Average Directional Index (ADX)

No headings found on page

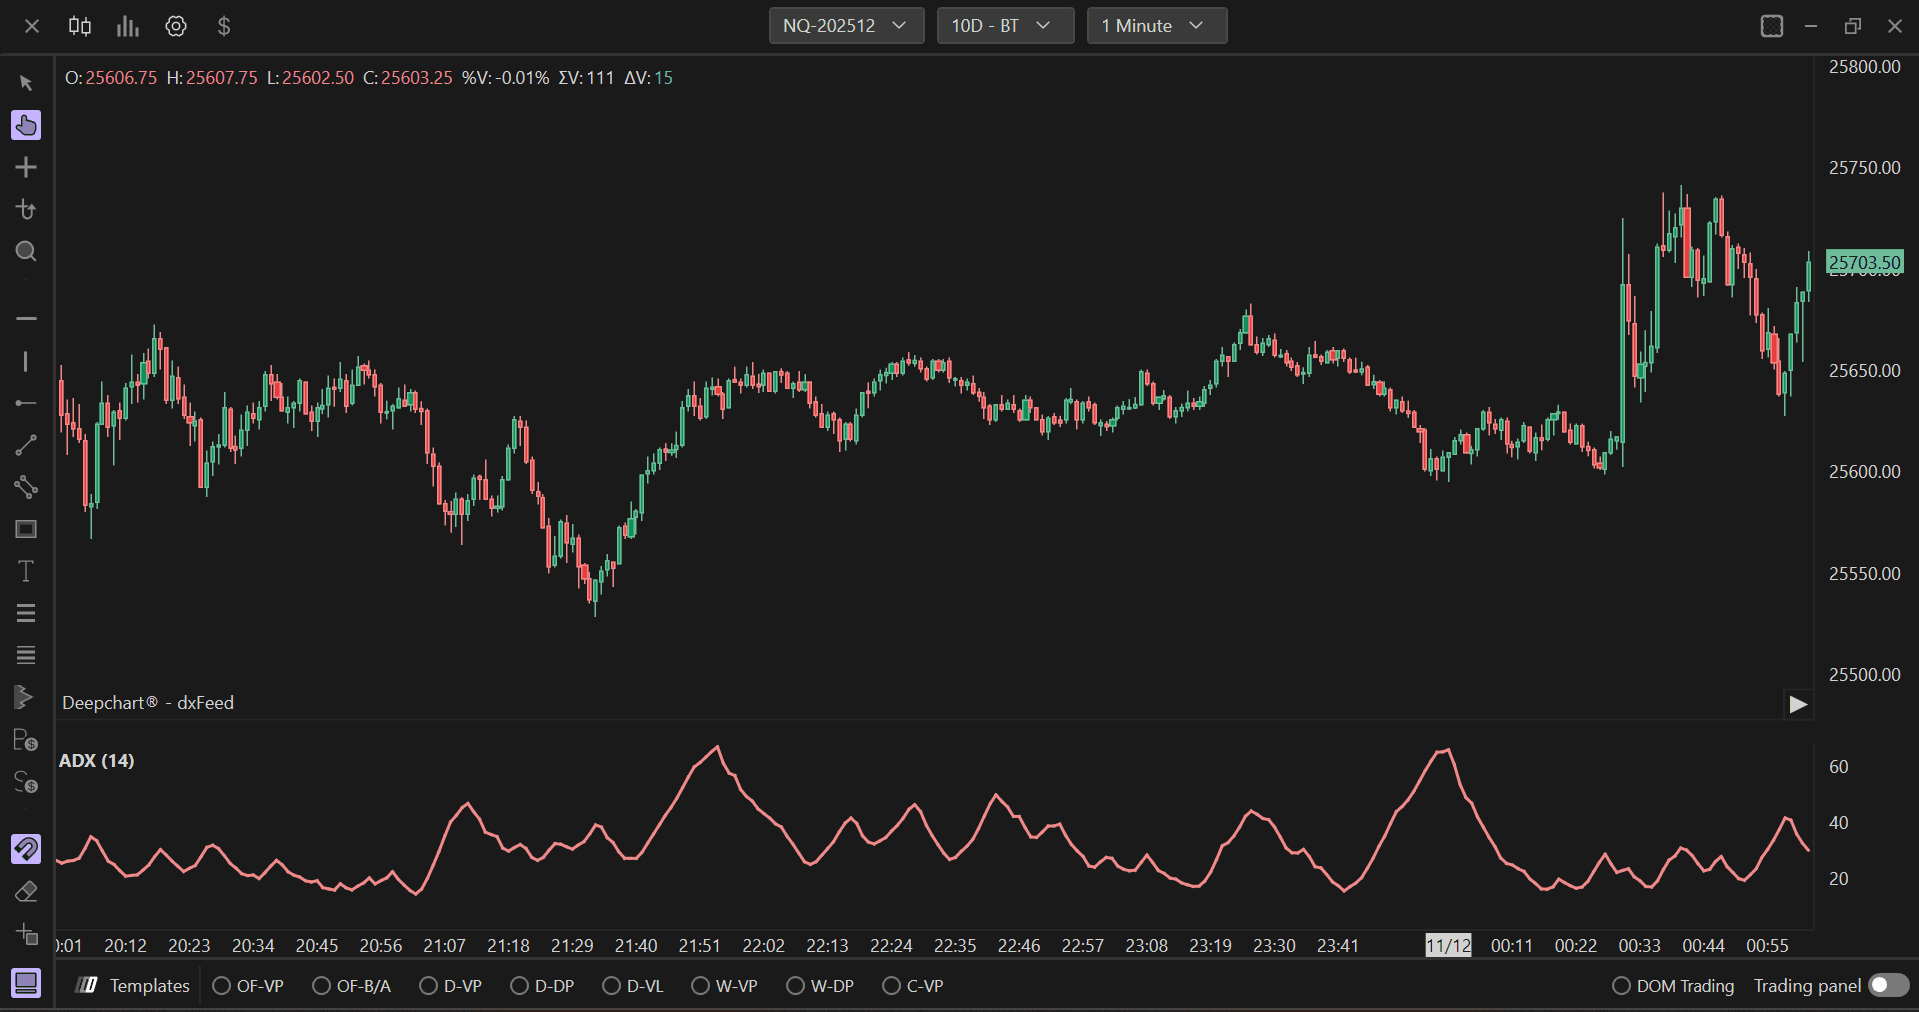
The Average Directional Index (ADX) is a technical analysis indicator used to measure the strength of a trend in an asset's price. The ADX indicator helps traders identify whether the market is trending or moving sideways, making it a valuable tool for trend-based trading strategies.

Using Settings

Clicking on the indicator settings icon will open its configuration window, within which you will be able to make several choices regarding the functionality of the indicator itself.

Parameters 

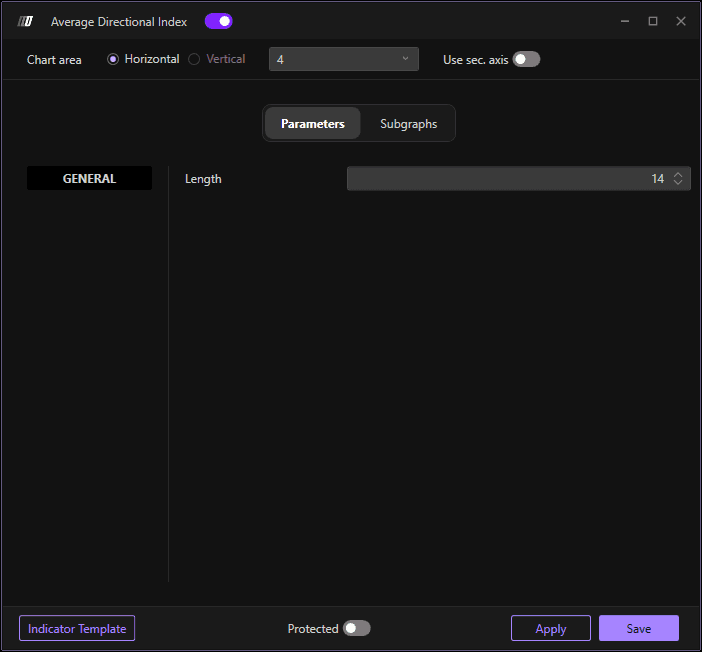
  • Period: Set the period for ADX calculation (default is typically 14 periods)

Subgraphs

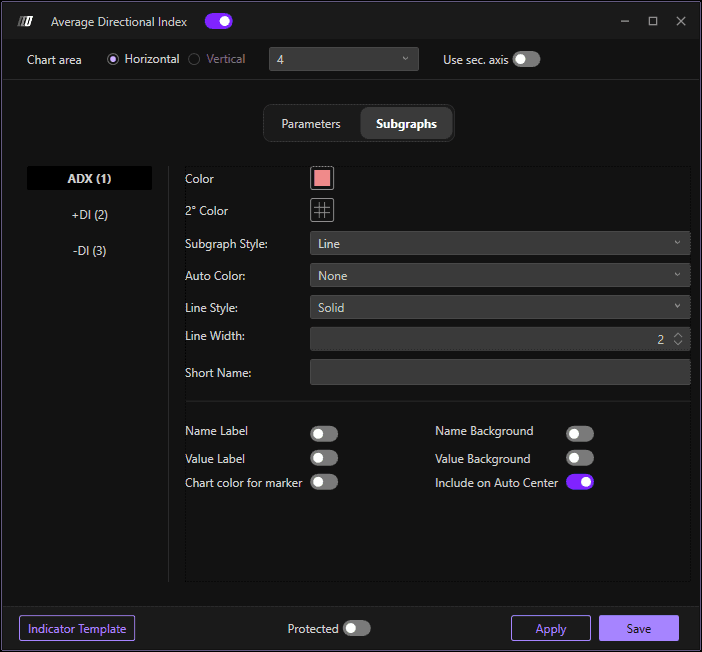
  • Line Color: Defines the color of the main ADX line

  • Line Style: Defines the style of the ADX line (solid, dashed)

  • Line Width : Defines the thickness of the ADX line

  • Plus DI Color: Defines the color of the Plus Directional Indicator line

  • Minus DI Color: Defines the color of the Minus Directional Indicator line

Tools for futures, currency & options involves substantial risk & is not appropriate for everyone. Only risk capital should be used for trading.

Testimonials appearing on this website may not be representative of other clients or customers and is not a guarantee of future performance or success.

Tools for futures, currency & options involves substantial risk & is not appropriate for everyone. Only risk capital should be used for trading. Testimonials appearing on this website may not be representative of other clients or customers and is not a guarantee of future performance or success.

Deepcharts © 2026 All right reserved