Indicators
Updated:
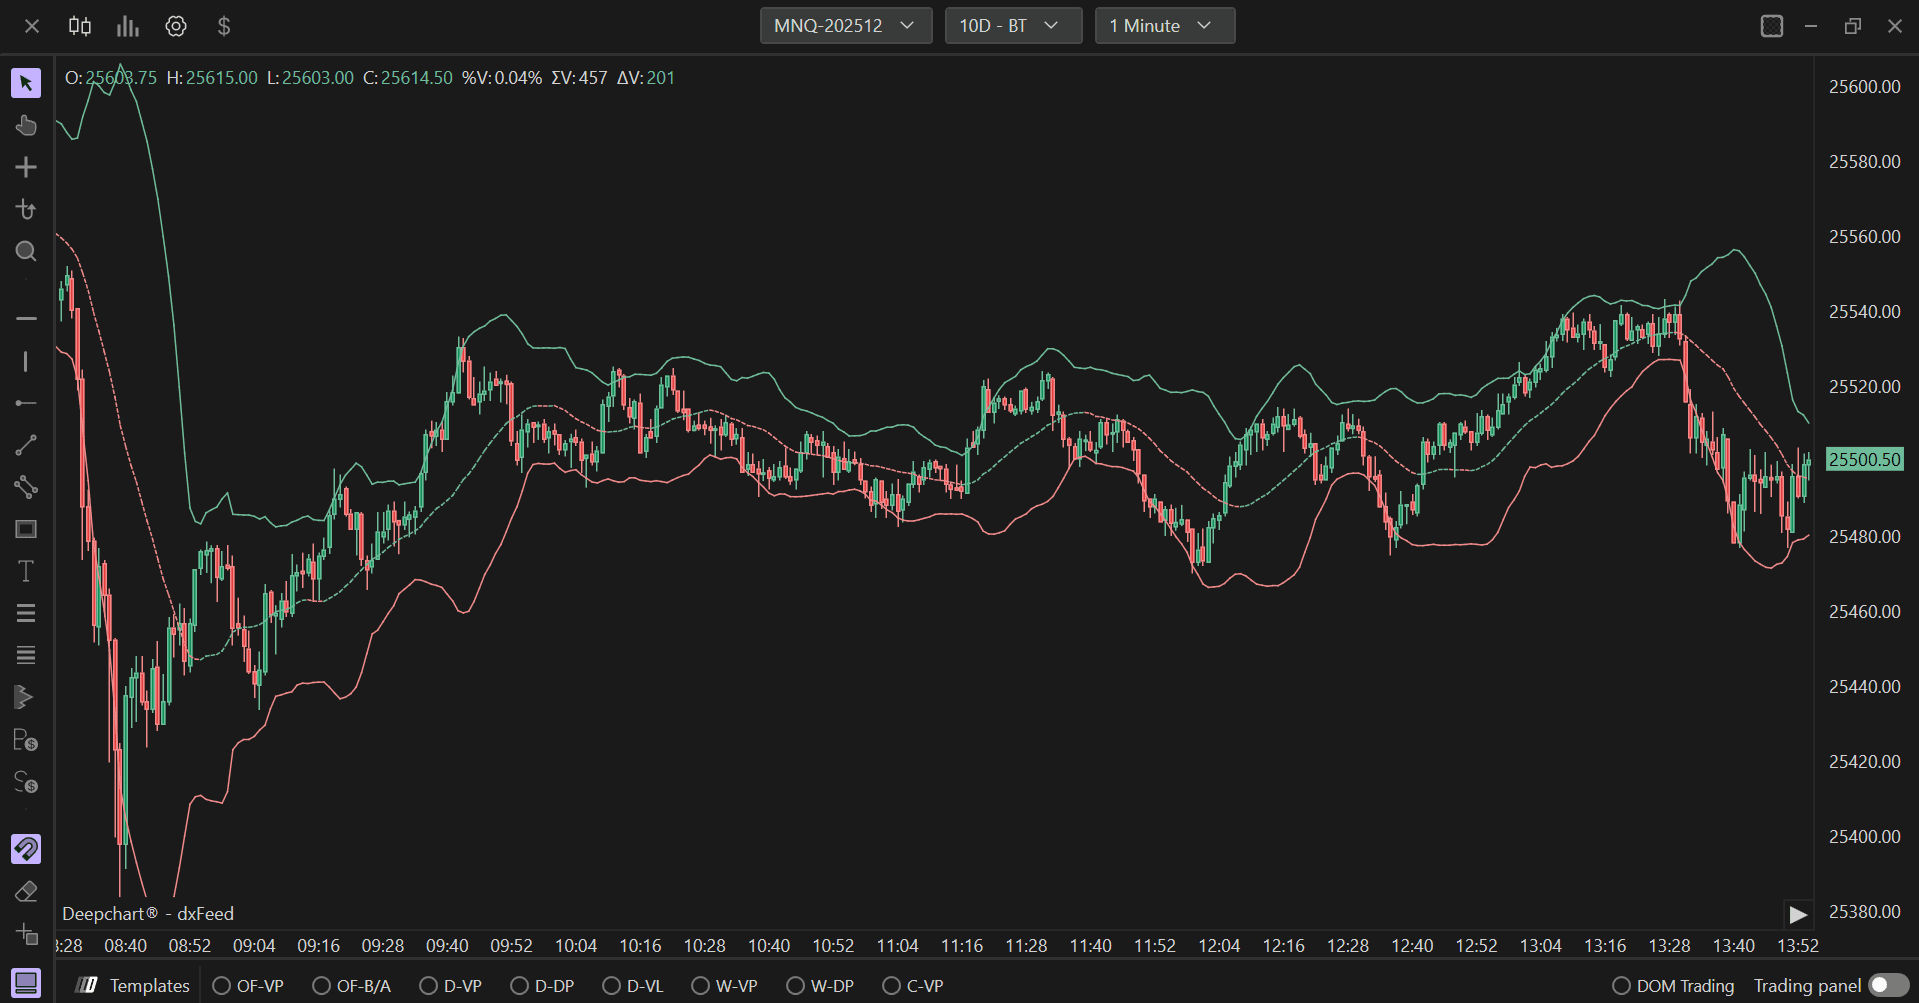
The Bollinger Bands are a technical analysis indicator developed by John Bollinger in the 1980s, used to measure market volatility and identify potential trading opportunities. The Bollinger Bands indicator is a powerful technical analysis tool that provides valuable insights into volatility, overbought/oversold conditions, and potential trend reversals.
This indicator consists of a central line, typically a simple moving average (SMA), and two outer bands representing standard deviations from the SMA.
Using Settings
Clicking on the indicator settings icon will open its configuration window, within which you can make several choices regarding the indicator's functionality.
Parameters
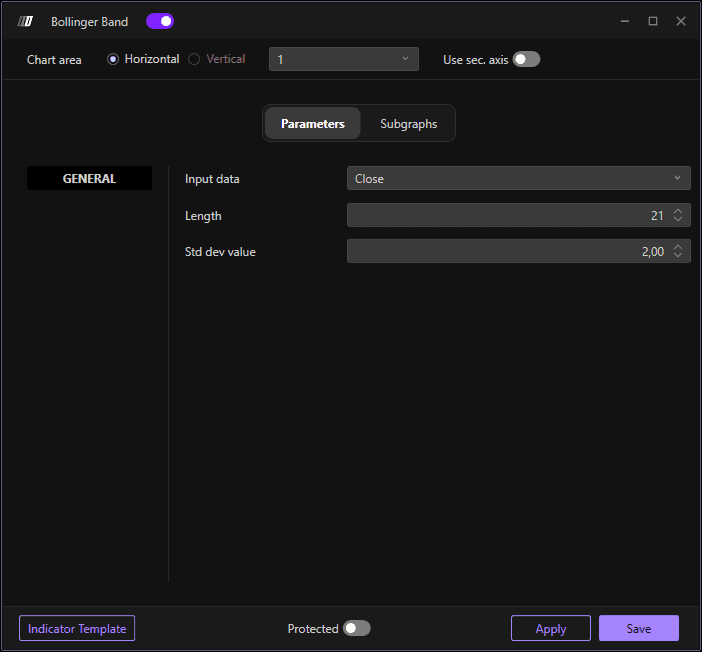
In the Parameters section, the following parameters can be set:
Input Data : Reference on which the average is calculated (High, Low, Open, Close)
Periods: Period used for the calculation of the average (middle line)
Std Dev Value: Coefficient used for standard deviation (lower and upper bands)
Subgraphs

In the Series section you can set the colors and style of the following lines:
Bollinger Avg: Middle line (average)
Bollinger Up: Upper band
Bollinger Down: Lower band
For each line, you can customize the color, style (solid or dashed) and thickness to match your trading preferences.