Indicators
Updated:
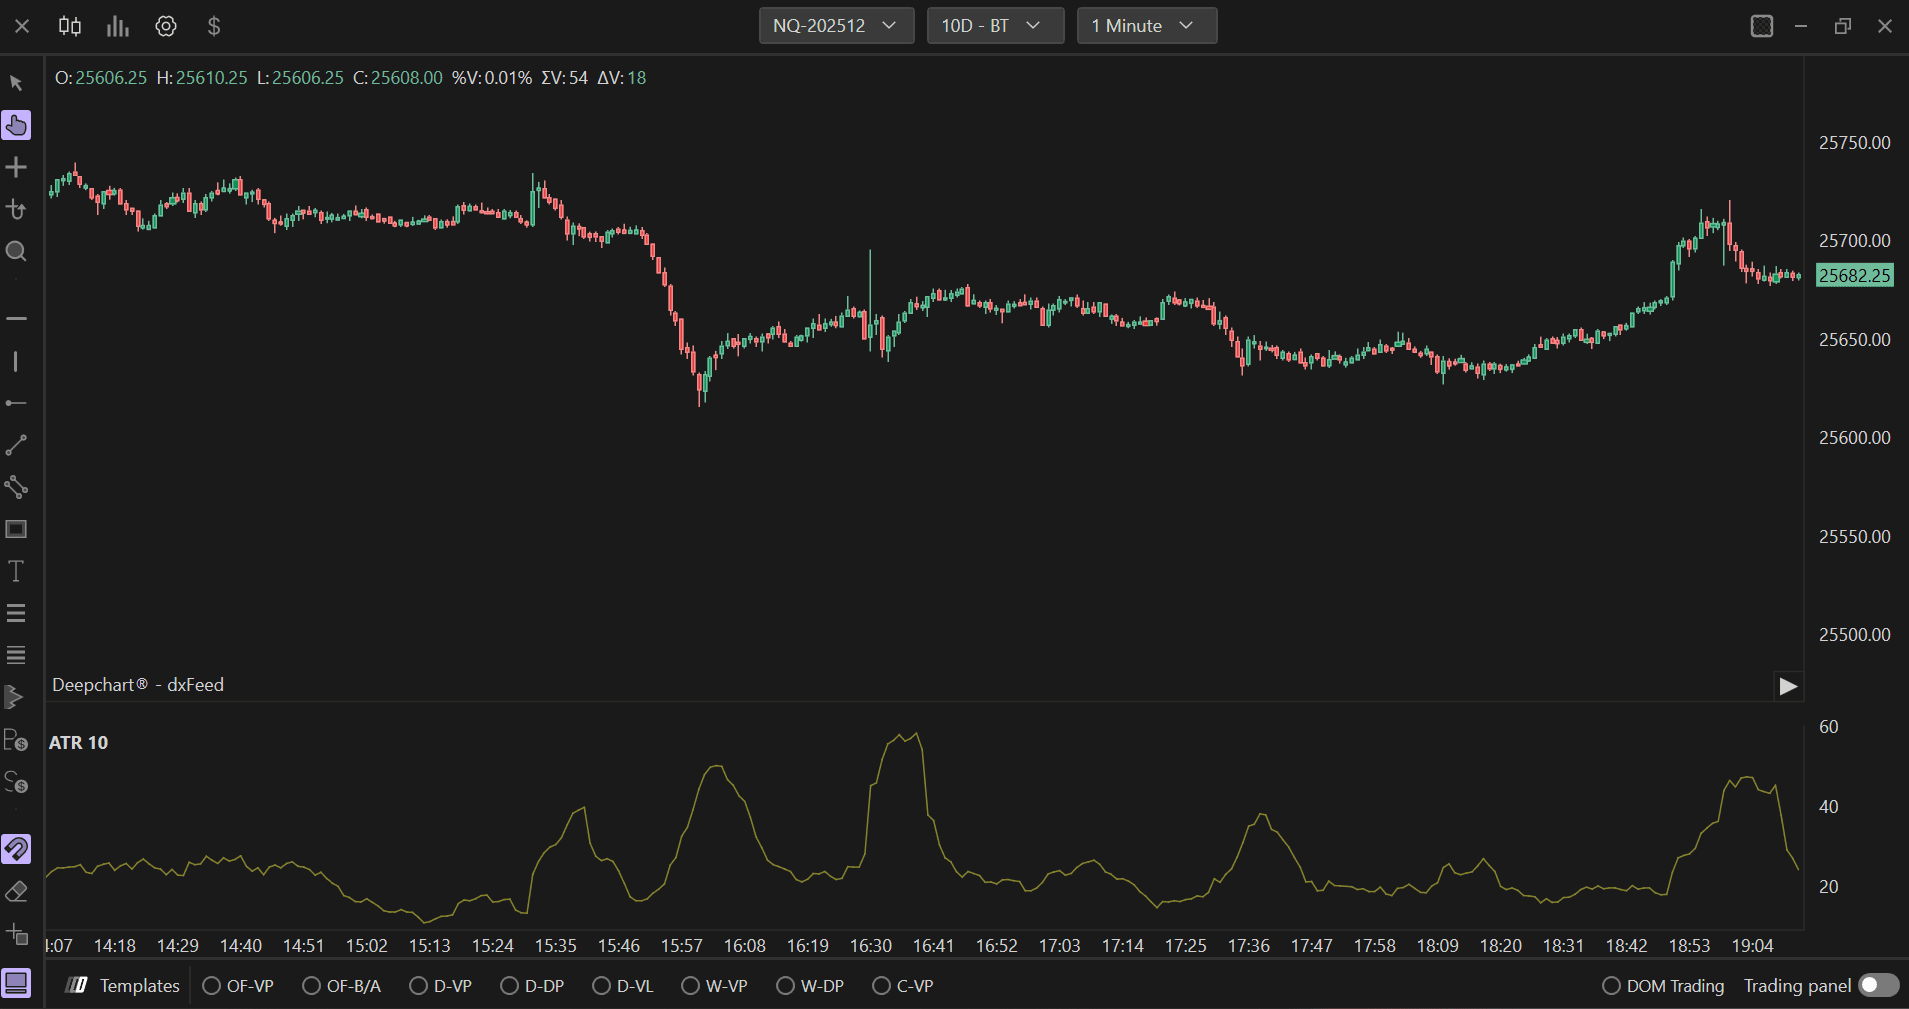
The ATR (Average True Range) is a technical analysis indicator developed by J. Welles Wilder in the 1970s to measure the volatility of an asset. The Average True Range indicator shows the degree of price change over a specific time frame. In other words, it shows the volatility of the asset.
Using Settings
Clicking on the indicator settings icon will open its configuration window, within which you can make several choices regarding the indicator's functionality.
Parameters
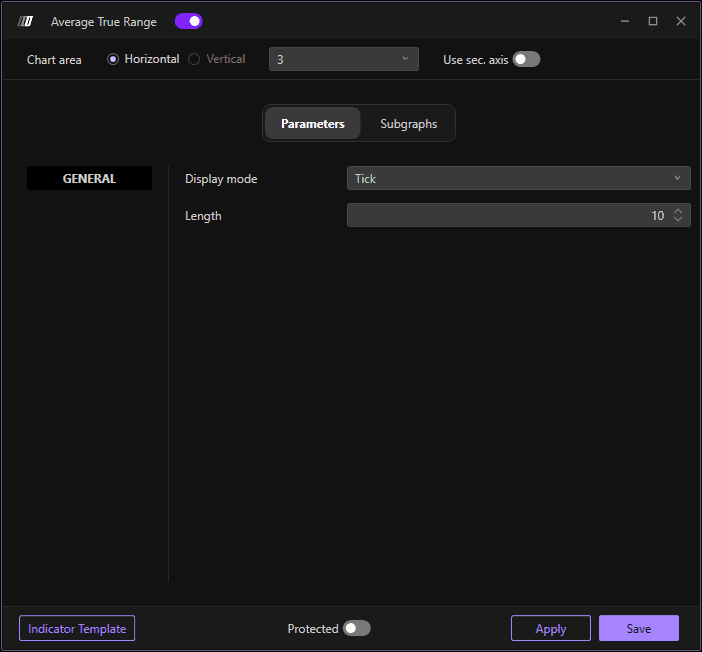
In the Parameters section, you can set the display mode and the periods of the ATR:
Display Mode: Choose between Tick or Periods
Periods: Set the number of periods for ATR calculation
Indicator Model: Configure the indicator model settings
Subgraph

In the Series section you can set the colors and style of the ATR:
Color: Set the primary color of the ATR line
Secondary Color: Set an optional secondary color
Subgraph Style: Choose the display style (Line or Broker line)
Line Style: Define the line style (Solid, Dashed, Dotted, etc.)
Line Width: Define the thickness of the line