Indicators
Updated:
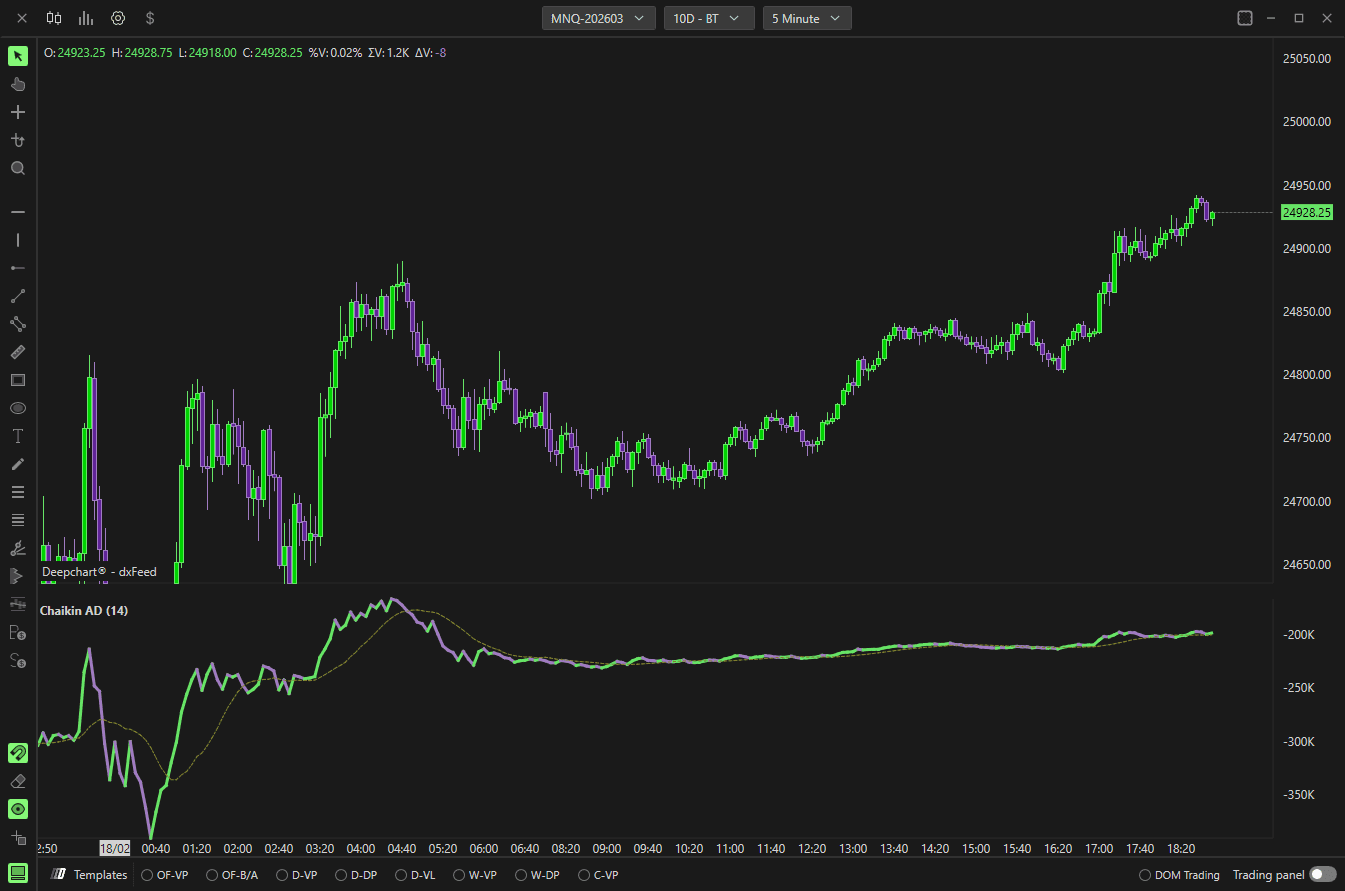
The Chaikin Accumulation/Distribution (AD) indicator measures buying and selling pressure by combining price and volume.
It helps identify:
Accumulation (buying pressure)
Distribution (selling pressure)
Trend confirmation
Divergences between price and volume
Settings
Parameters
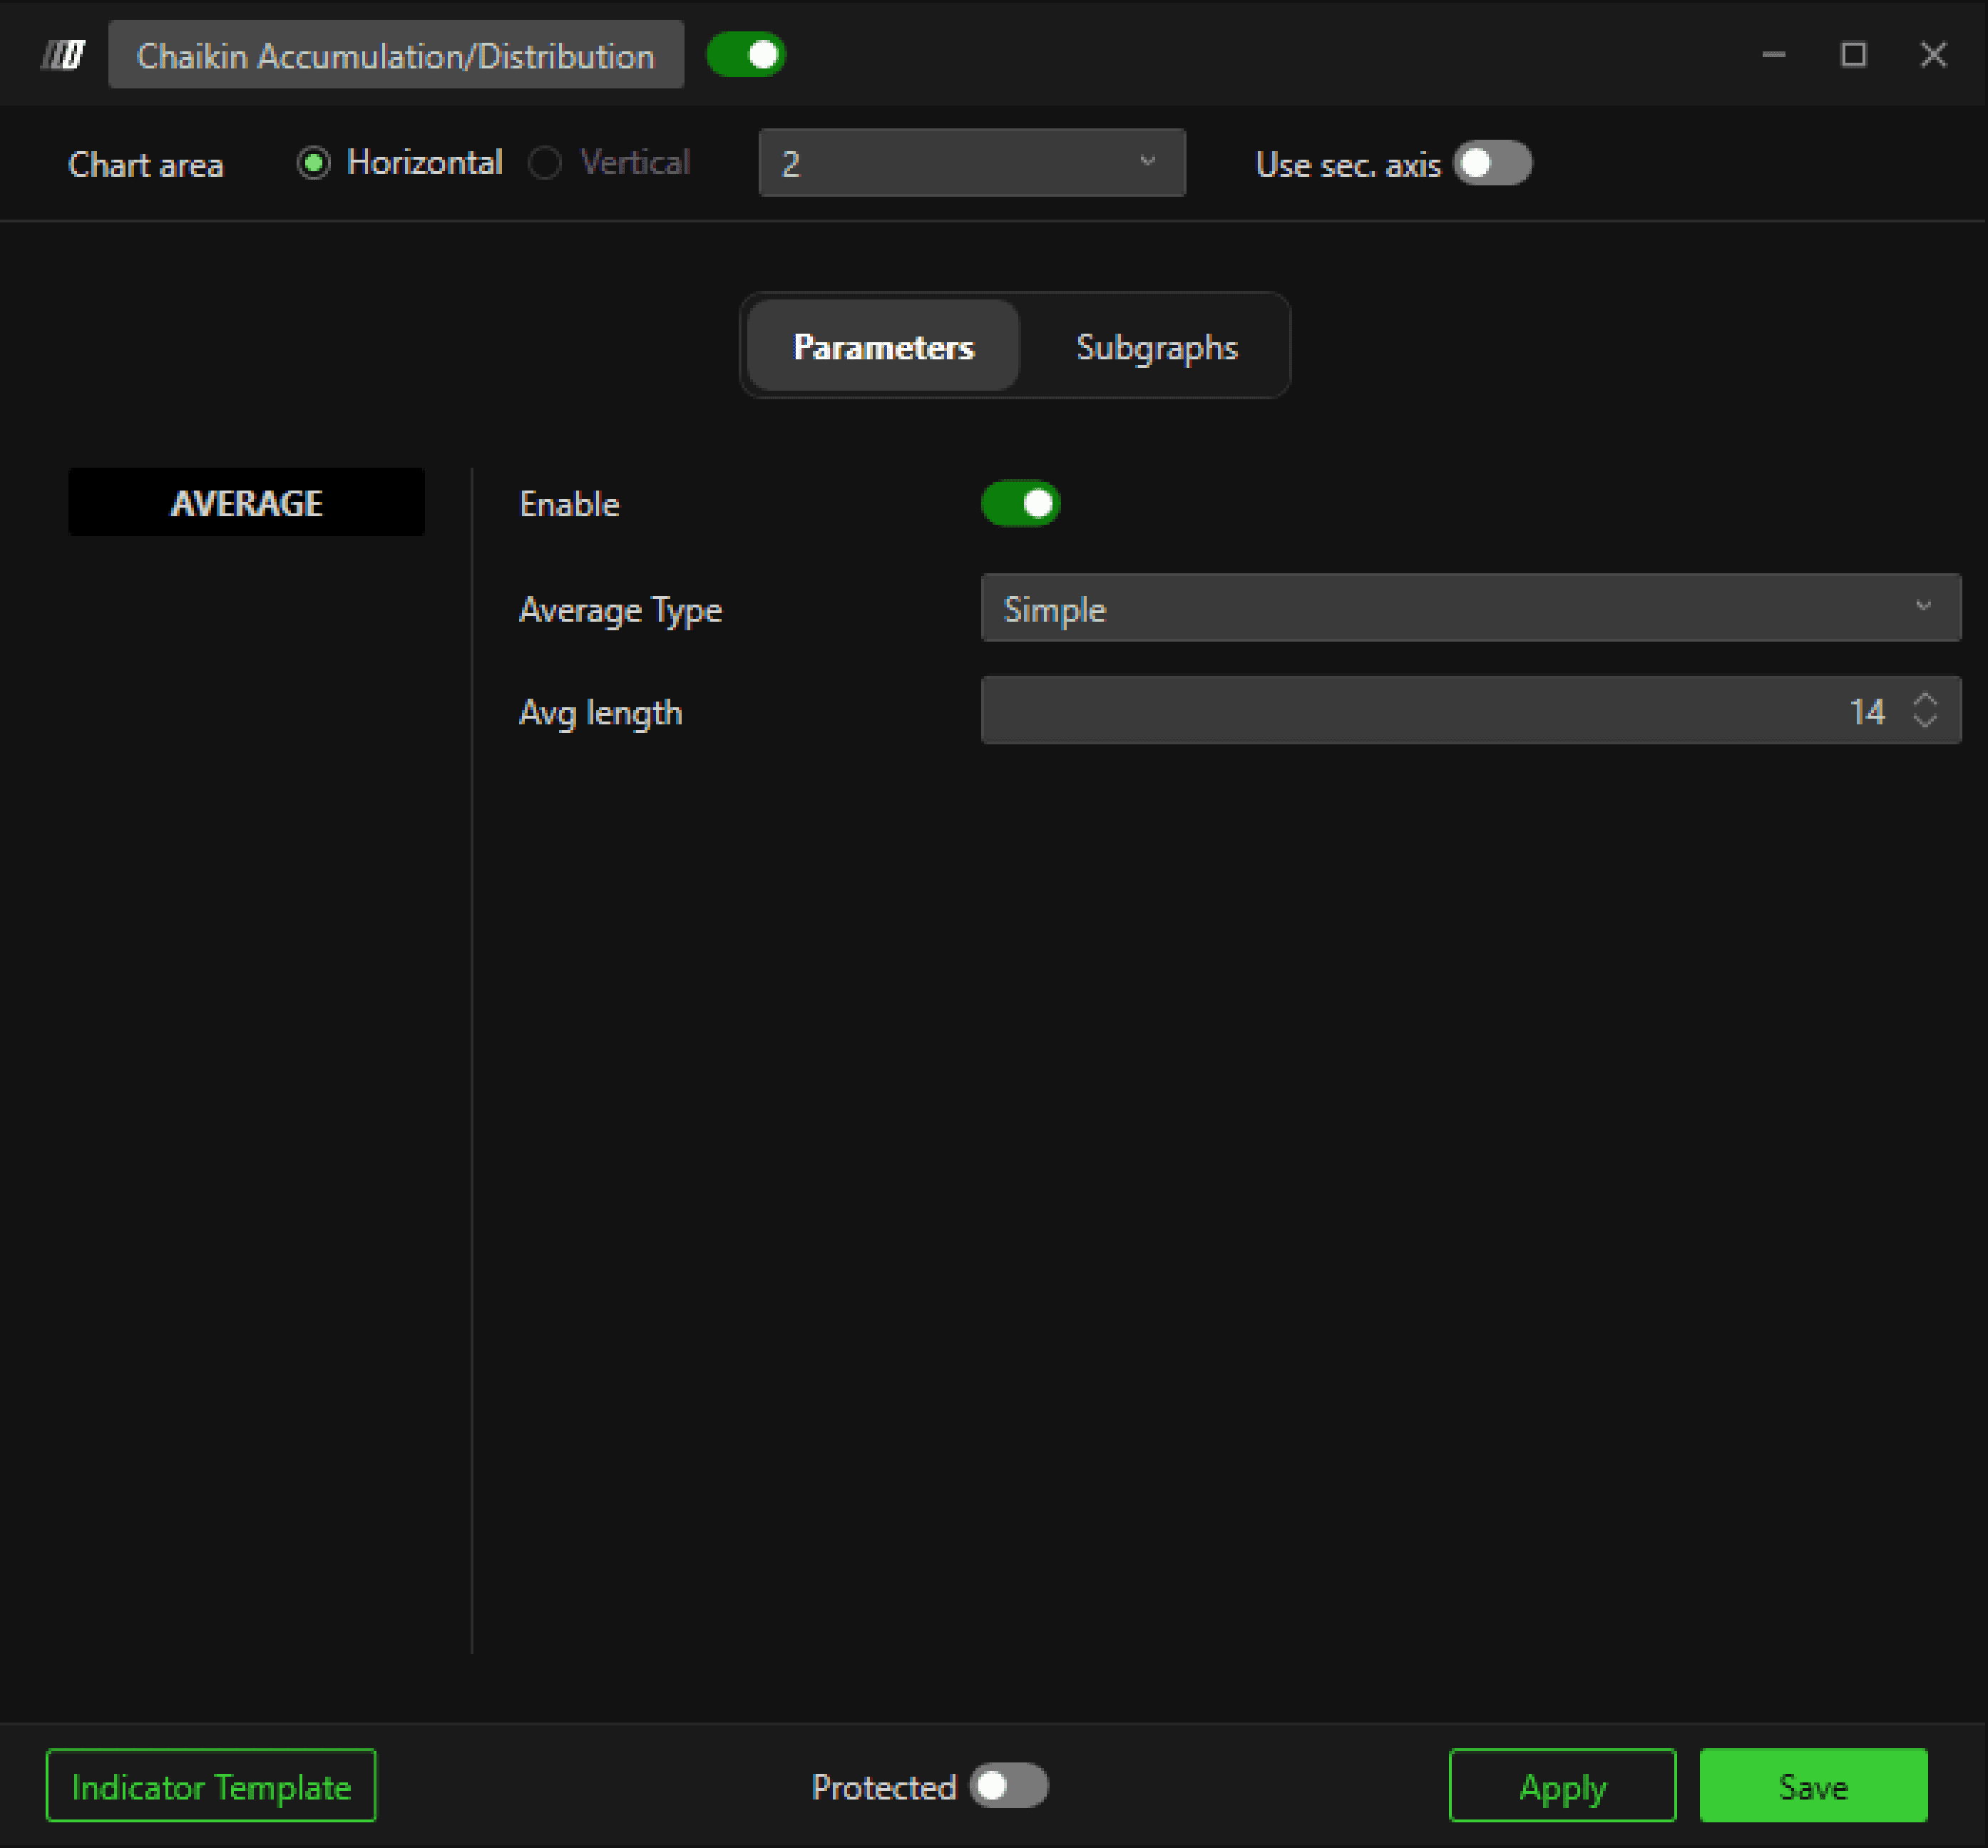
Average
Enable
Turns the signal average line on or off.
Average Type
Select moving average type:
Simple
Exponential
Triangular
Weighted
Avg Length
Number of periods used for smoothing.
Subgraphs
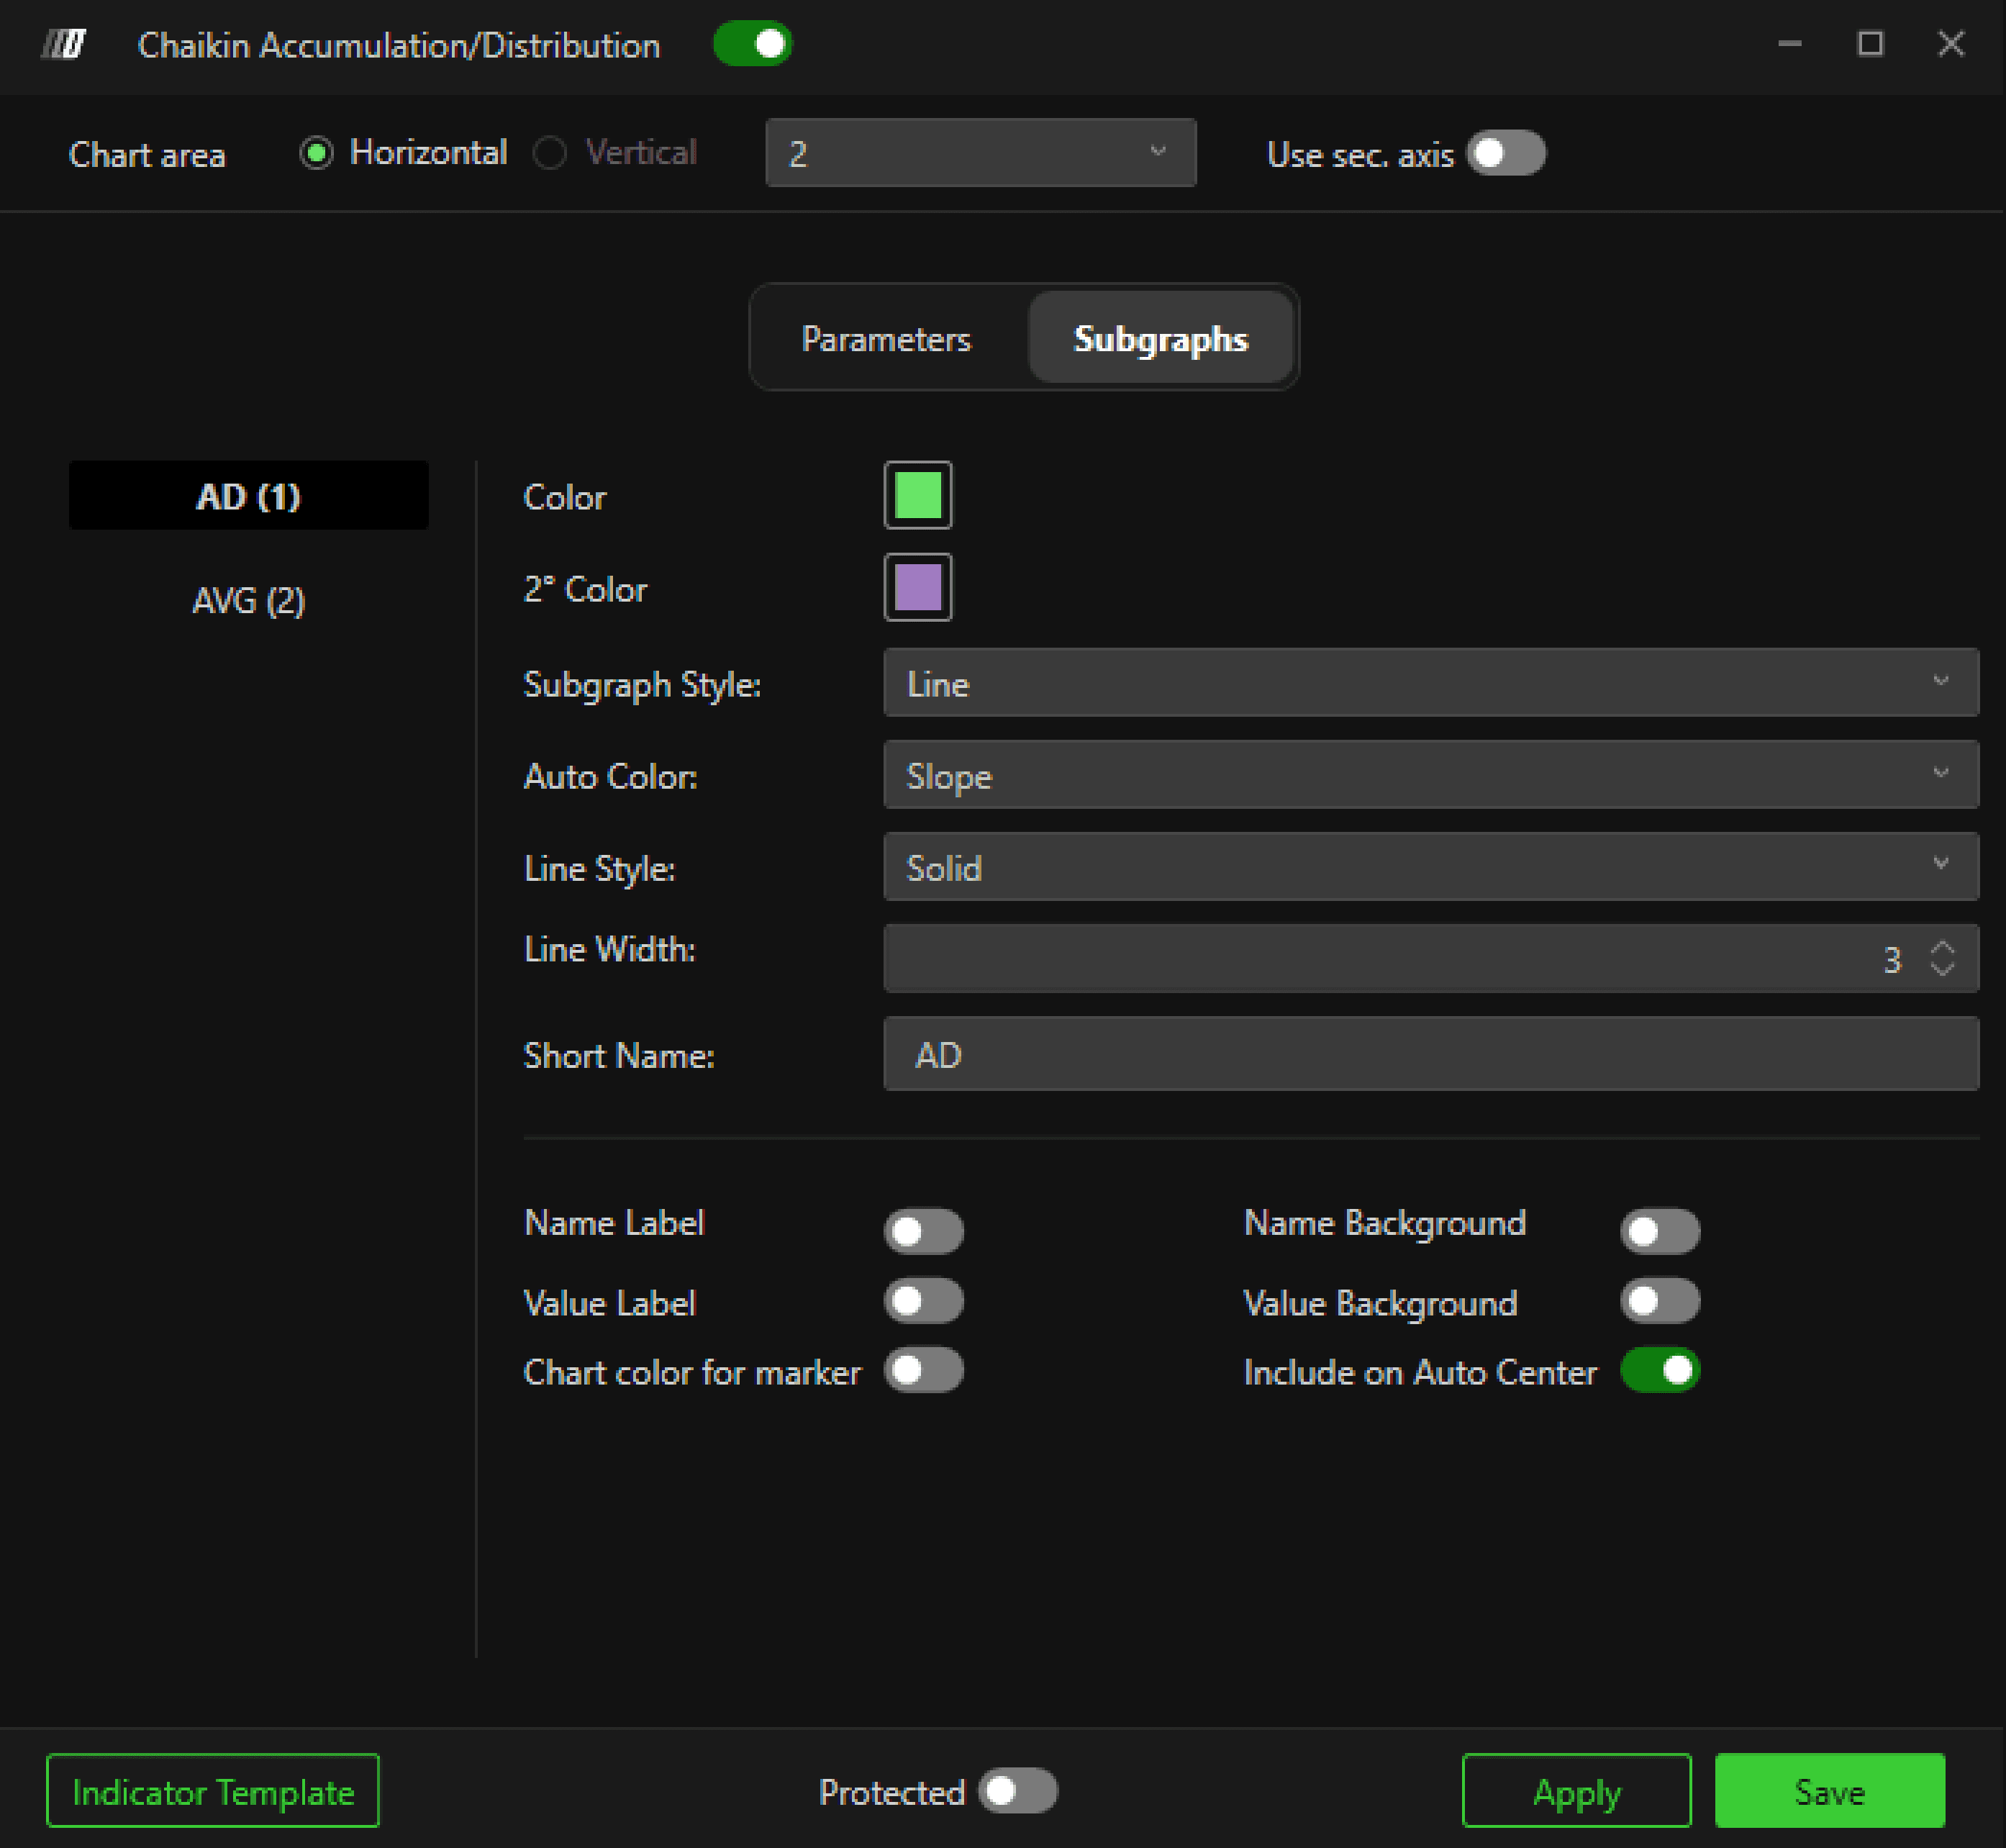
AD
Color / 2° Color – Line colors
Subgraph Style – Line / Hidden
Auto Color – None / Slope / +/-
Line Style – Solid (default)
Line Width – Thickness
Short Name – Custom label
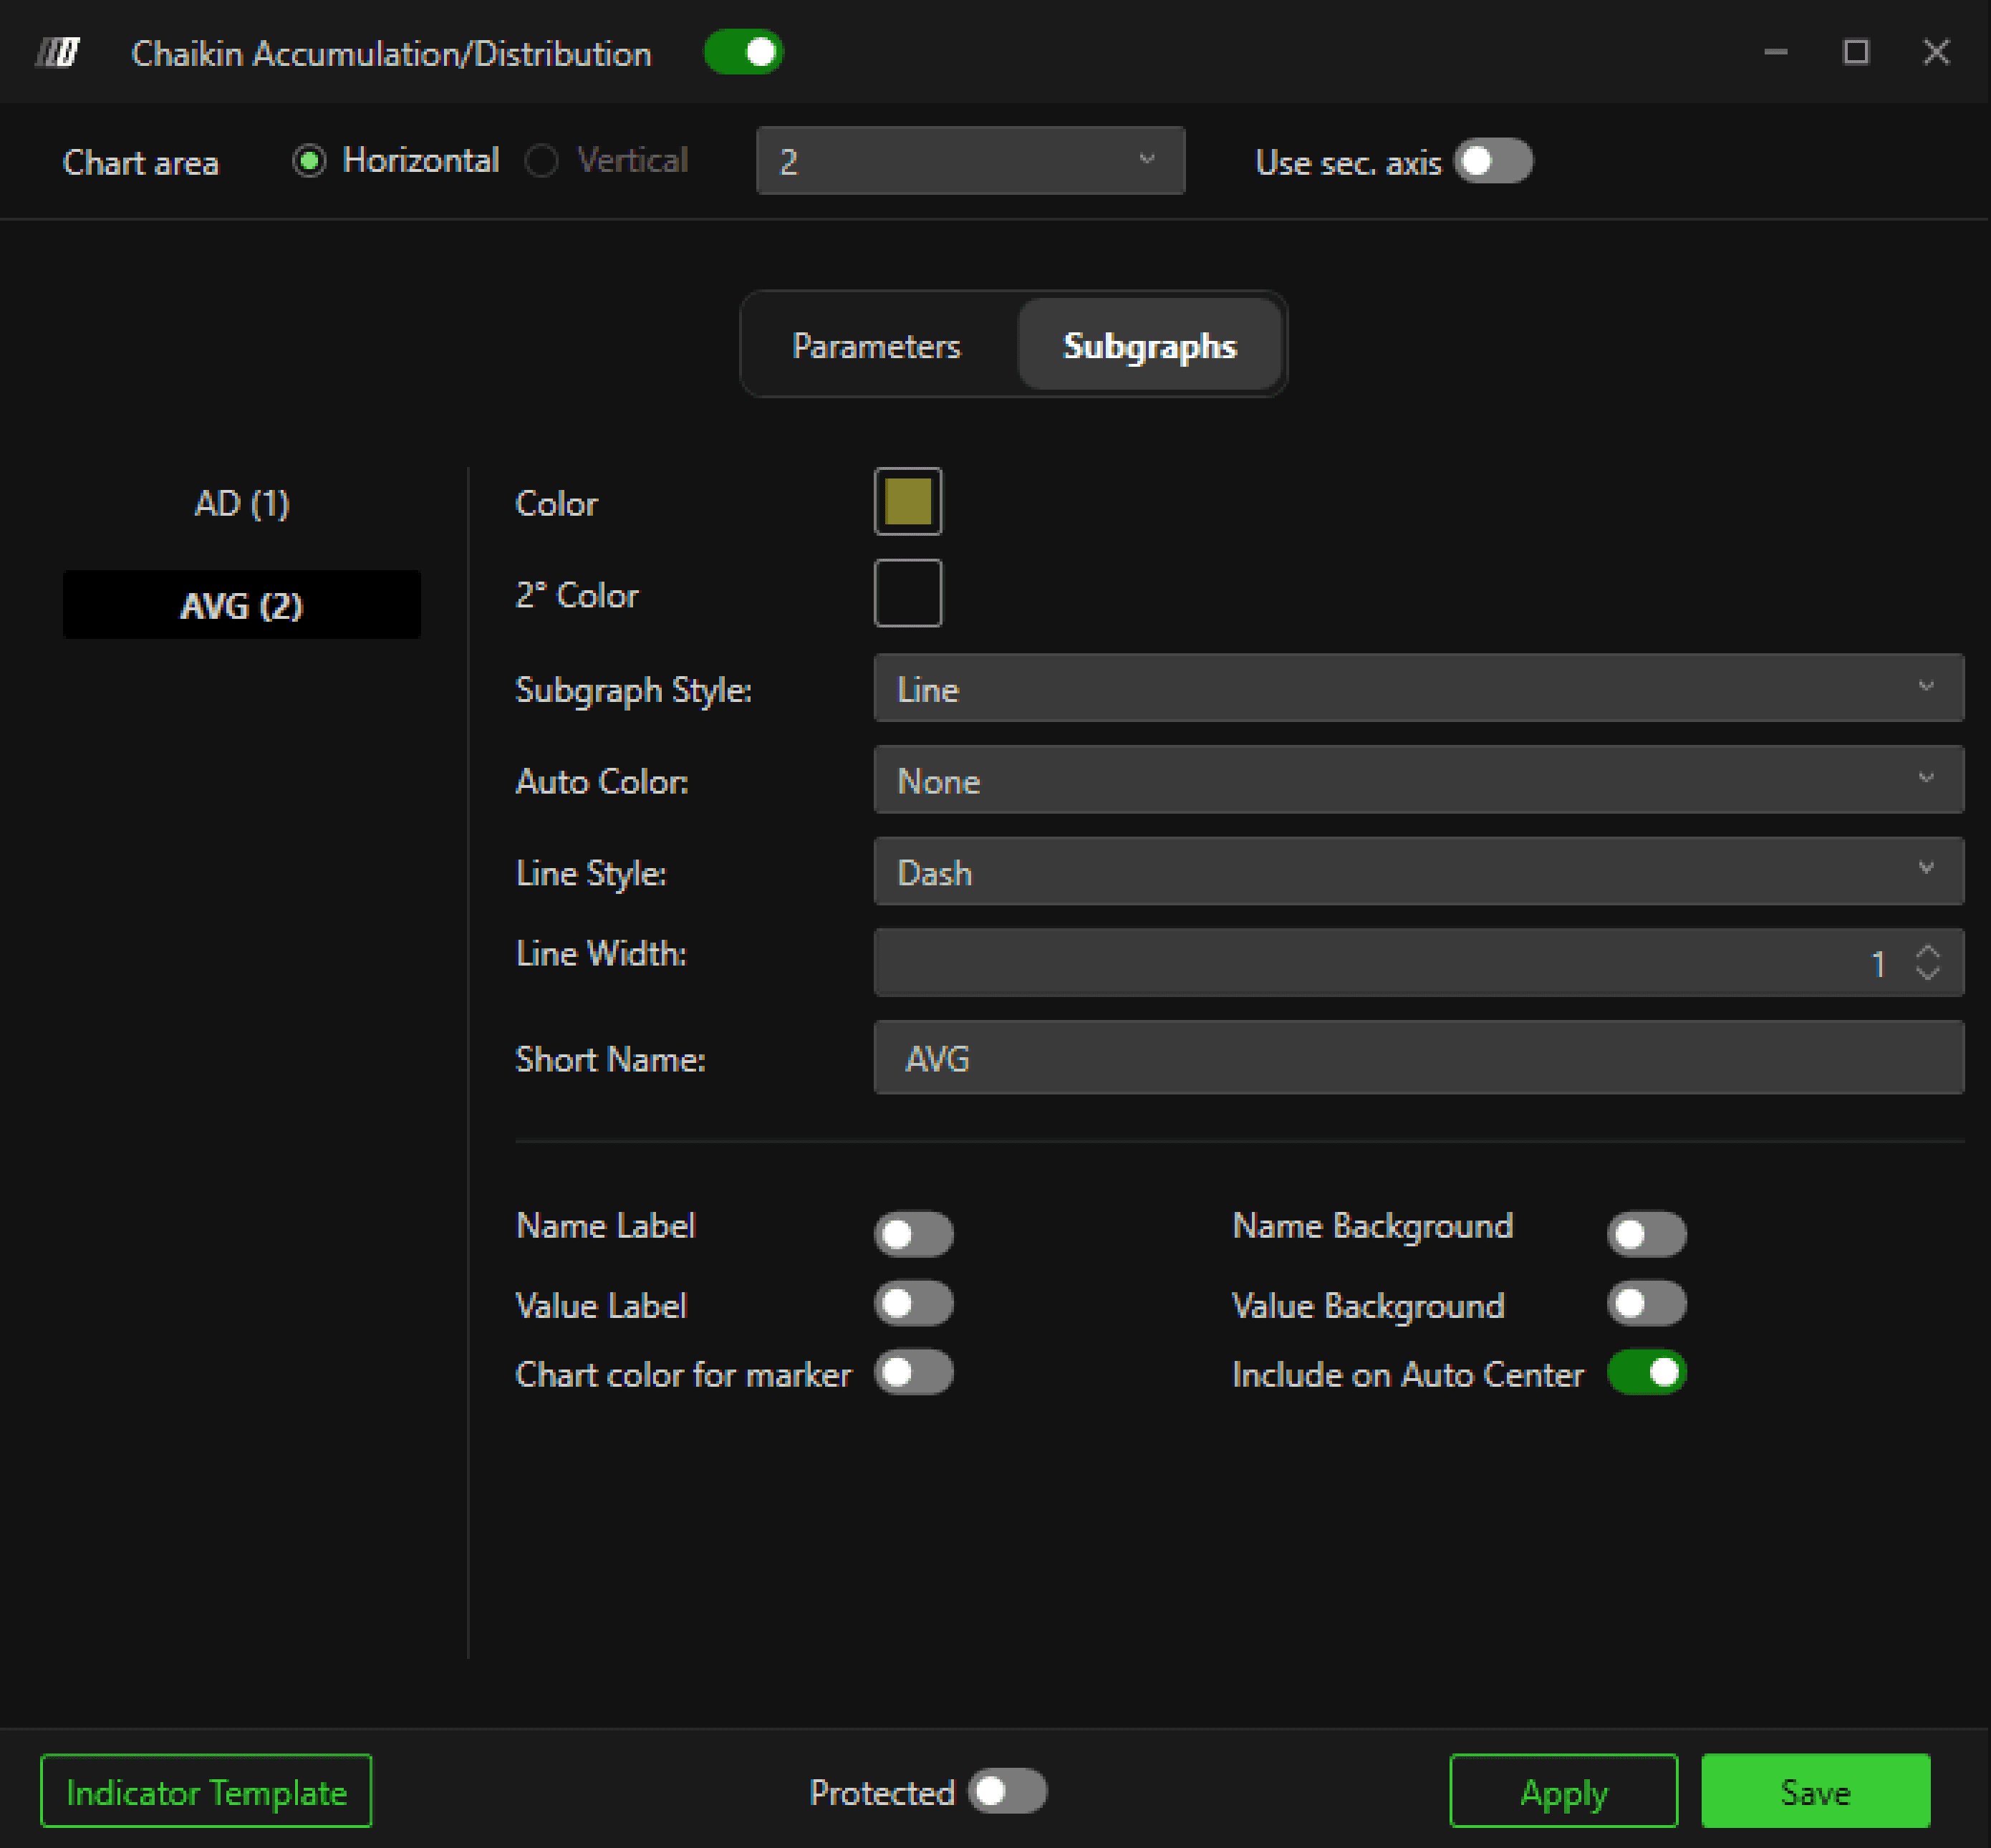
AVG
Configurable as a line
Custom color, style, and width
Optional smoothing of AD values
Additional display options:
Name Label
Value Label
Name/Value Background
Include on Auto Center
How It Works
The AD line calculates cumulative buying and selling pressure using:
Price location within the candle
Volume
Rising AD → Accumulation (buying pressure)
Falling AD → Distribution (selling pressure)