Indicators
Updated:
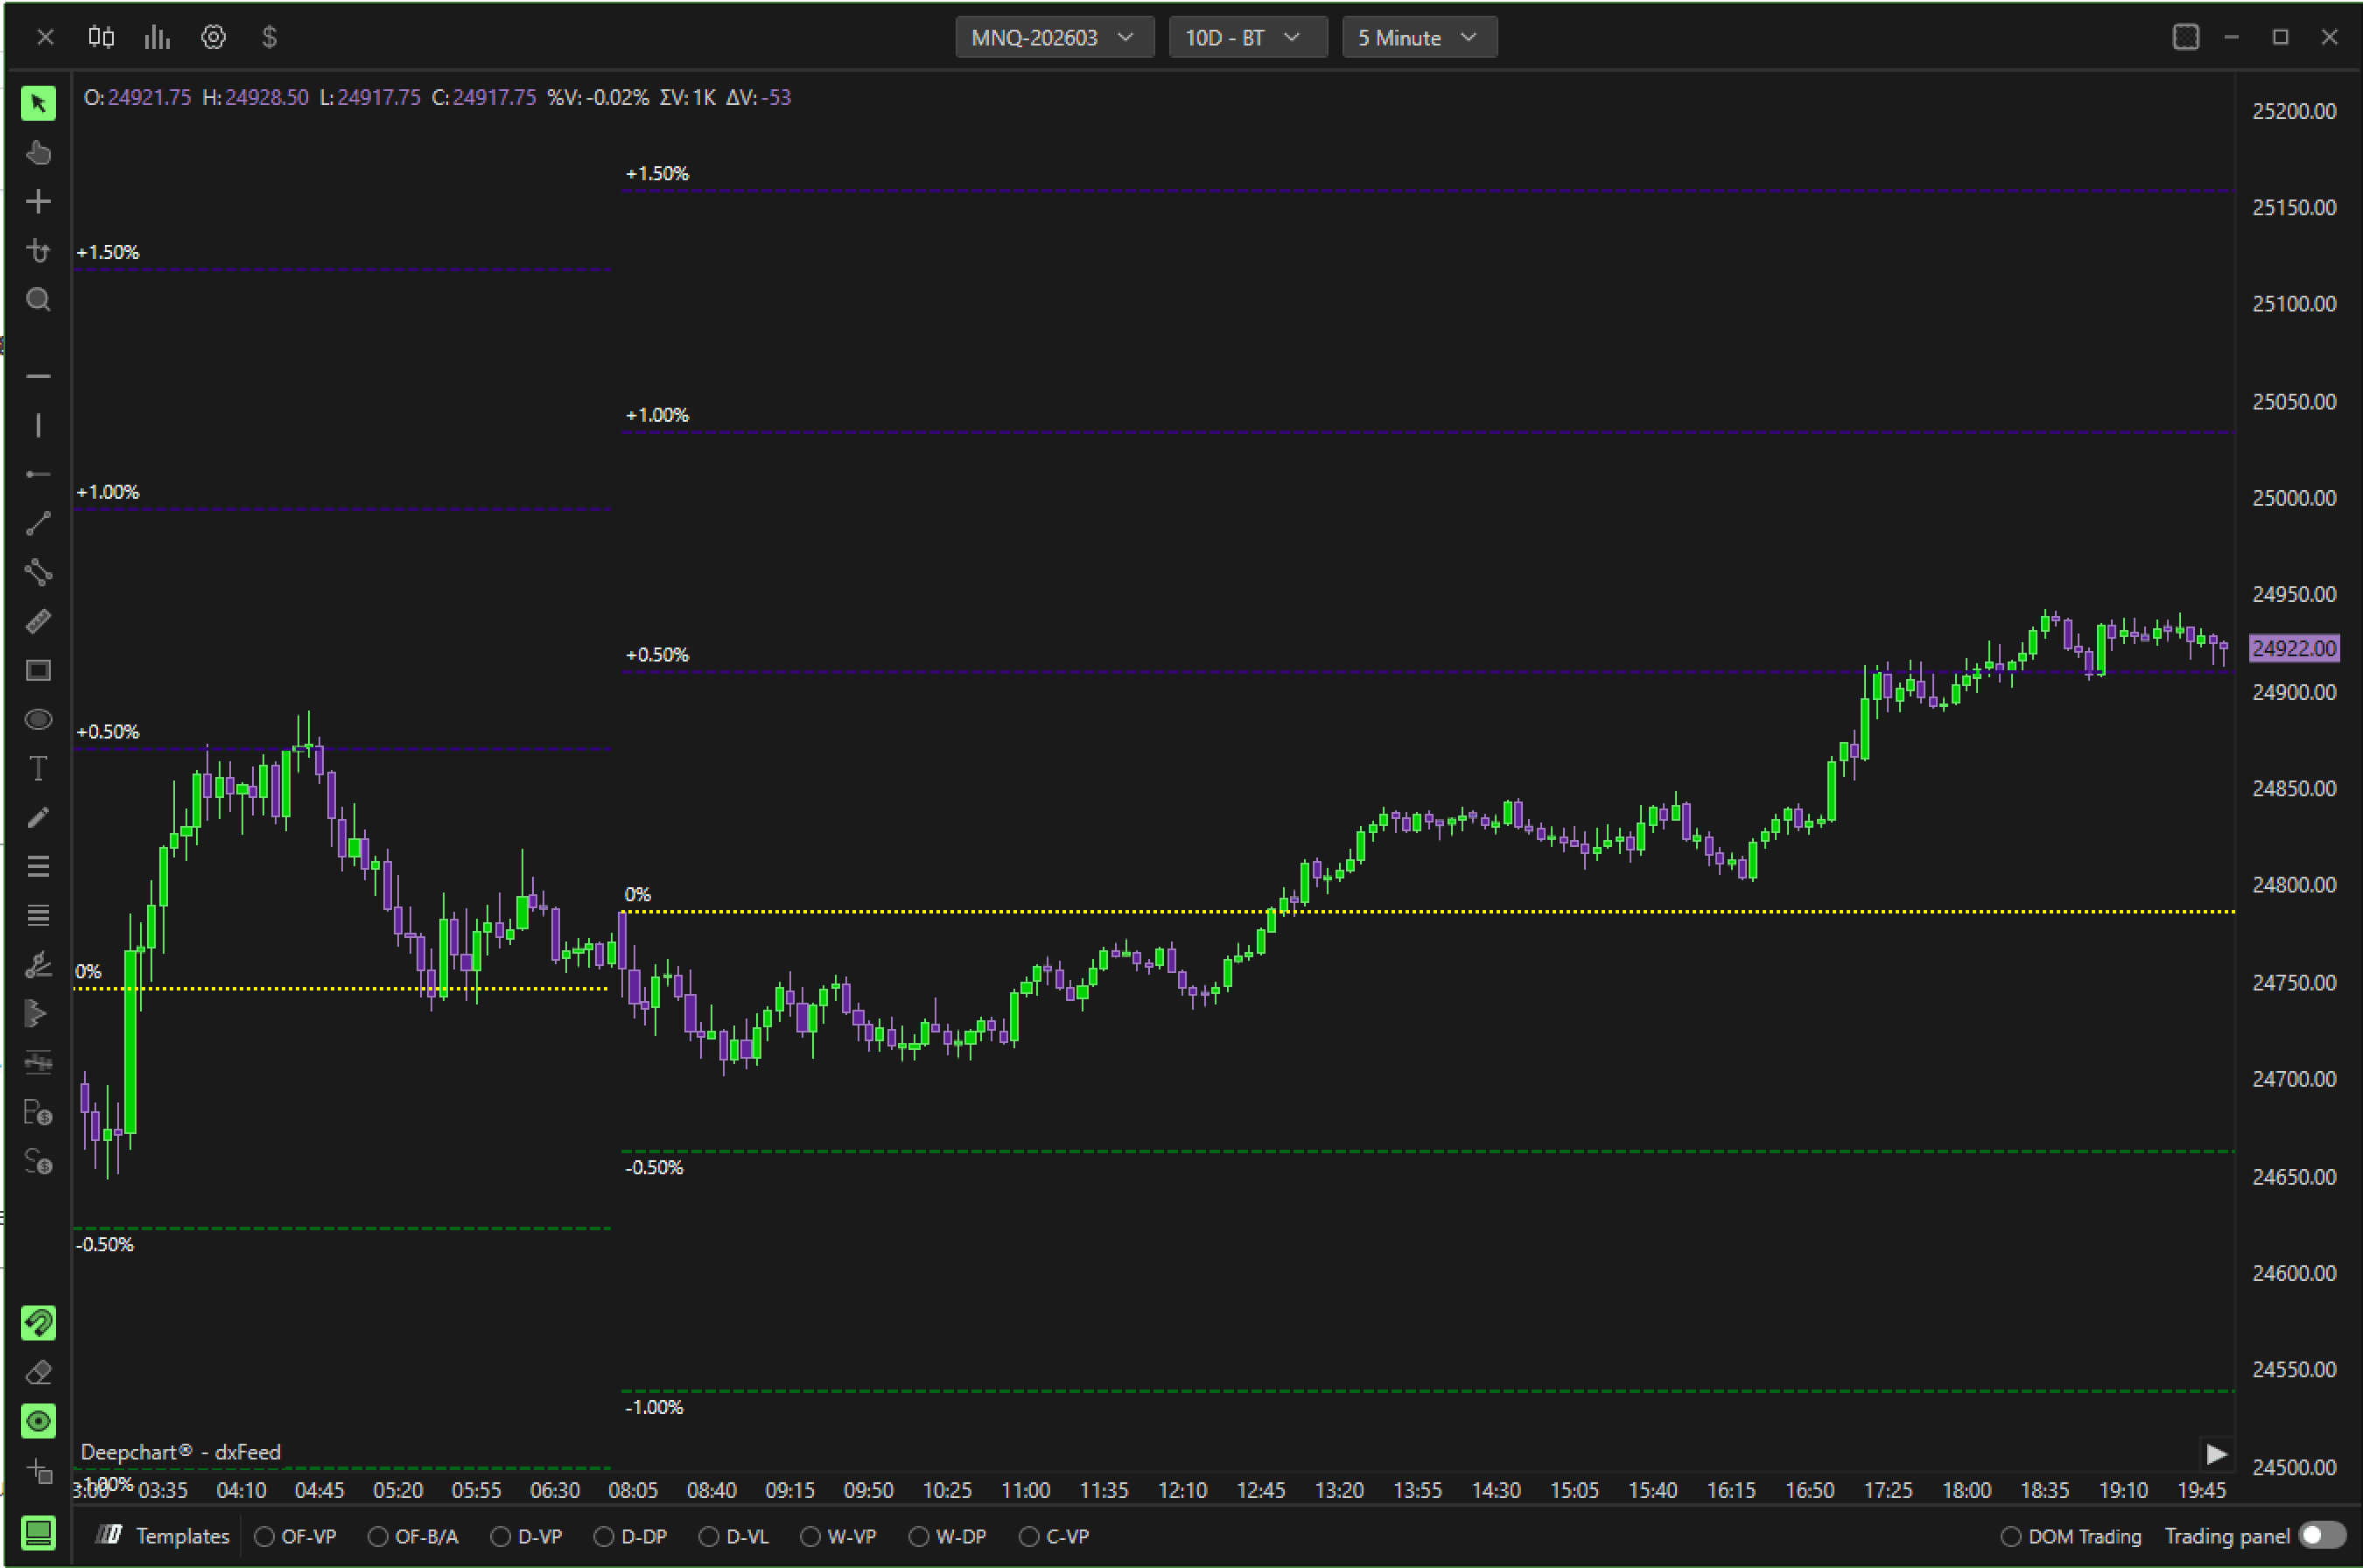
Price Movement Levels plots structured percentage or step-based levels above and below a reference price.
It helps traders:
Identify intraday expansion levels
Visualize support and resistance zones
Track percentage-based price movement
Define structured reaction areas
Settings
Chart Area
Horizontal – Draws levels on the main price chart.
Vertical – Displays vertically (if supported).
Panel selector – Chooses the panel where levels appear.
General
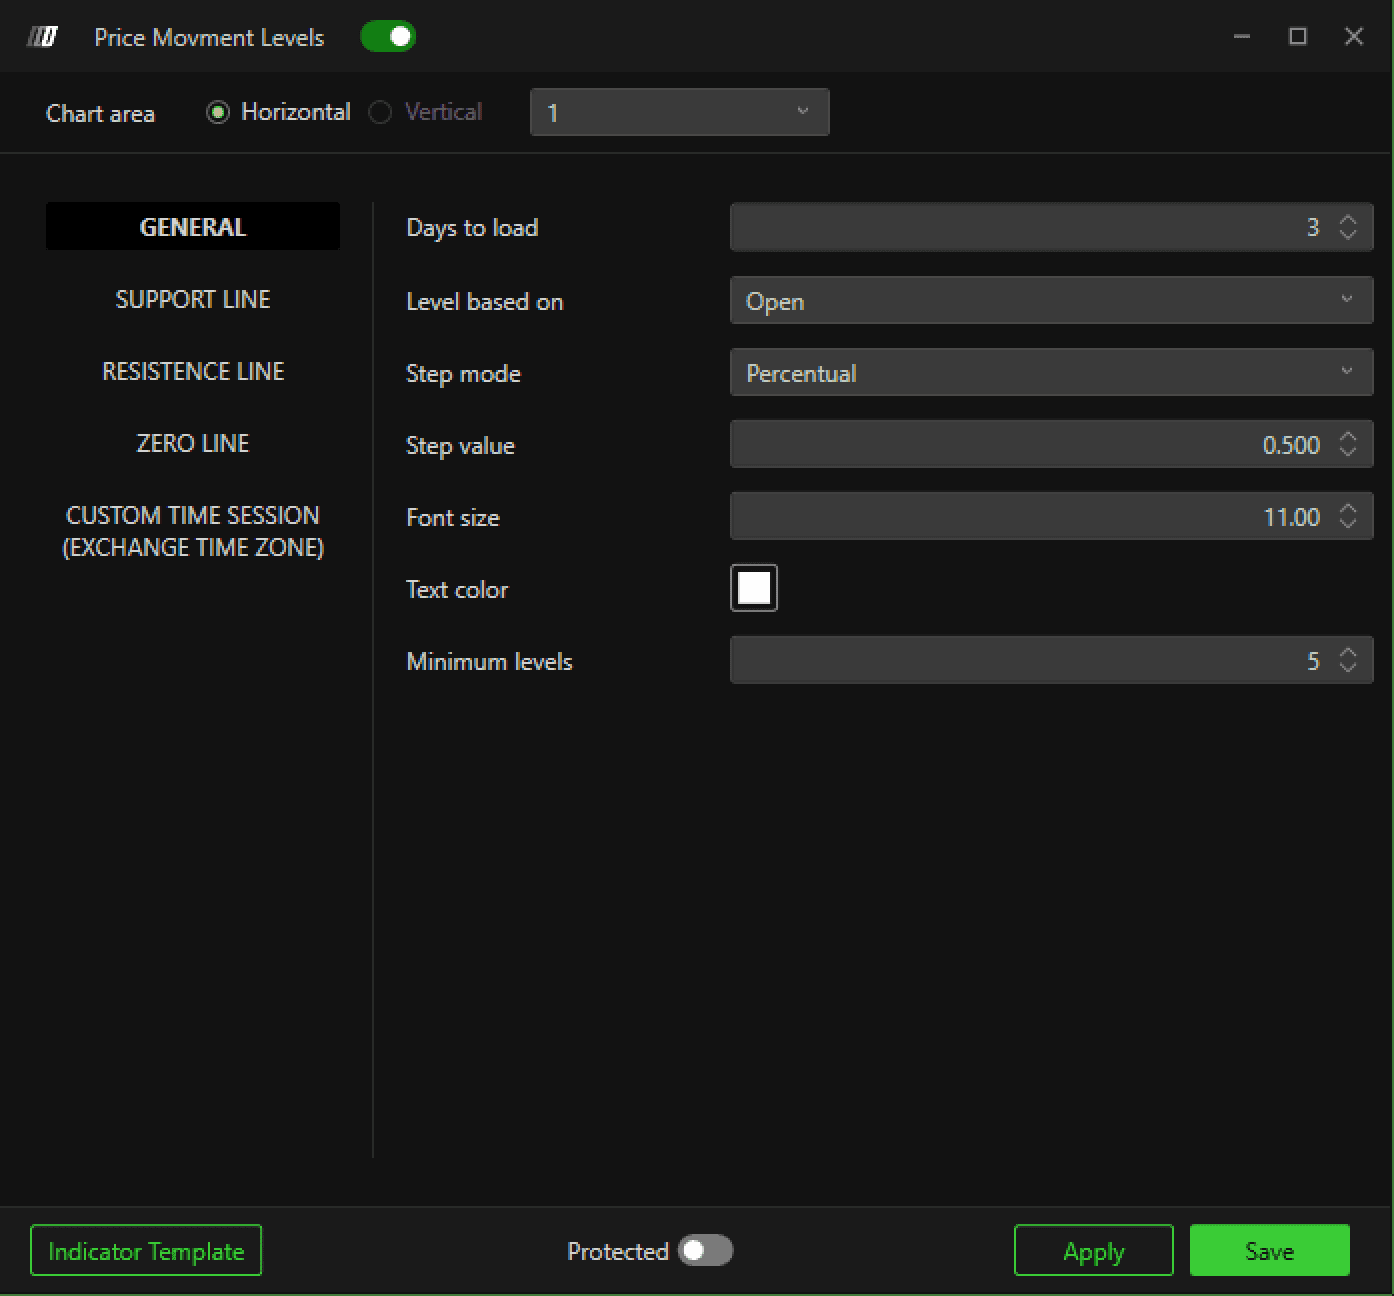
Days to load
Defines how many past sessions are used to calculate and display levels.
Level based on
Selects the reference price used to calculate levels
(e.g., Open, Close, etc.).
Step mode
Determines how levels are spaced:
Percentual – Levels are spaced by percentage.
Other modes (if available) use fixed value steps.
Step value
Defines the spacing between each level (percentage or value depending on mode).
Font size
Controls size of the percentage labels.
Text color
Sets color of level labels.
Minimum levels
Defines the minimum number of levels plotted above and below the base.
Support Line
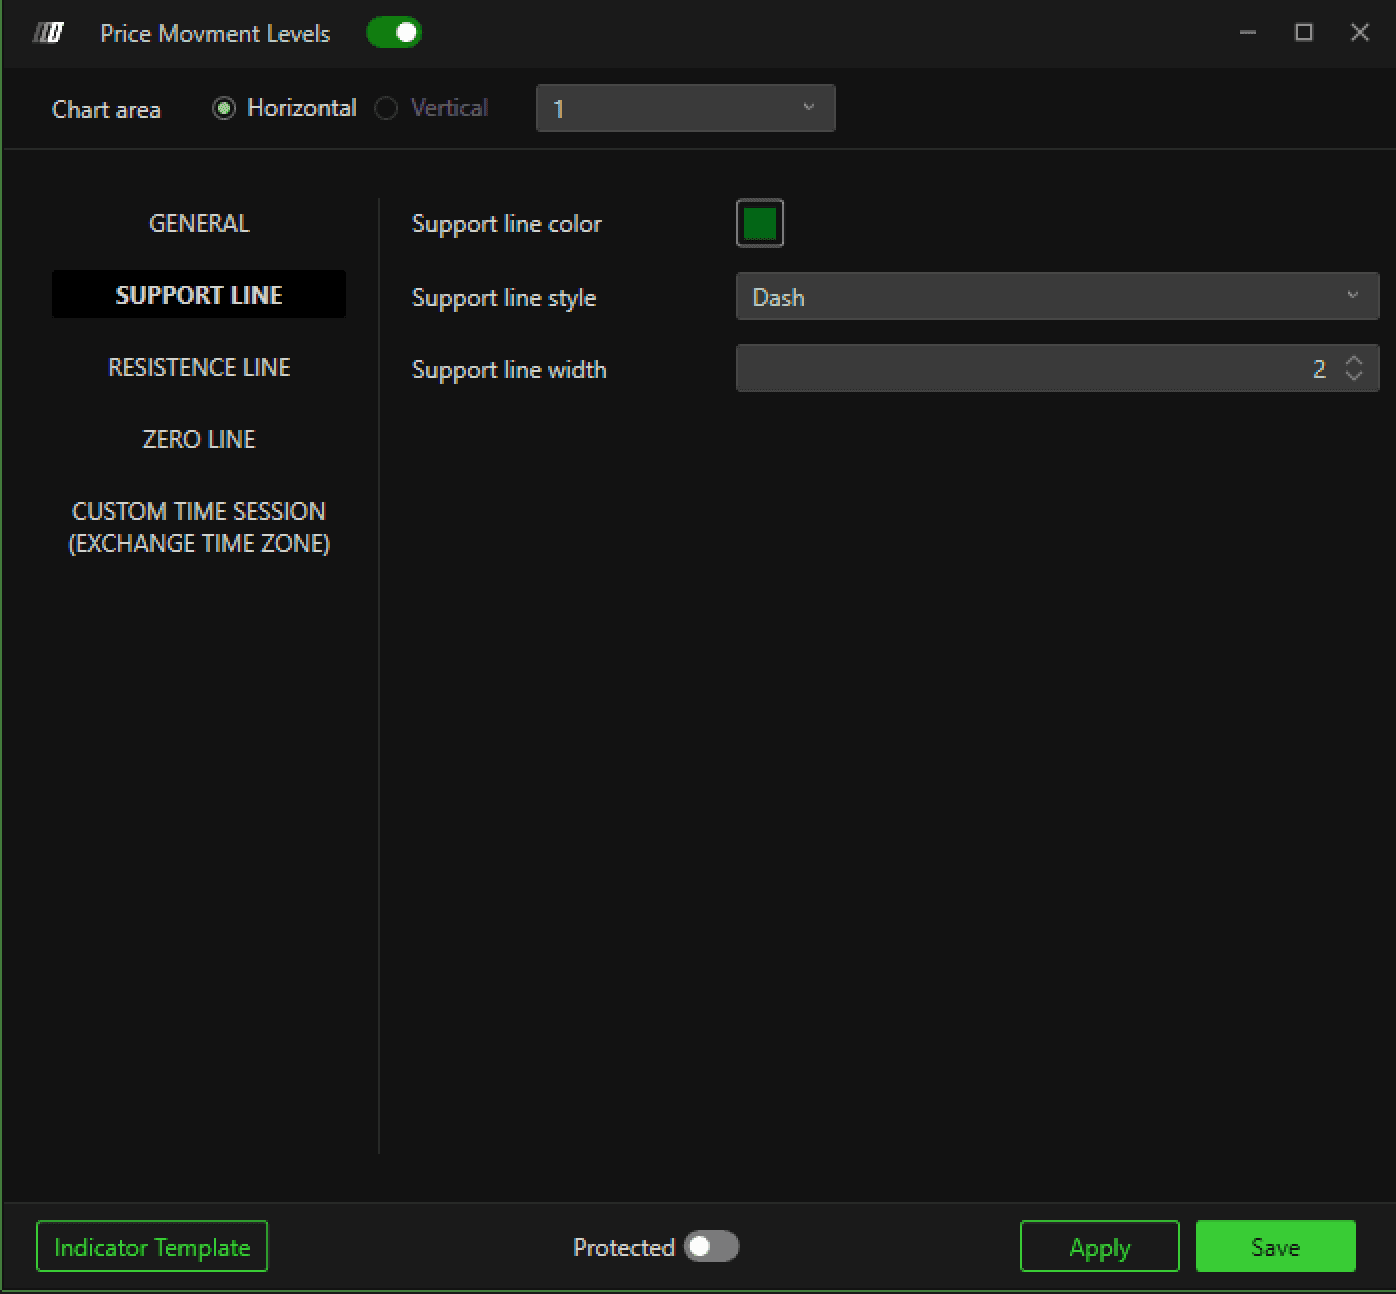
Support line color
Sets color of negative/downside levels.
Support line style
Defines visual style (solid, dash, etc.).
Support line width
Controls thickness of support lines.
Resistance Line
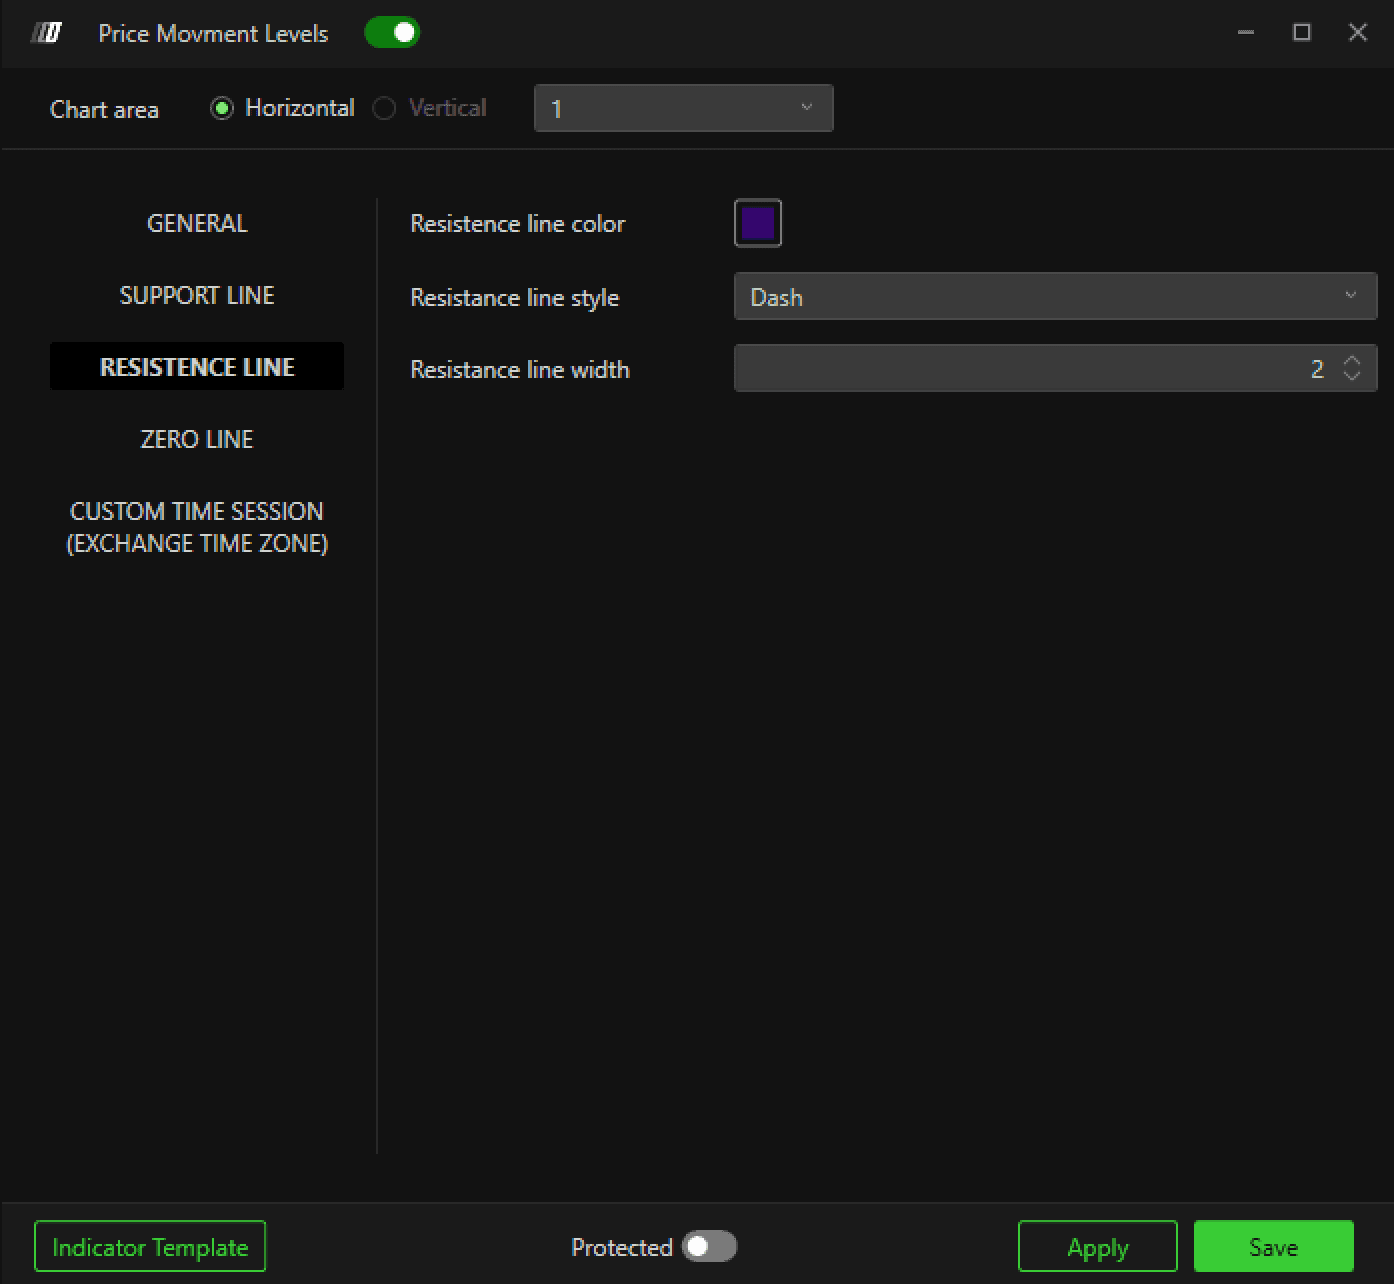
Resistance line color
Sets color of positive/upside levels.
Resistance line style
Defines visual style.
Resistance line width
Controls thickness of resistance lines.
Zero Line
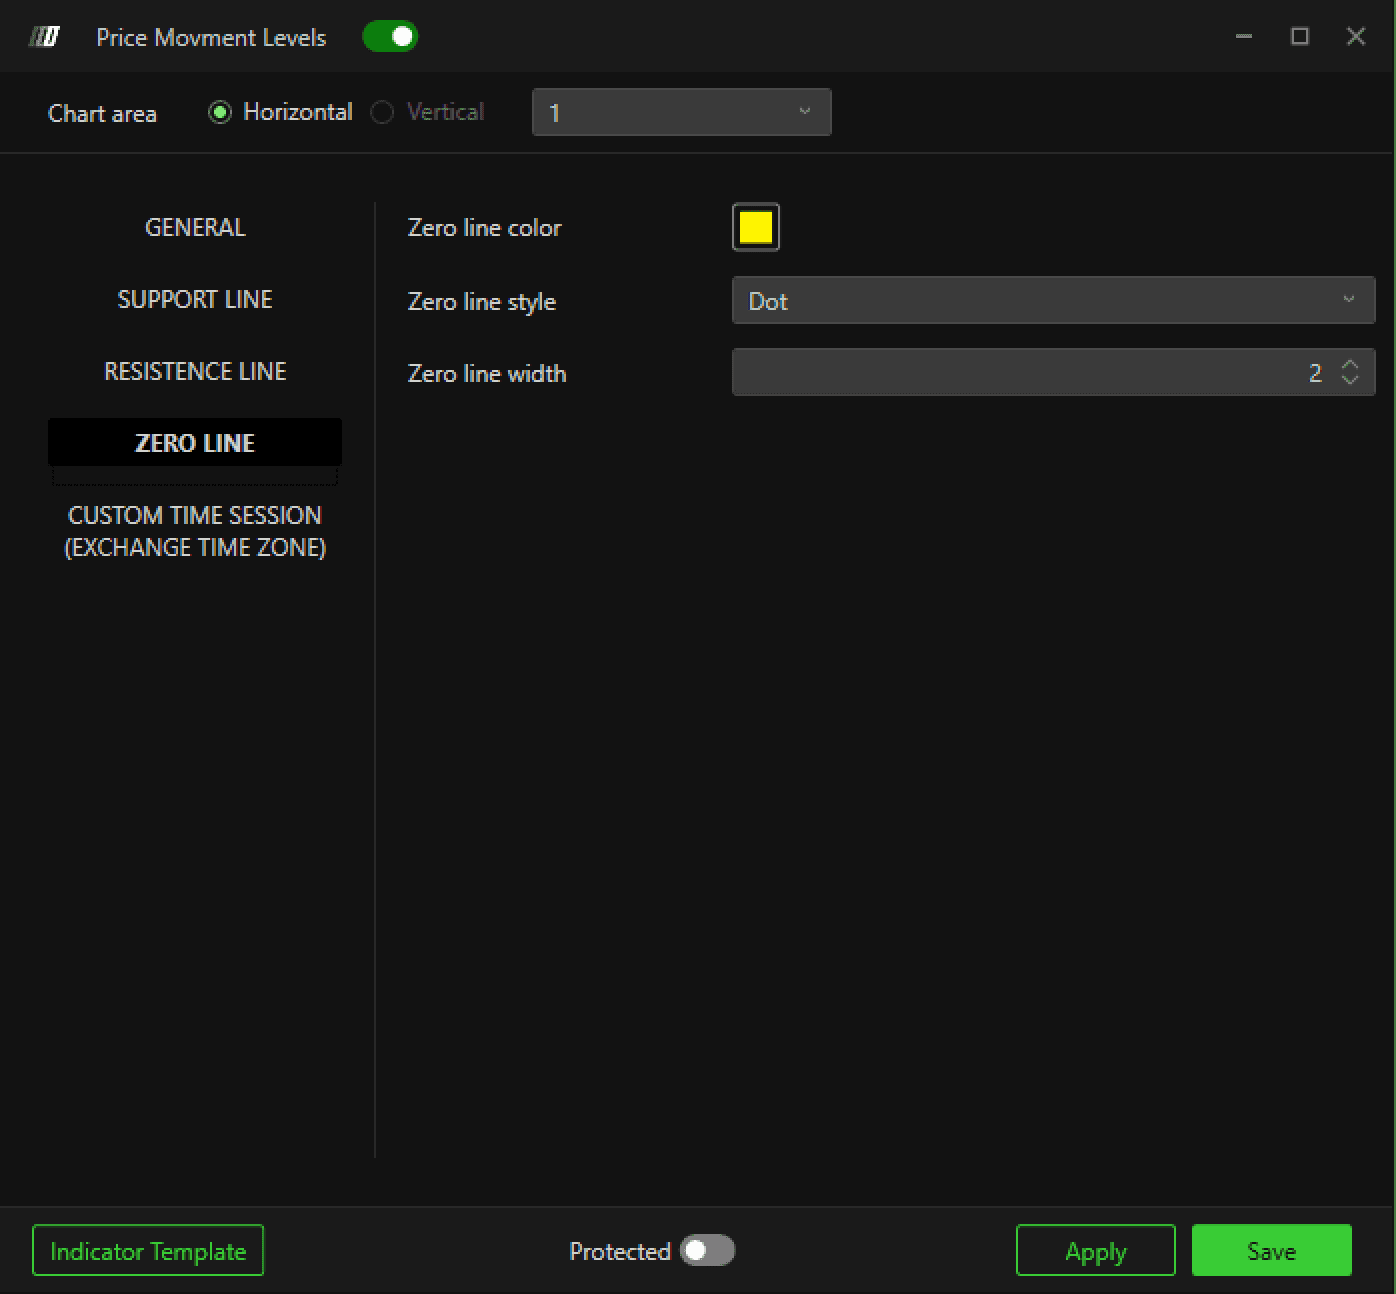
Zero line color
Sets color of the base reference level (0%).
Zero line style
Defines line appearance.
Zero line width
Controls thickness of the zero line.
Custom Time Session (Exchange Time Zone)
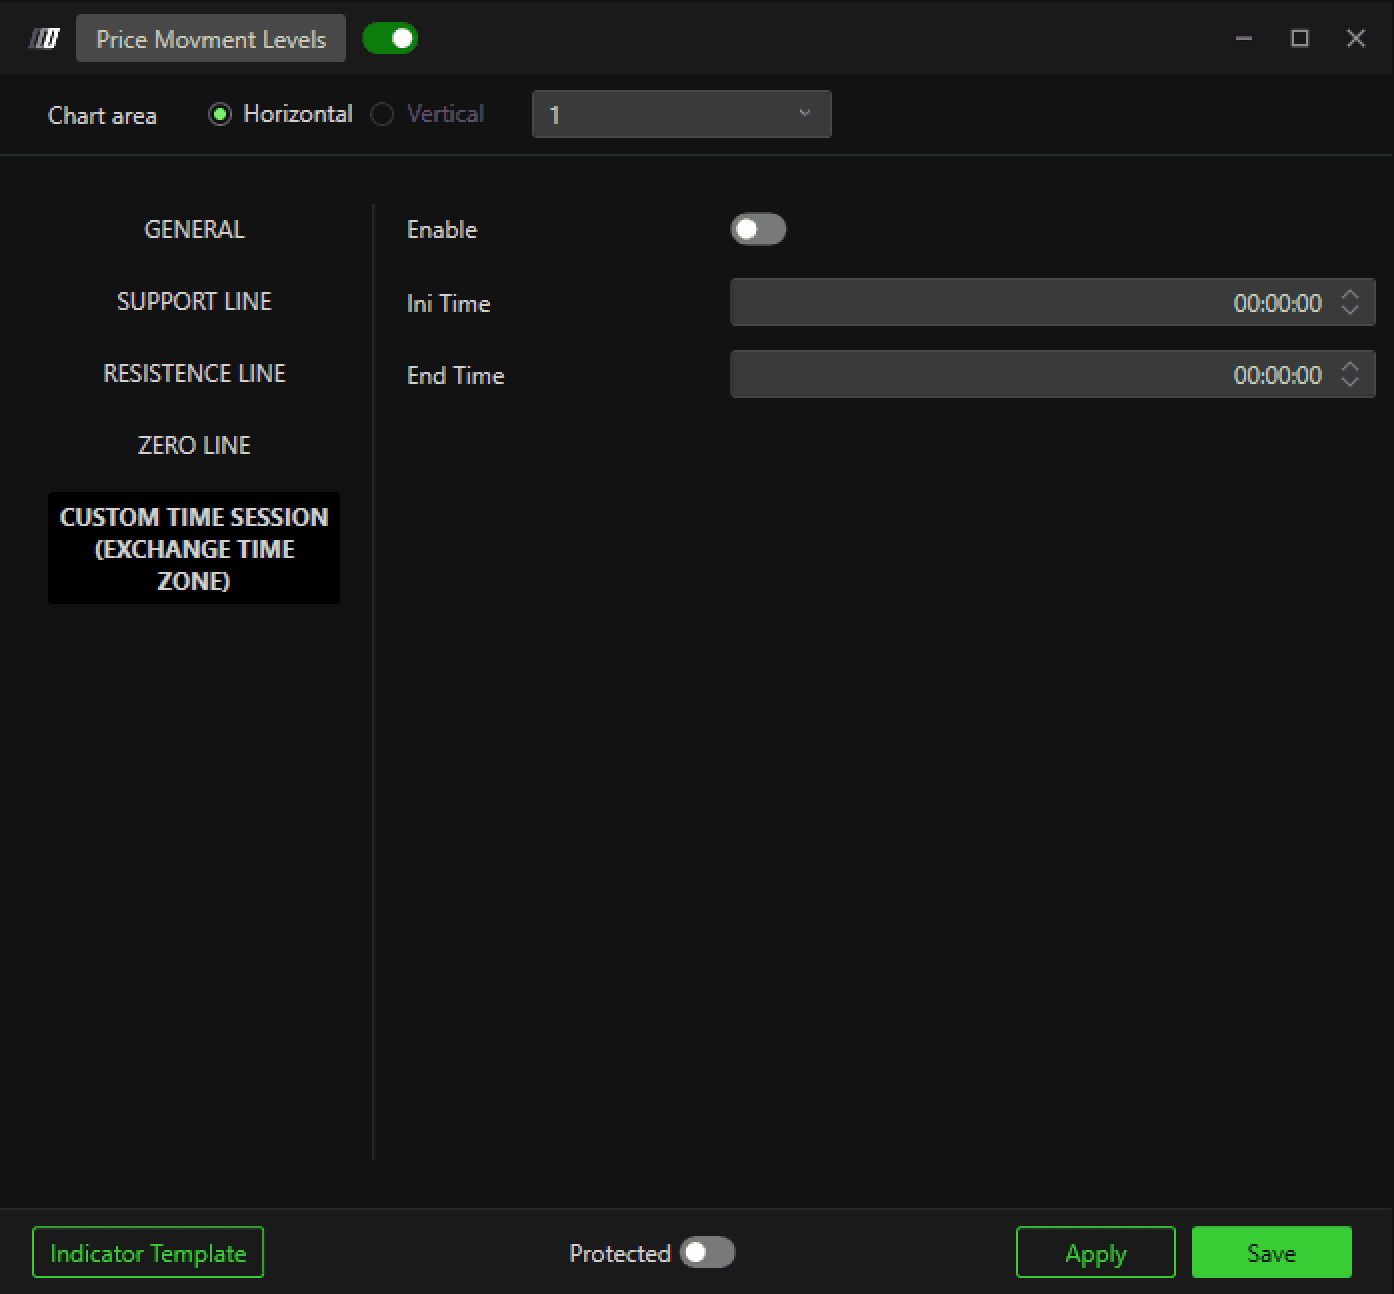
Enable
Limits level calculation to a specific session window.
Ini Time
Defines session start time (exchange timezone).
End Time
Defines session end time.
How It Works
A base price is selected (e.g., session open).
Levels are calculated using defined step spacing.
Positive levels plot as resistance.
Negative levels plot as support.
Zero line marks the reference anchor.