Indicators
Updated:
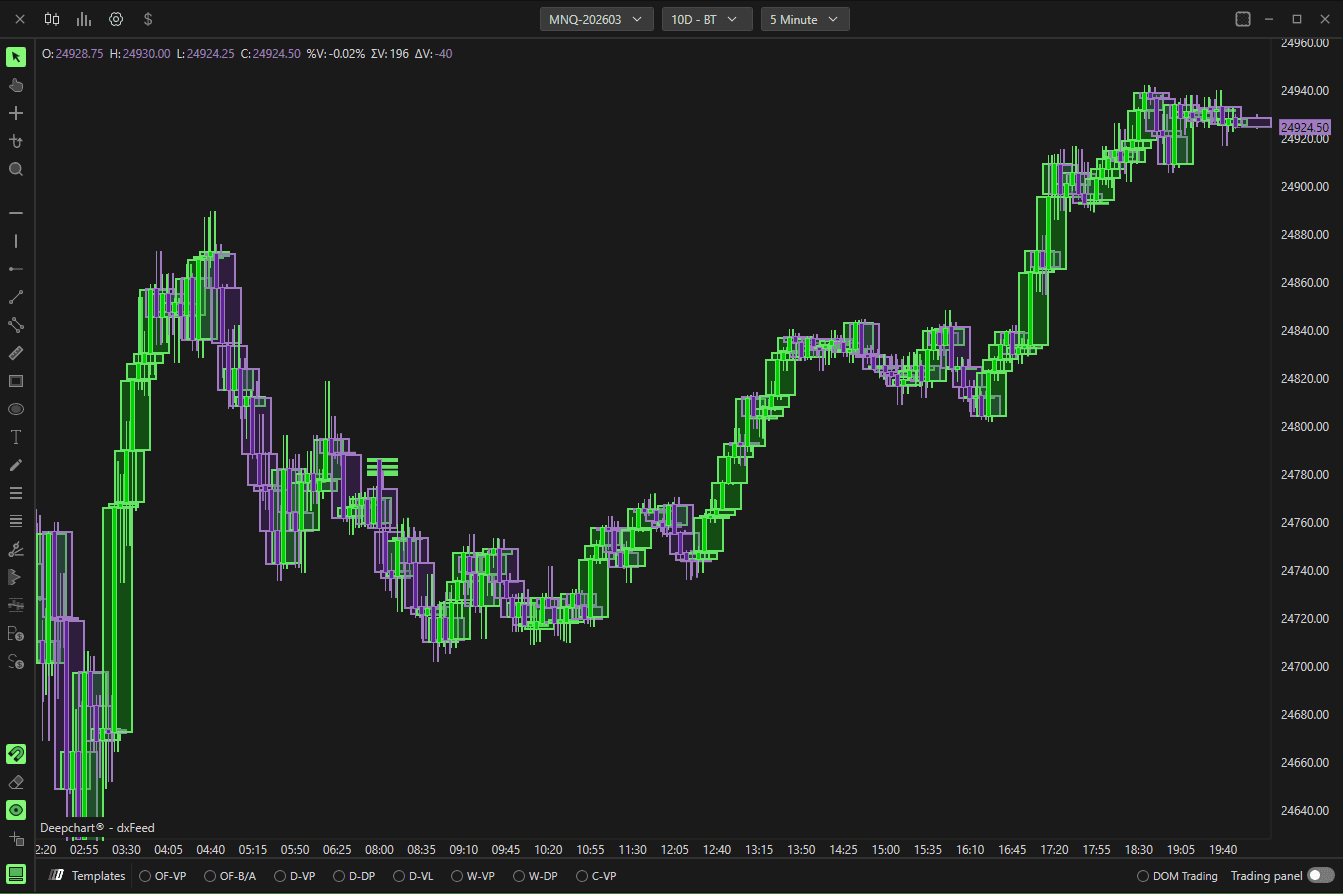
The Overlay Timeframe Candlestick helps traders:
See higher timeframe structure
Identify consolidation inside larger candles
Spot breakout context
Align entries with broader market direction
Settings
Chart Area
Horizontal – Draws overlay candles directly on the price chart.
Vertical – Displays vertically (if supported).
Panel selector – Chooses which chart panel the overlay appears in.
General
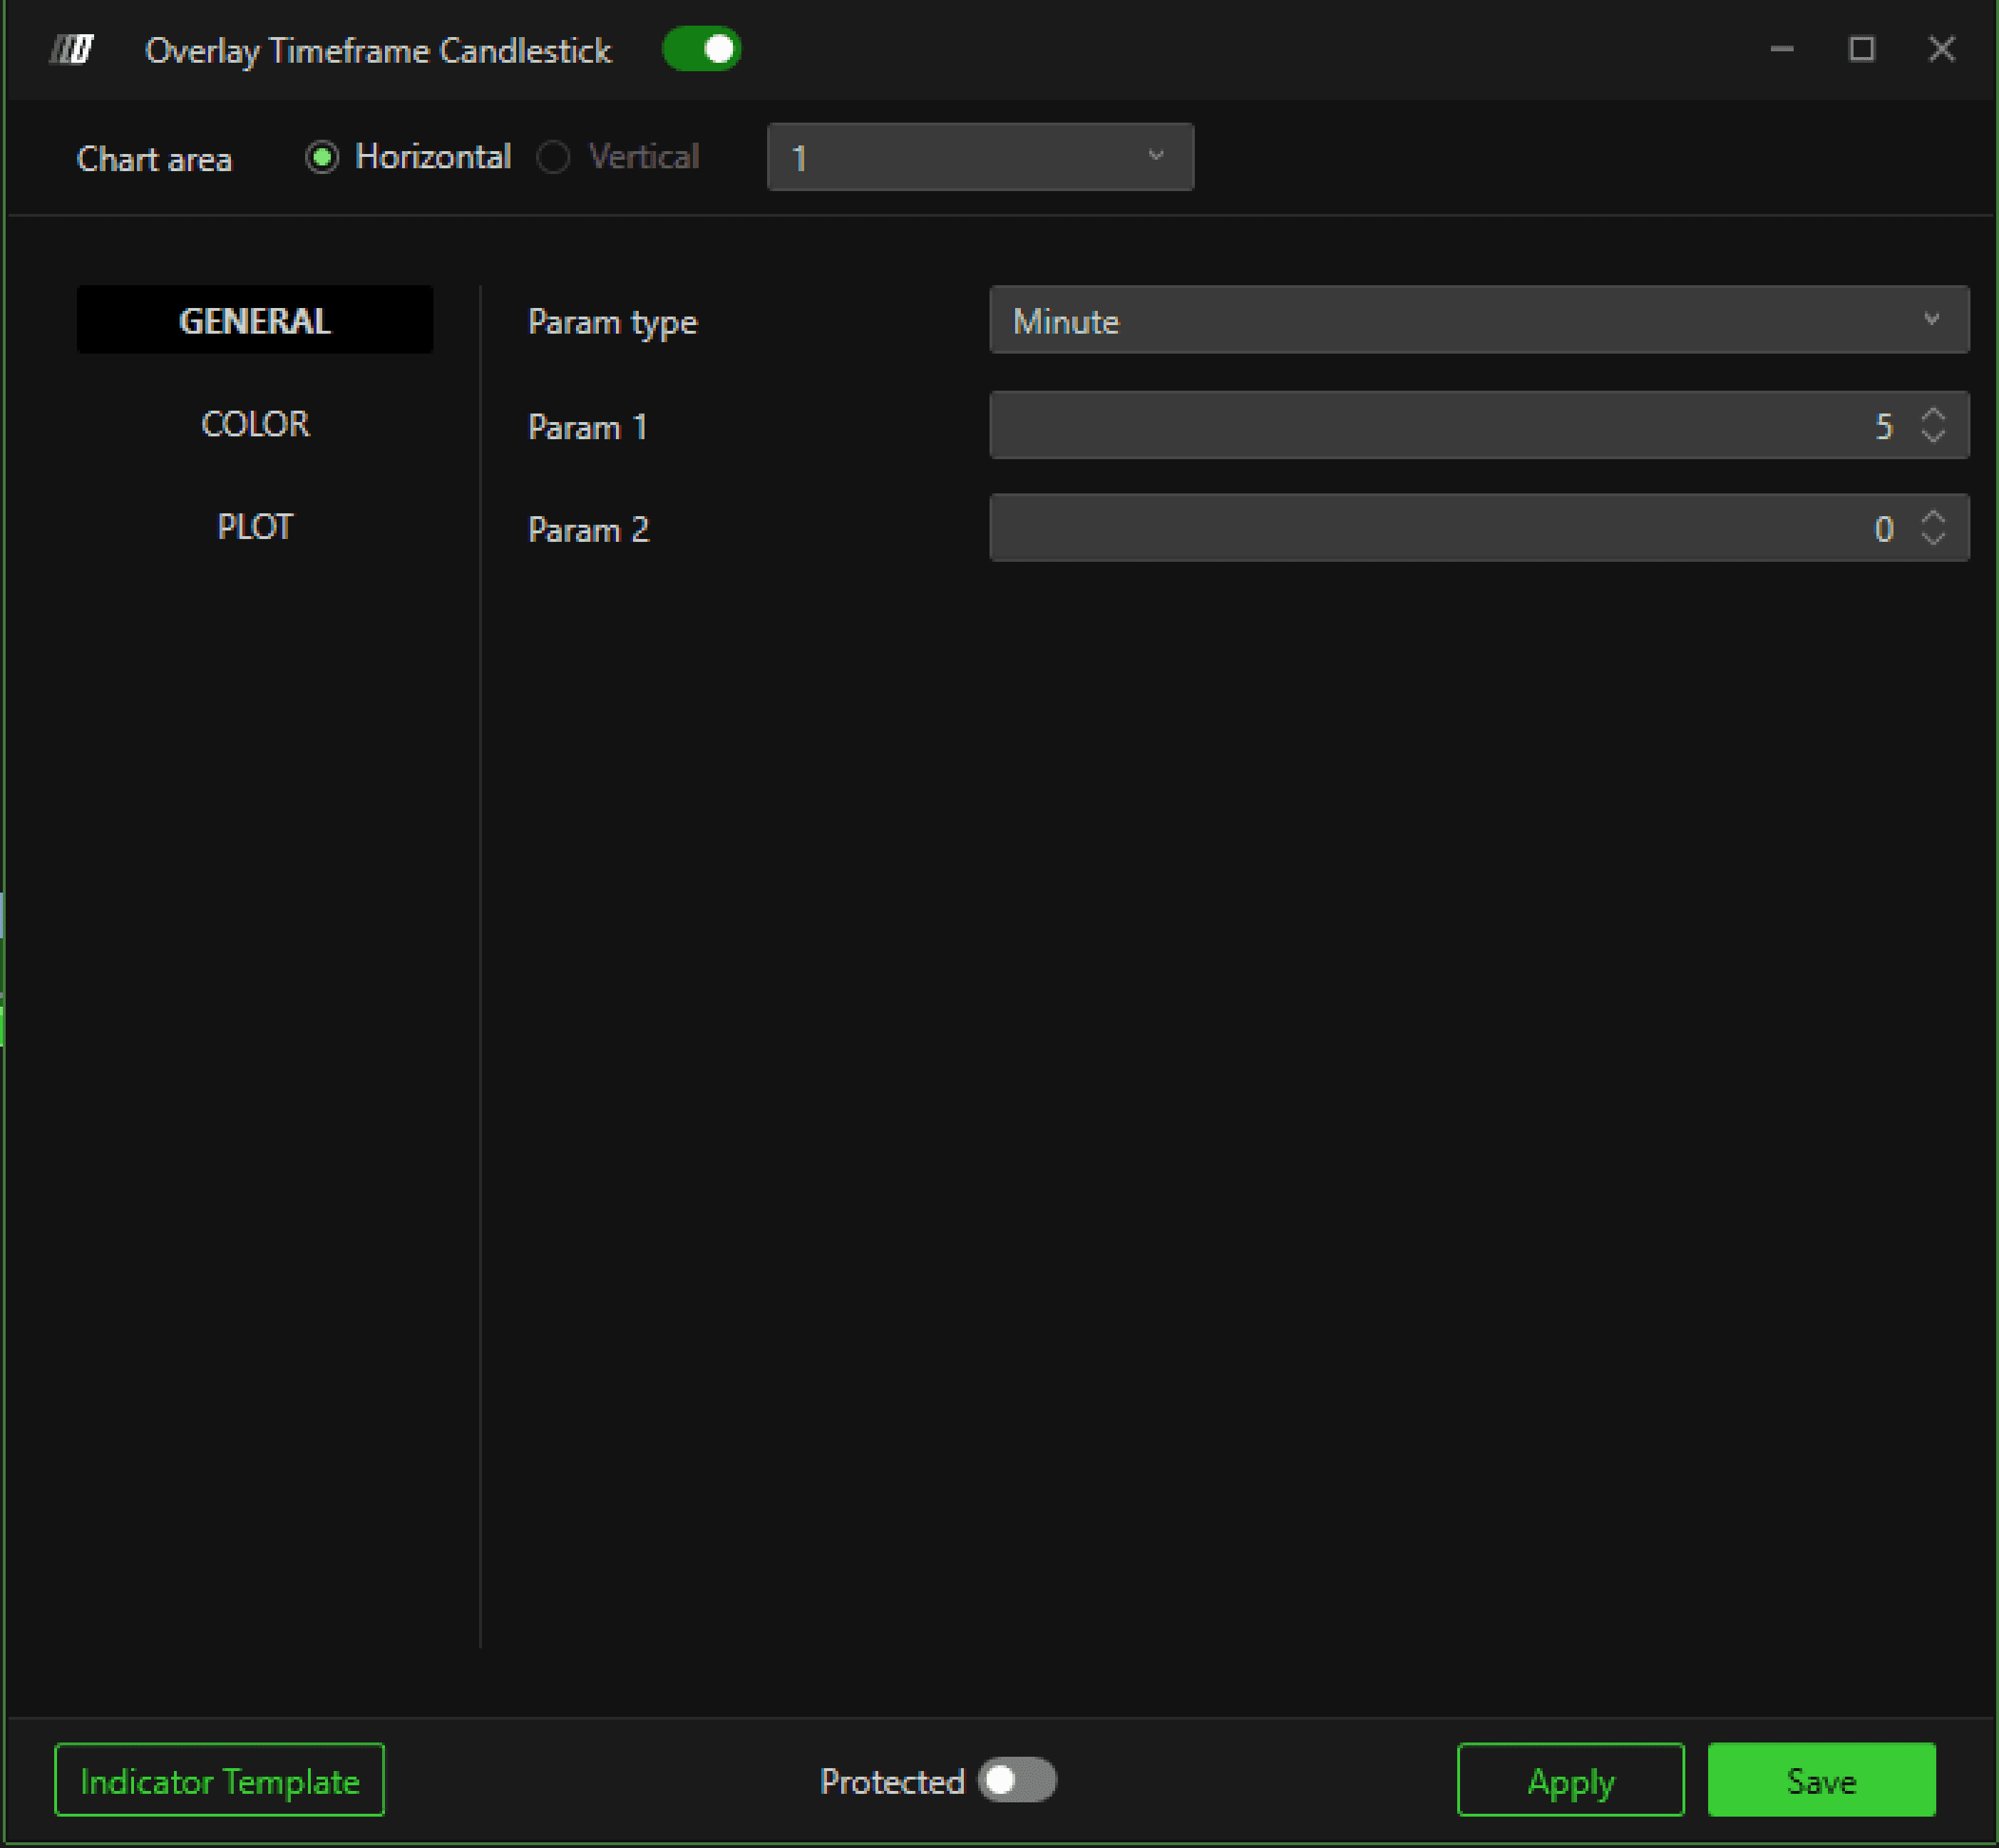
Param type
Defines the timeframe type used for the overlay (e.g., Minute, Hour, Day).
Param 1
Specifies the primary timeframe value.
Example: 5 (if Param type = Minute → overlays 5-minute candles).
Param 2
Optional secondary parameter used when required by the selected timeframe type.
Color
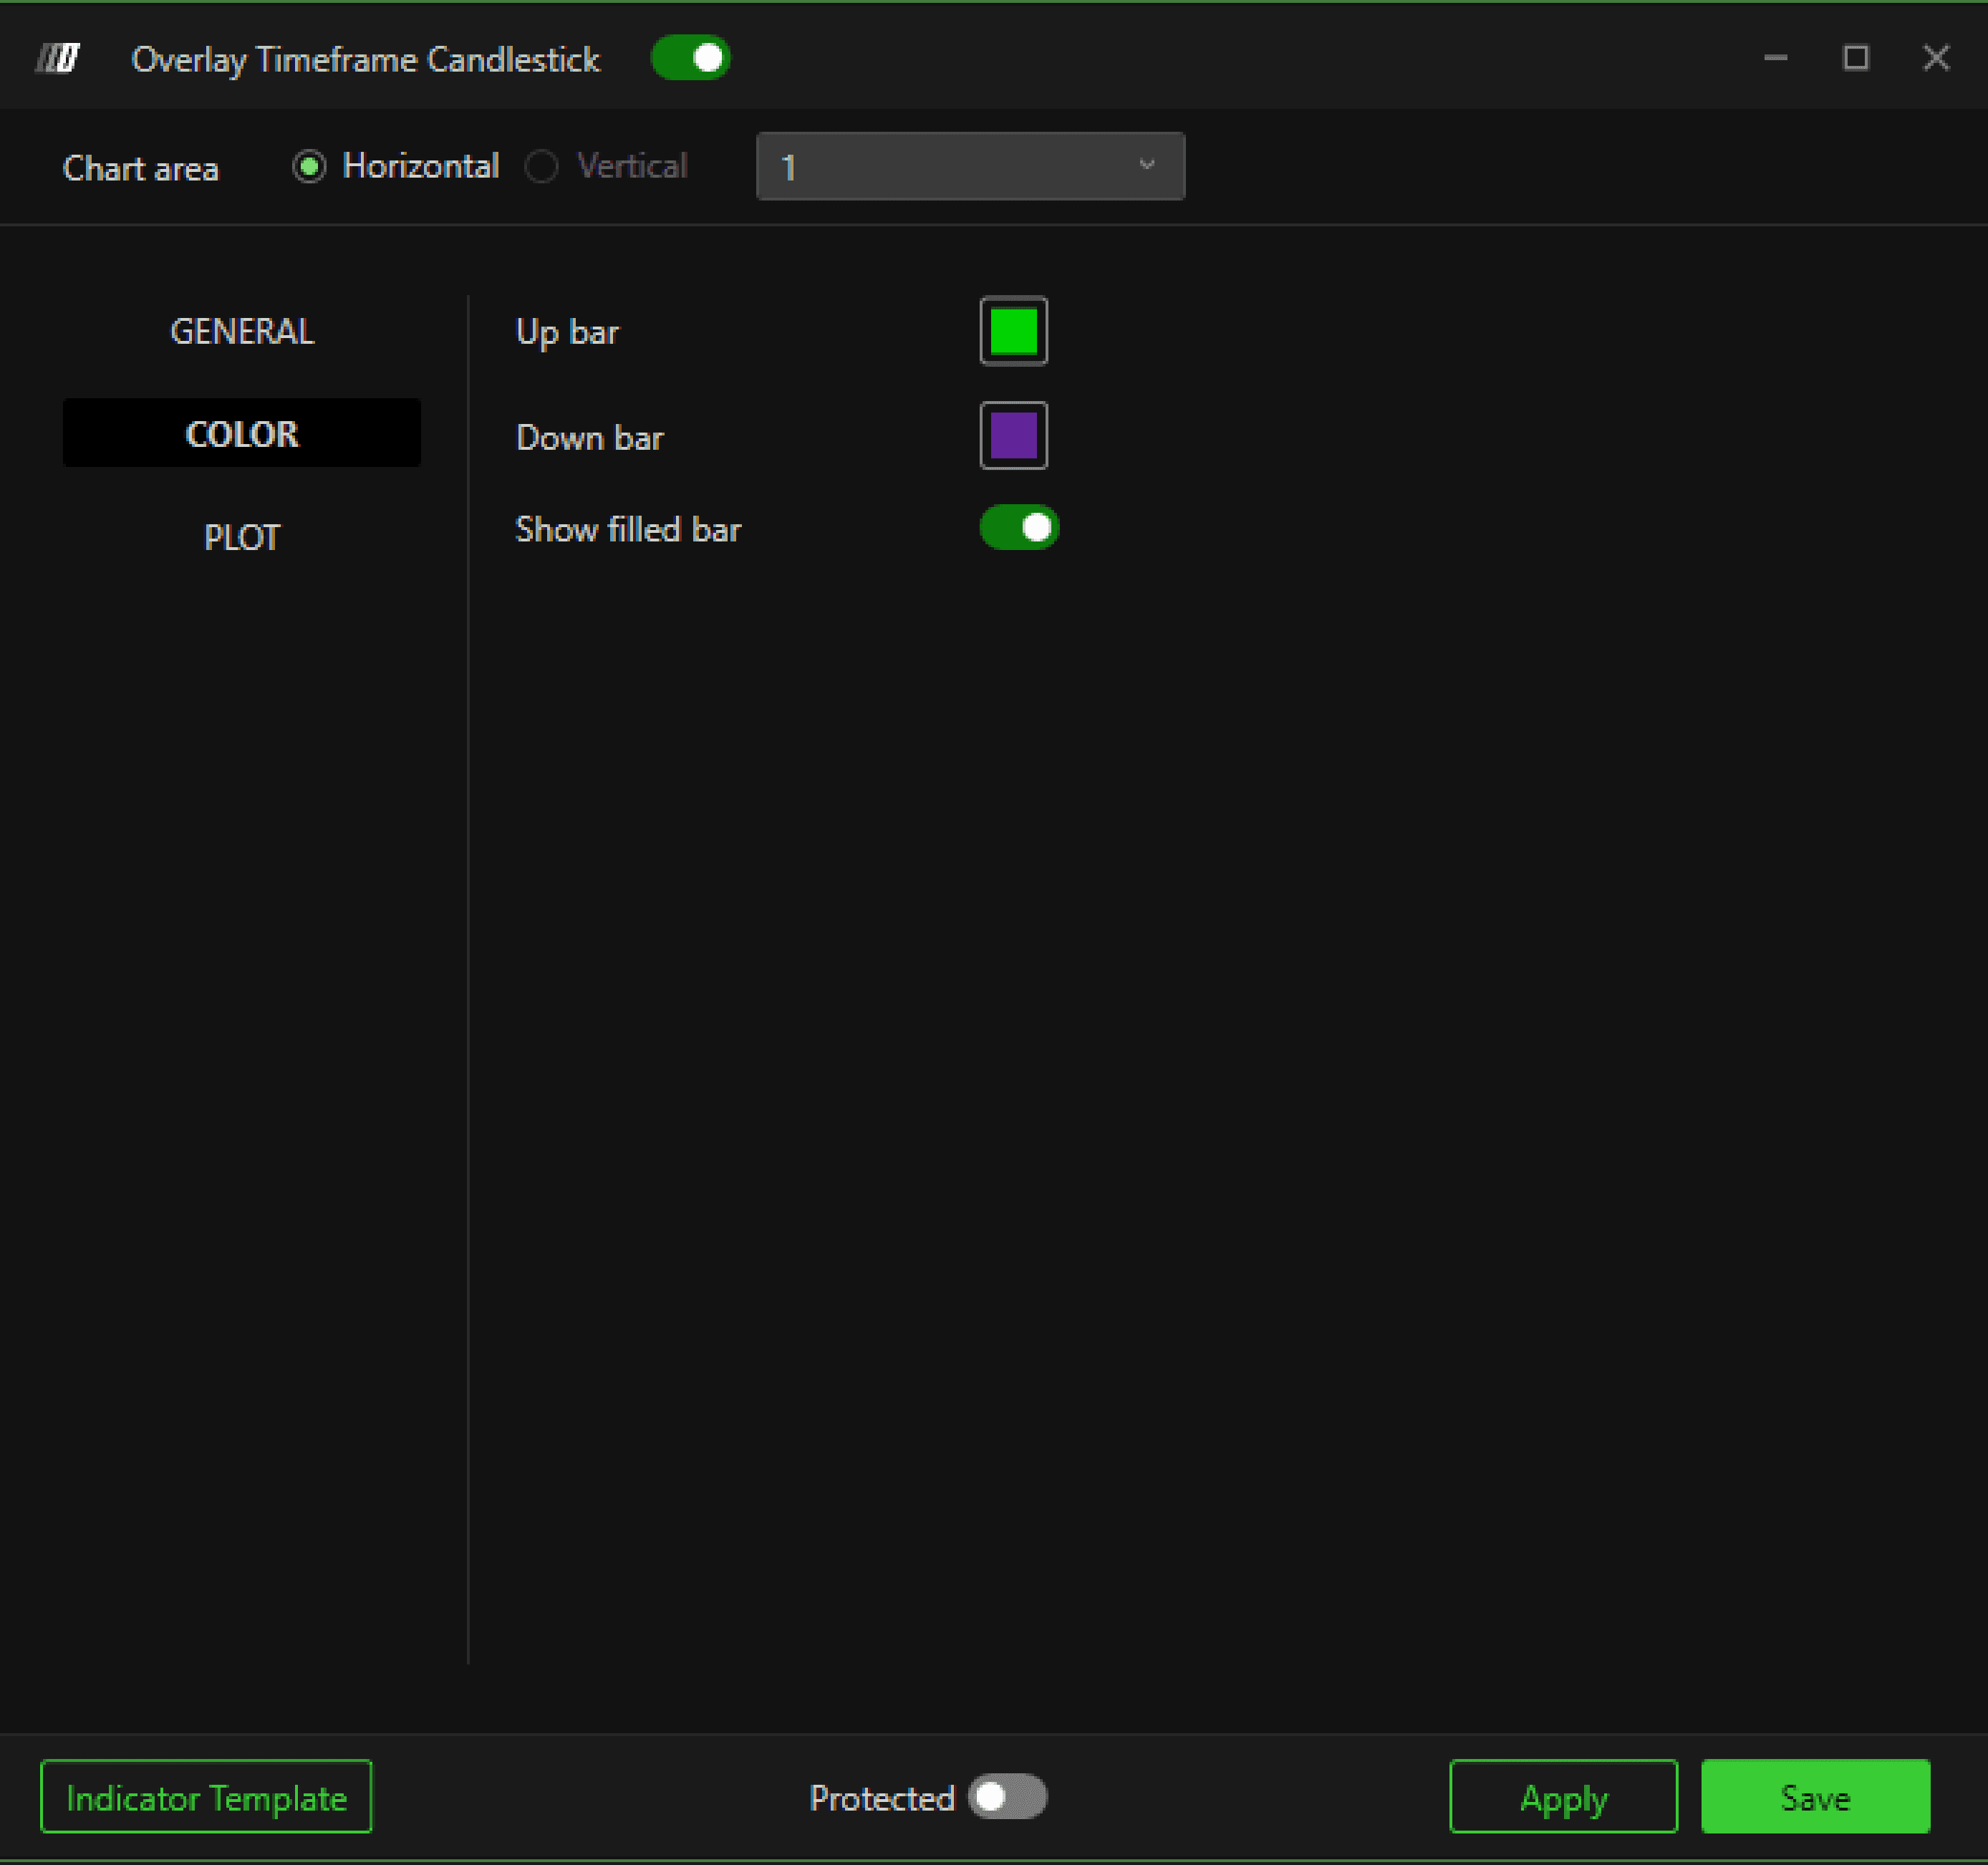
Up bar
Sets the color of bullish higher-timeframe candles.
Down bar
Sets the color of bearish higher-timeframe candles.
Show filled bar
Determines whether candles are filled or hollow.
Plot
Candle width
Controls the width of the overlay candles.
Border width
Adjusts thickness of the candle borders.
Opacity
Controls transparency of the overlay candles.
Higher value = more solid.
Lower value = more transparent.
Show vertical line on close
Draws a vertical line when a higher timeframe candle closes.
How It Works
Aggregates lower timeframe data into higher timeframe candles.
Displays them visually on top of the current chart.
Updates in real time until the higher timeframe bar closes.
Notes
Useful for multi-timeframe analysis.
Best combined with structure and liquidity levels.
Does not replace switching timeframes — it overlays context.