Deep Indicators
Updated:
The Deep V-Tracker is a sophisticated Order Flow indicator designed to detect volumetric imbalances and specific price patterns. It provides traders with insights into both price action and the underlying order flow dynamics. The indicator consists of two main modules:
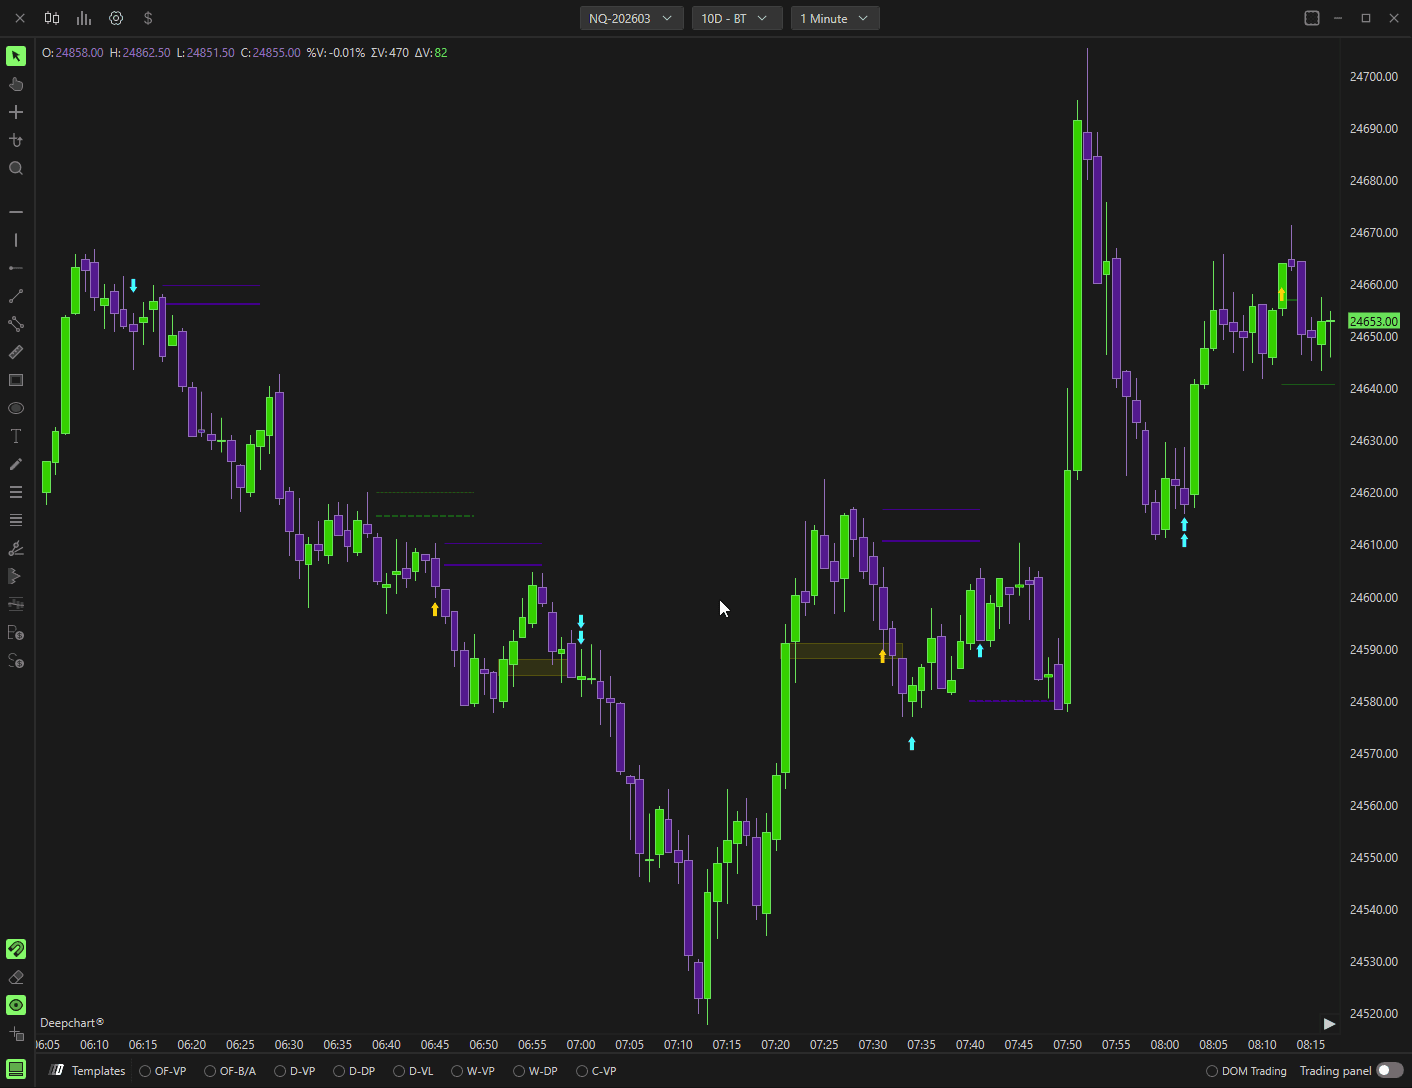
Patterns – Analyzes candlestick movements and price action.
Absorption & Pressure – Evaluates volumetric activity at key levels.
1. Applying Deep V-Tracker
Open the Indicator List on your chart.
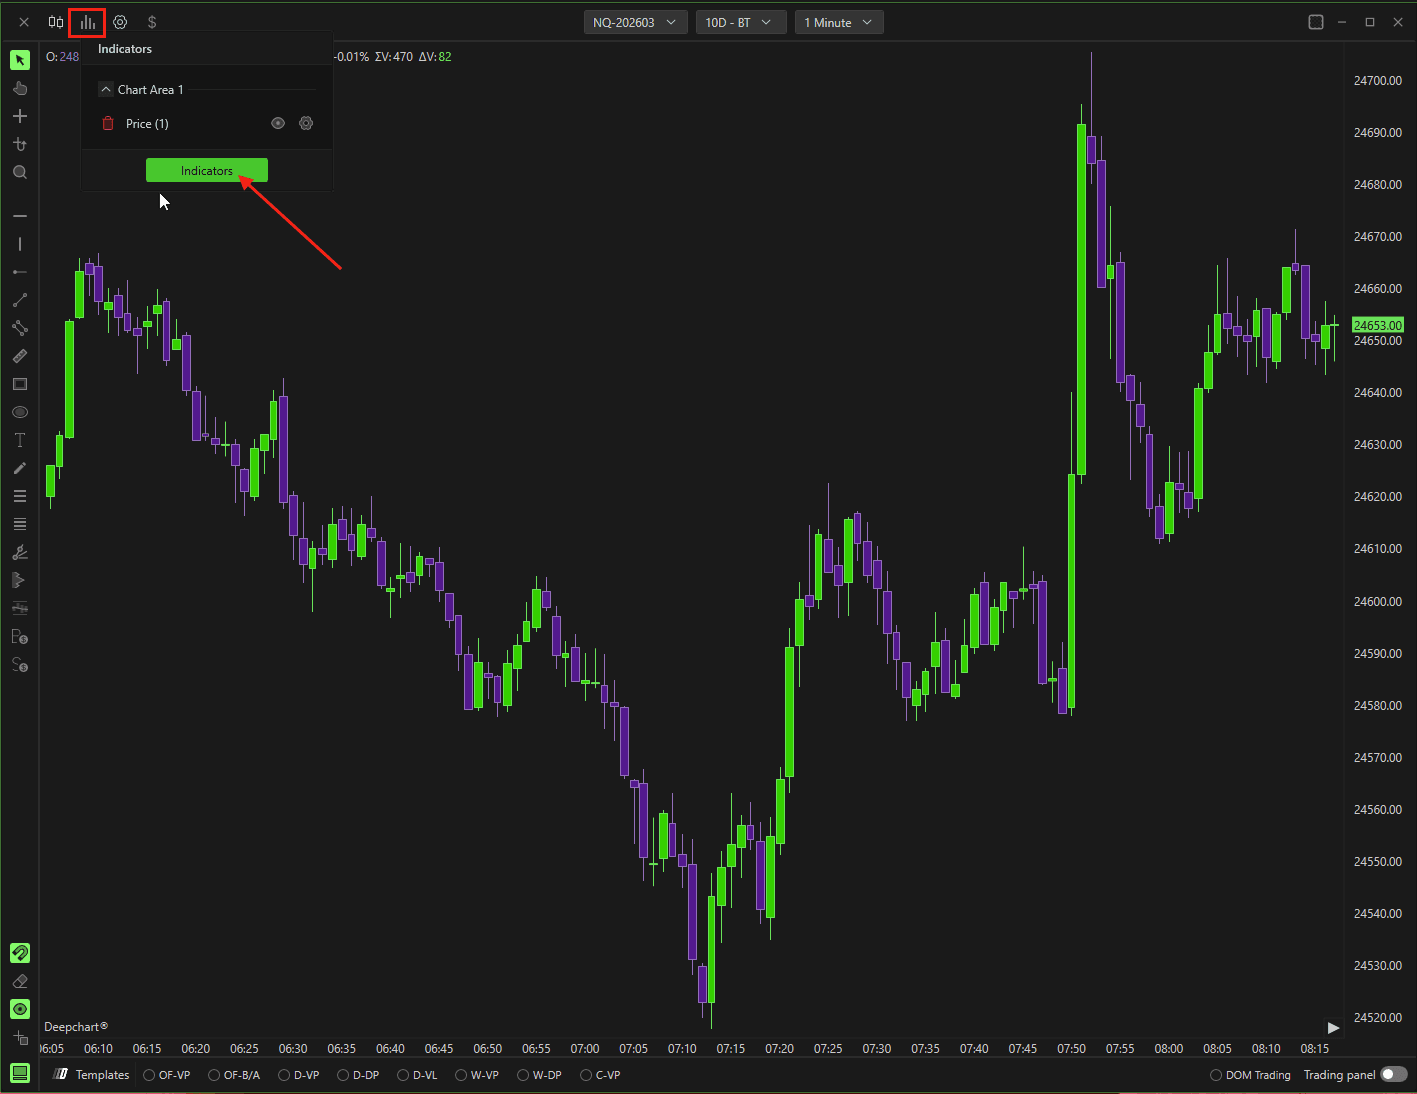
Locate Deep V-Tracker and click the + button to add it.
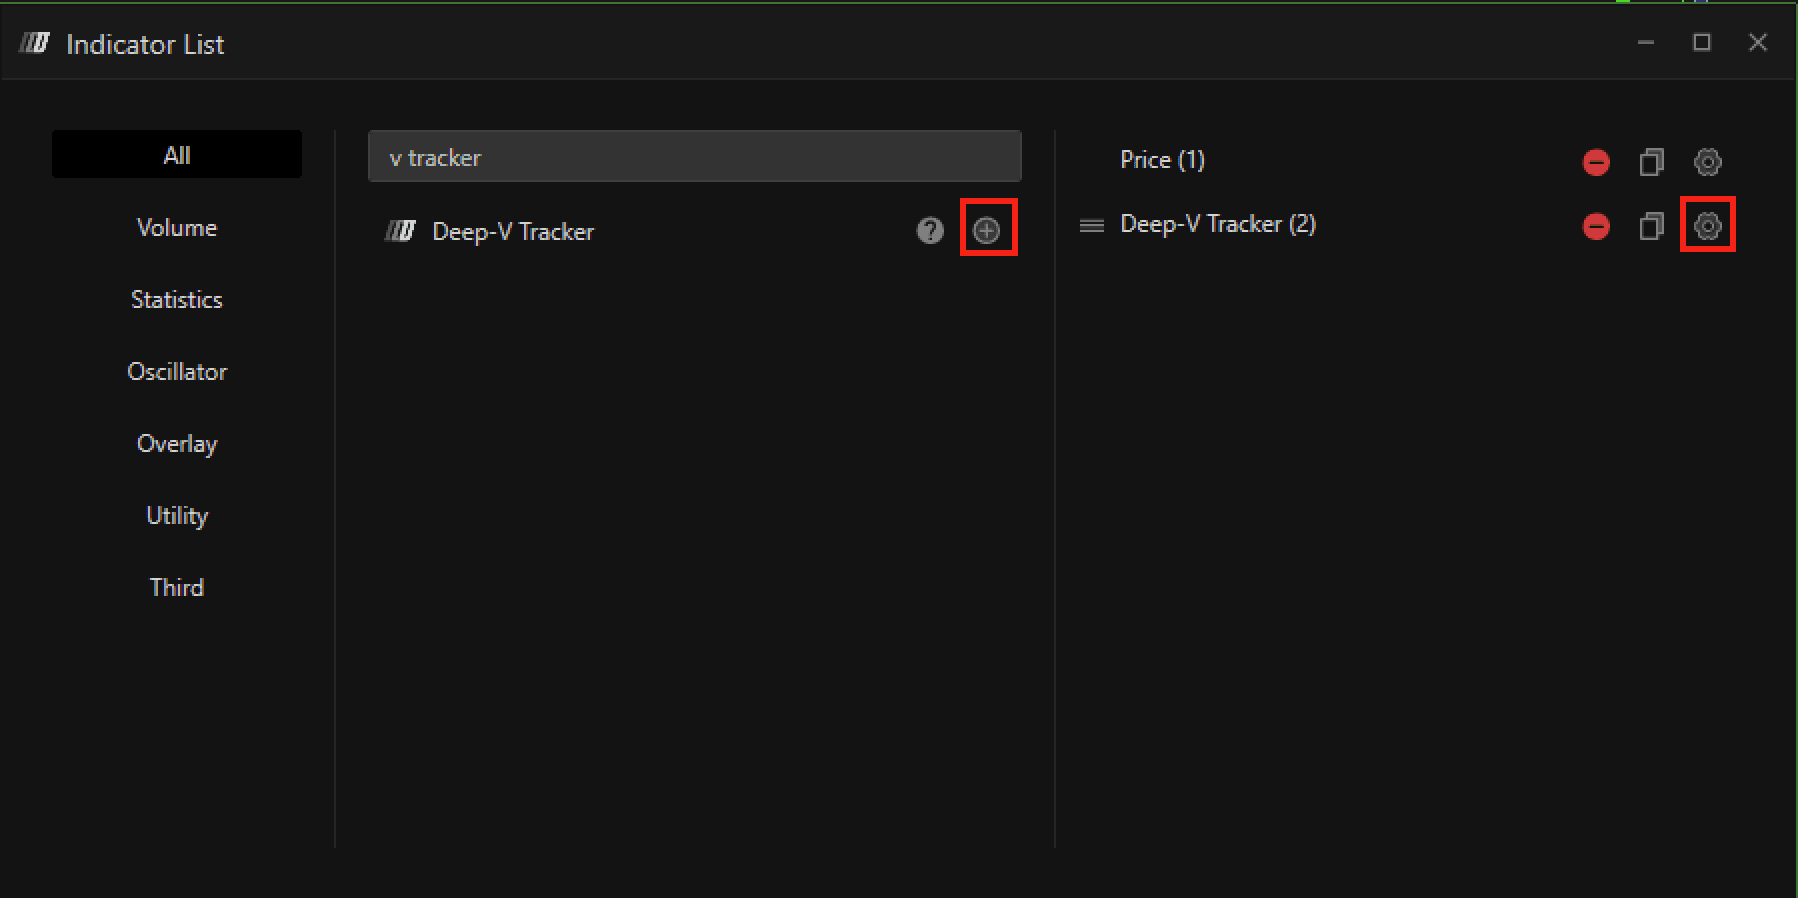
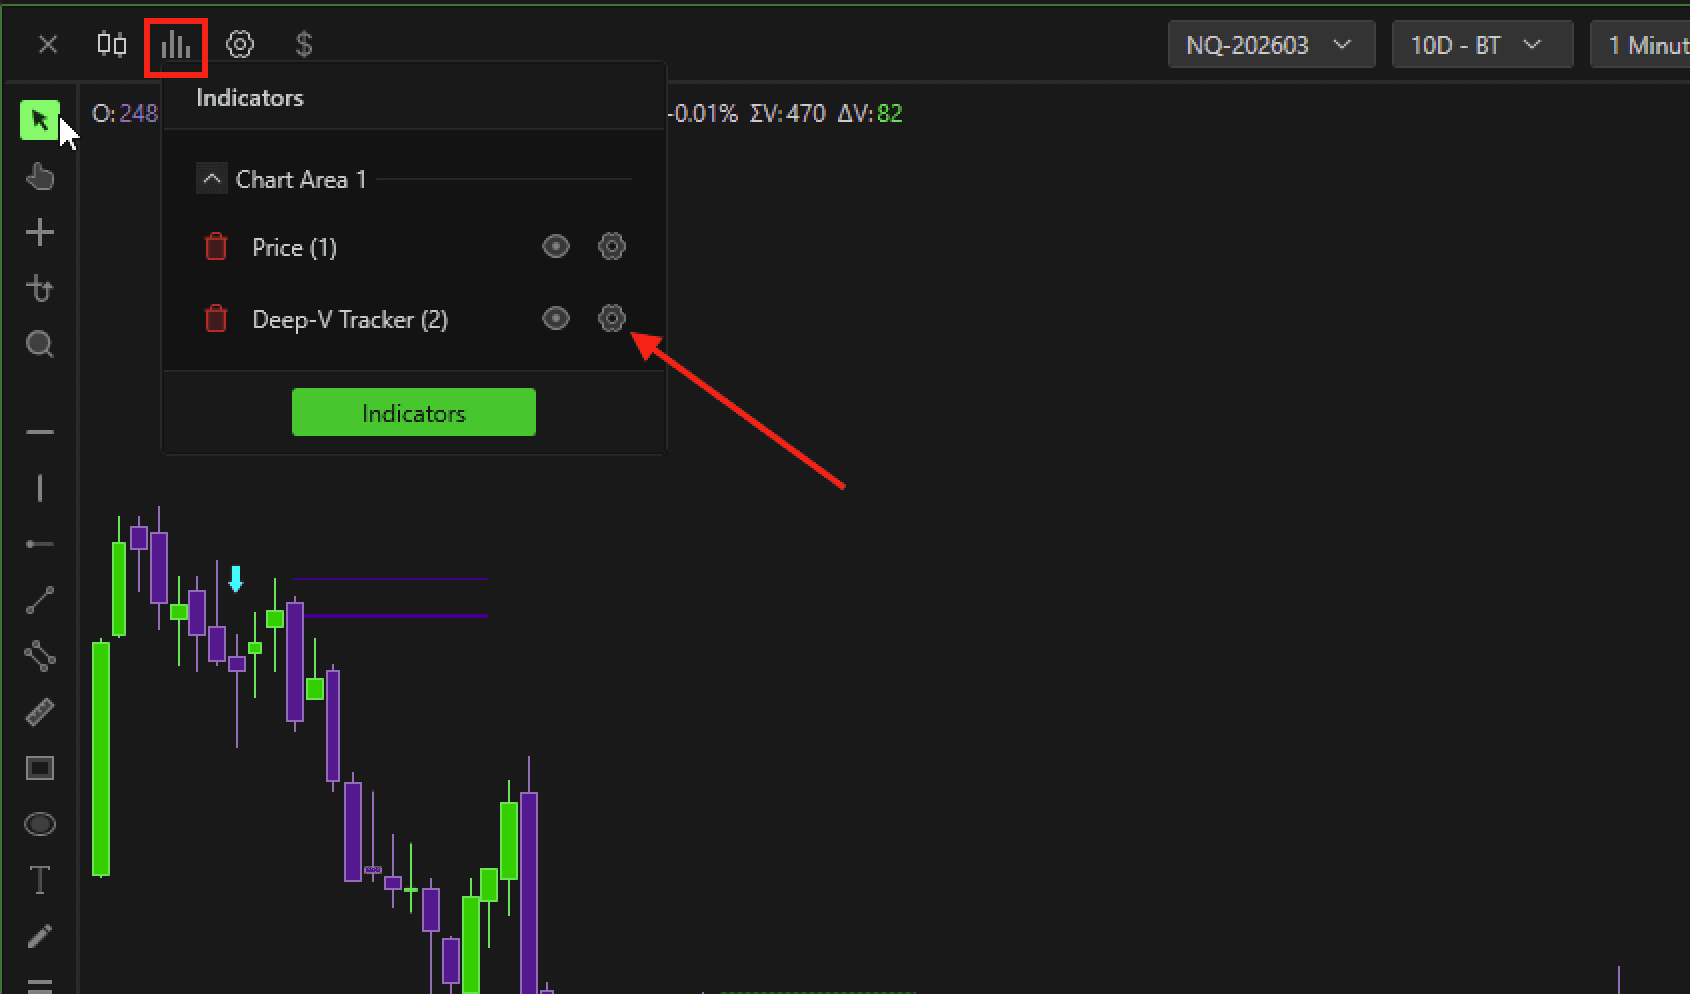
Click the Settings icon next to Deep V-Tracker in the active indicator list to configure its parameters.
2. Patterns Module
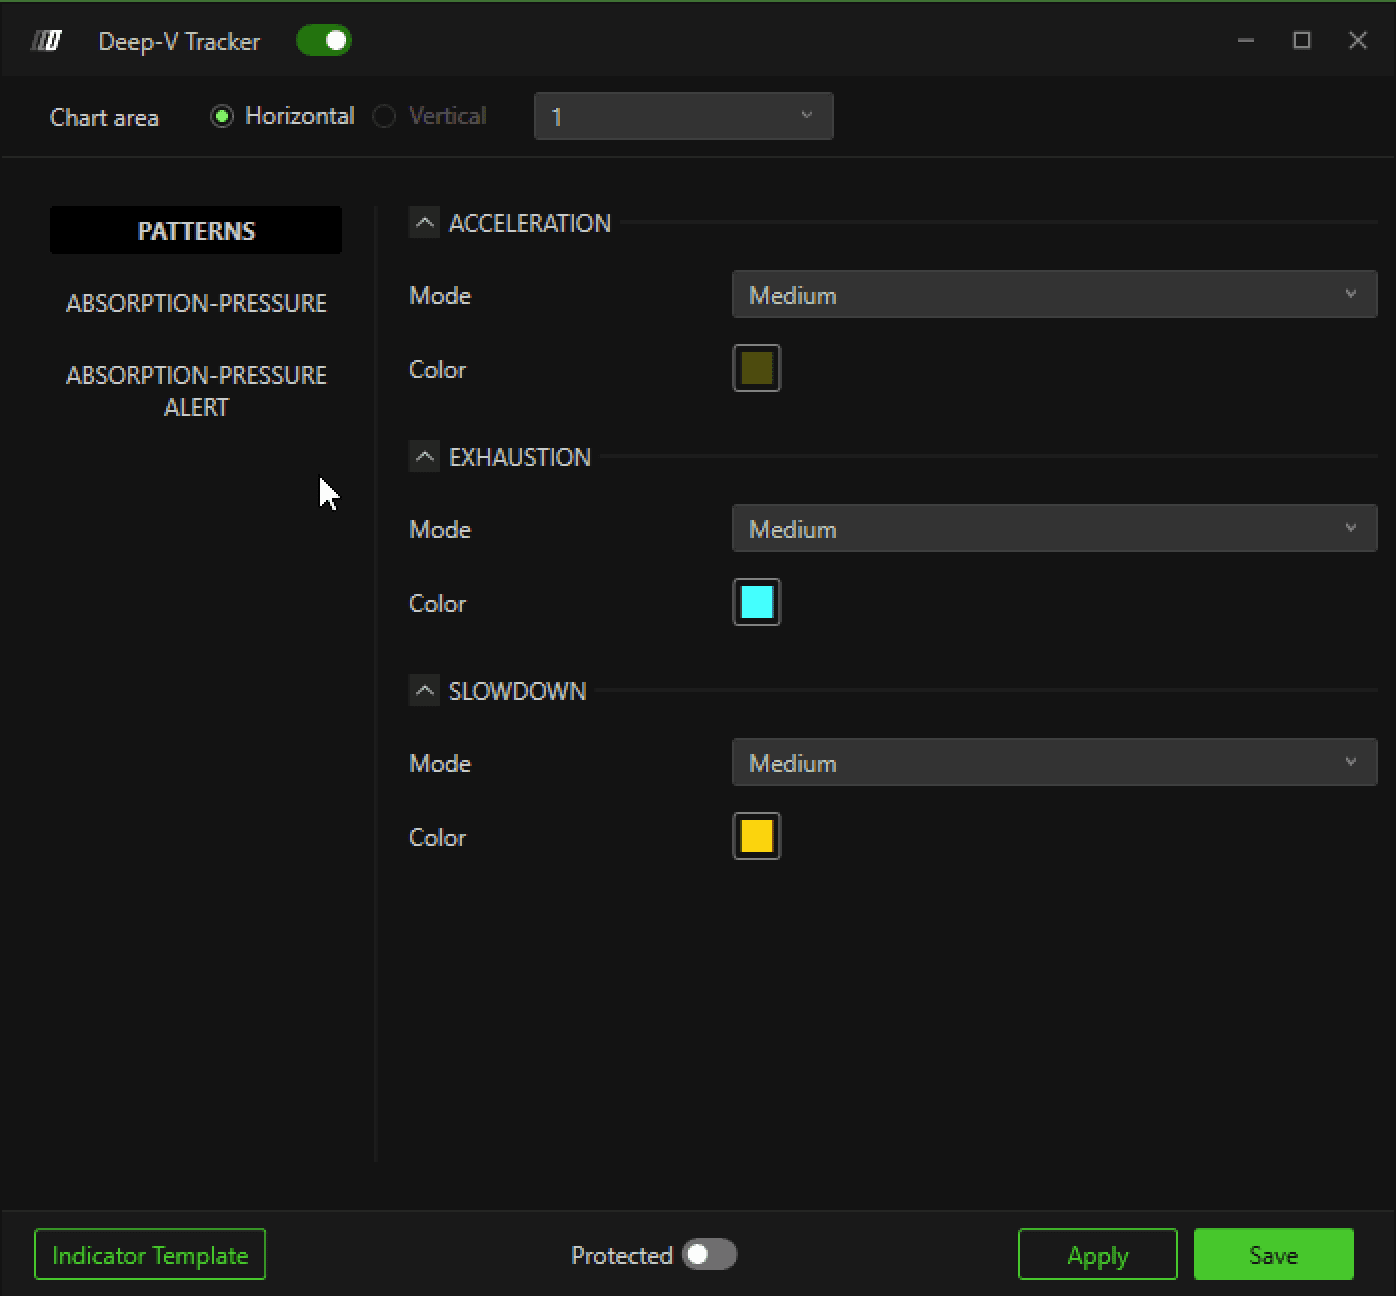
The Patterns module identifies anomalies in trading speed and candlestick behavior. Three pattern types exist: Acceleration, Exhaustion, and Slowdown. For clarity, it is recommended to enable only Acceleration to keep the chart clean.
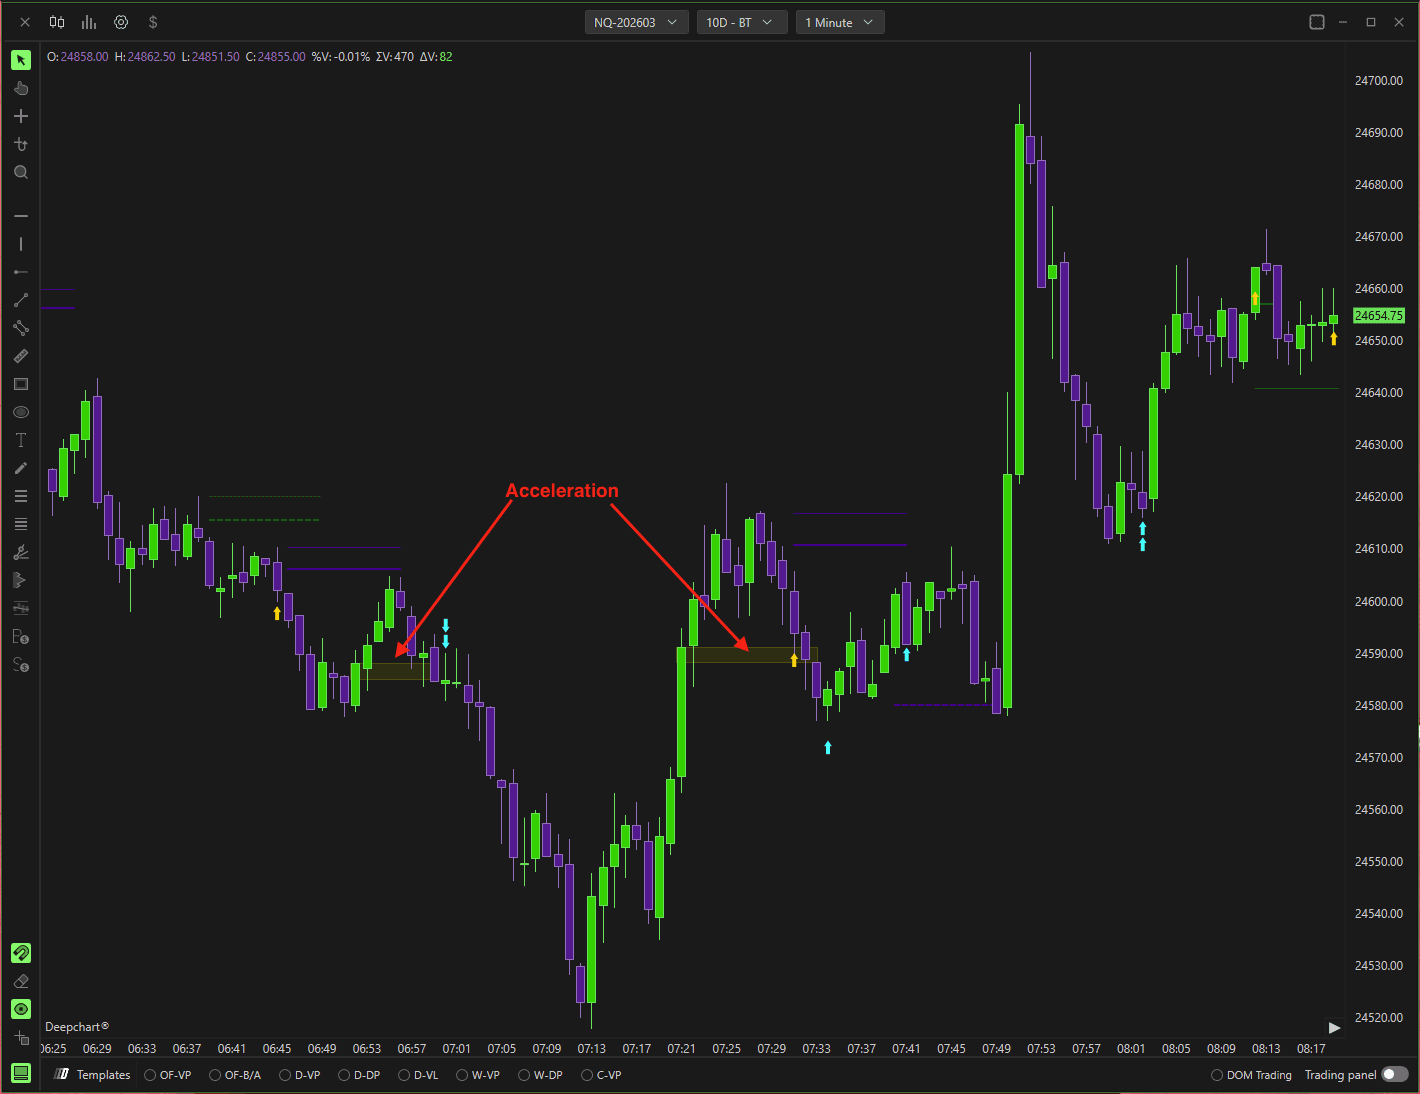
Acceleration
Definition: Detects a sudden “jerk” or acceleration in order flow during candle formation.
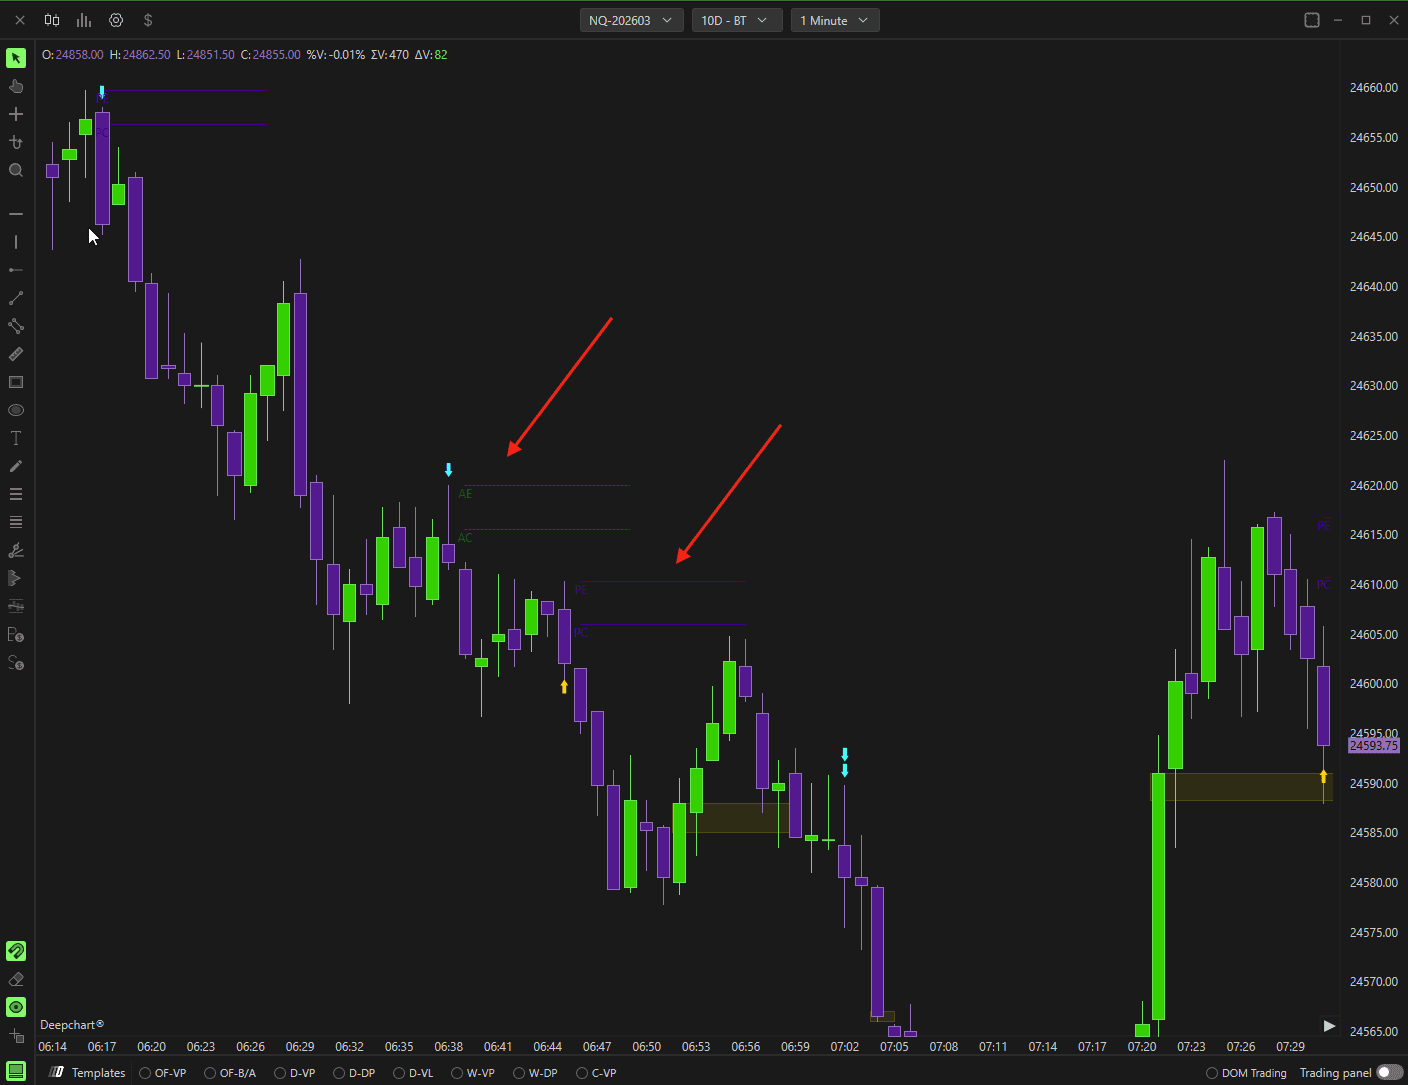
Visualization: Displayed as a filled Cyan Box covering the candle body or part of it.
Operational Meaning: Indicates zones of strong institutional interest:
Rejection points (potential reversals)
Strong trend continuation points
Recommendation: Disable Exhaustion and Slowdown to avoid chart clutter.
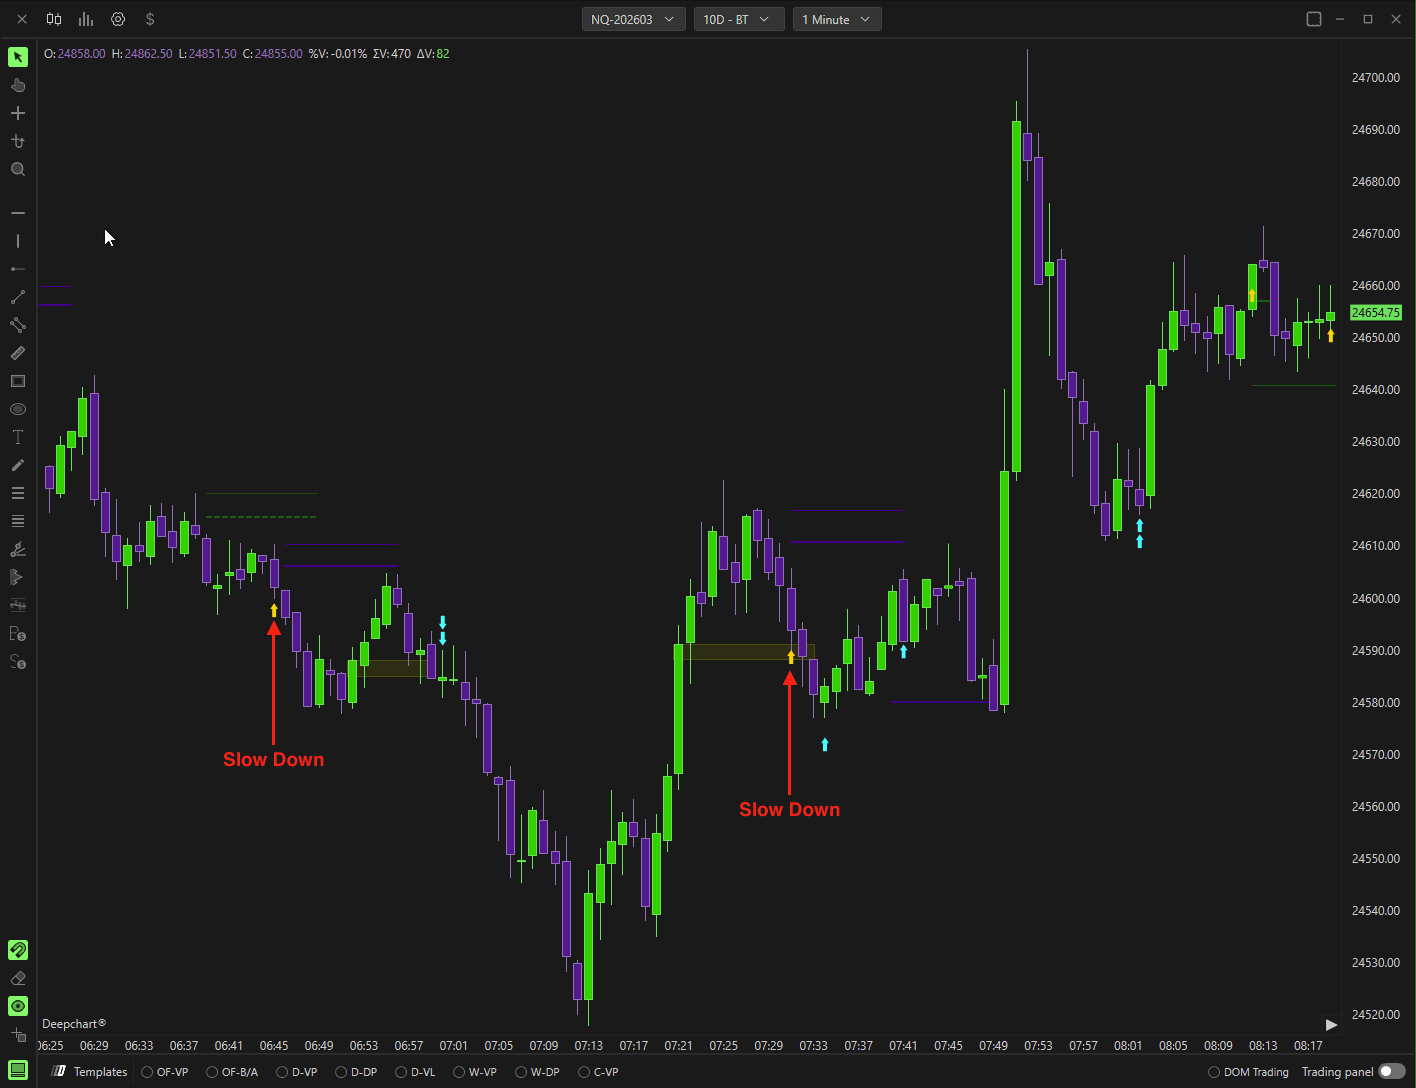
Slowdown
Definition: Shows where price movement decelerates in its current direction.
Use Case: Helpful for spotting potential consolidation or weakening trends.
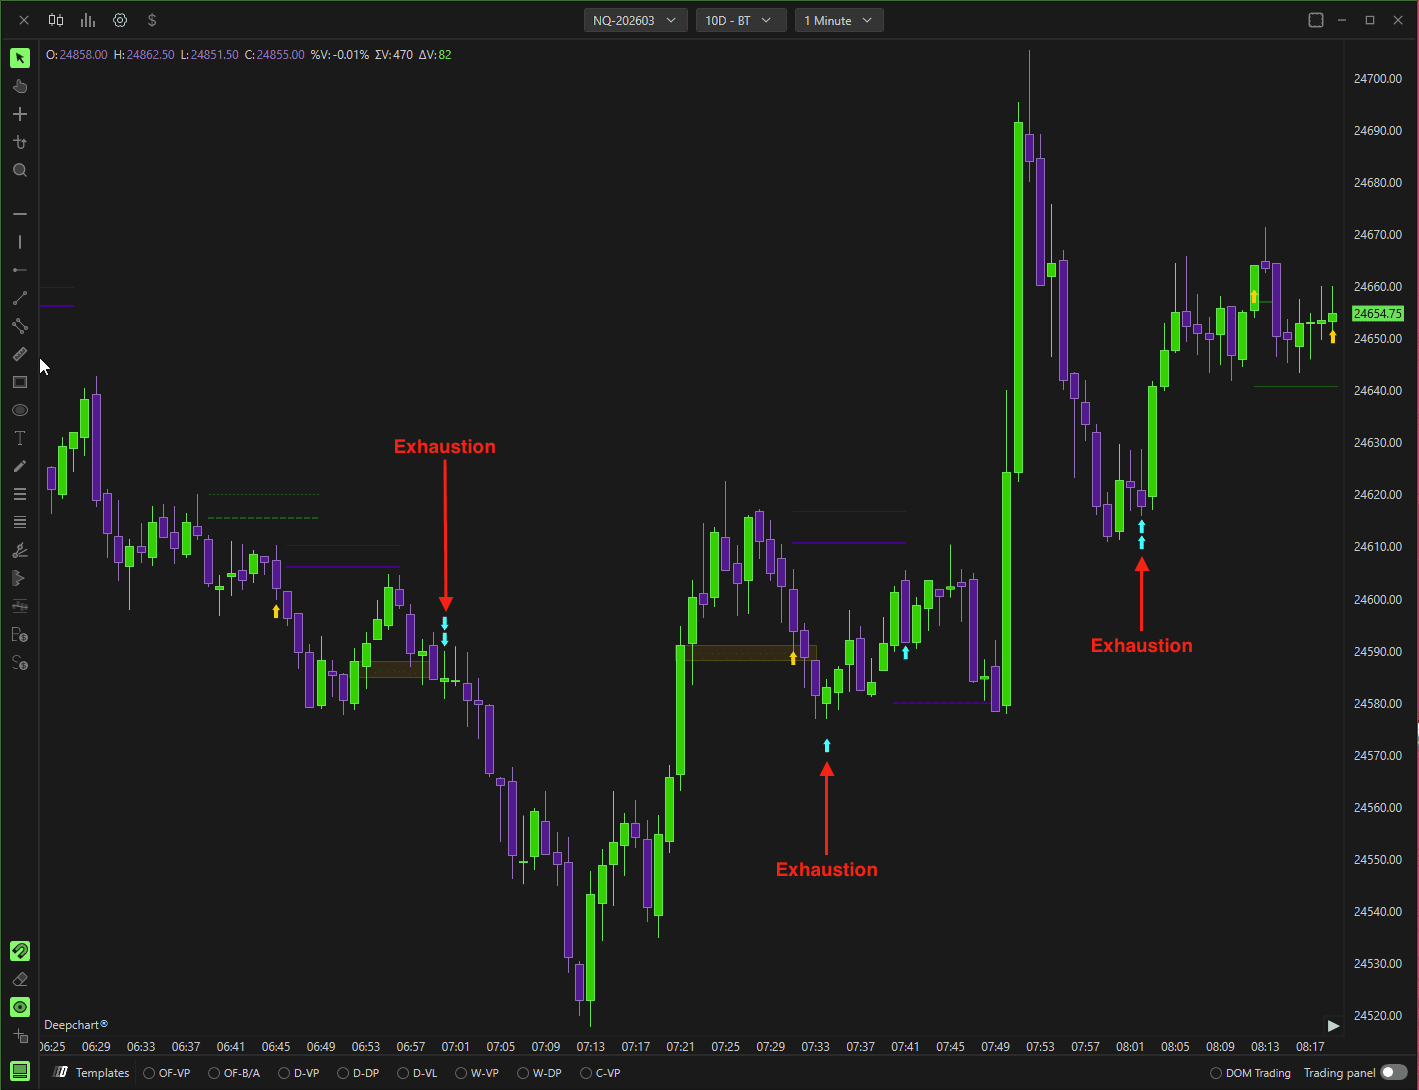
Exhaustion
Definition: Occurs when aggressive participants run out of energy or orders, leaving little buying or selling pressure to continue the move.
Interpretation:
Uptrend exhaustion: Buyers are finished → possible reversal or pullback.
Downtrend exhaustion: Sellers are finished → potential bottom forming.
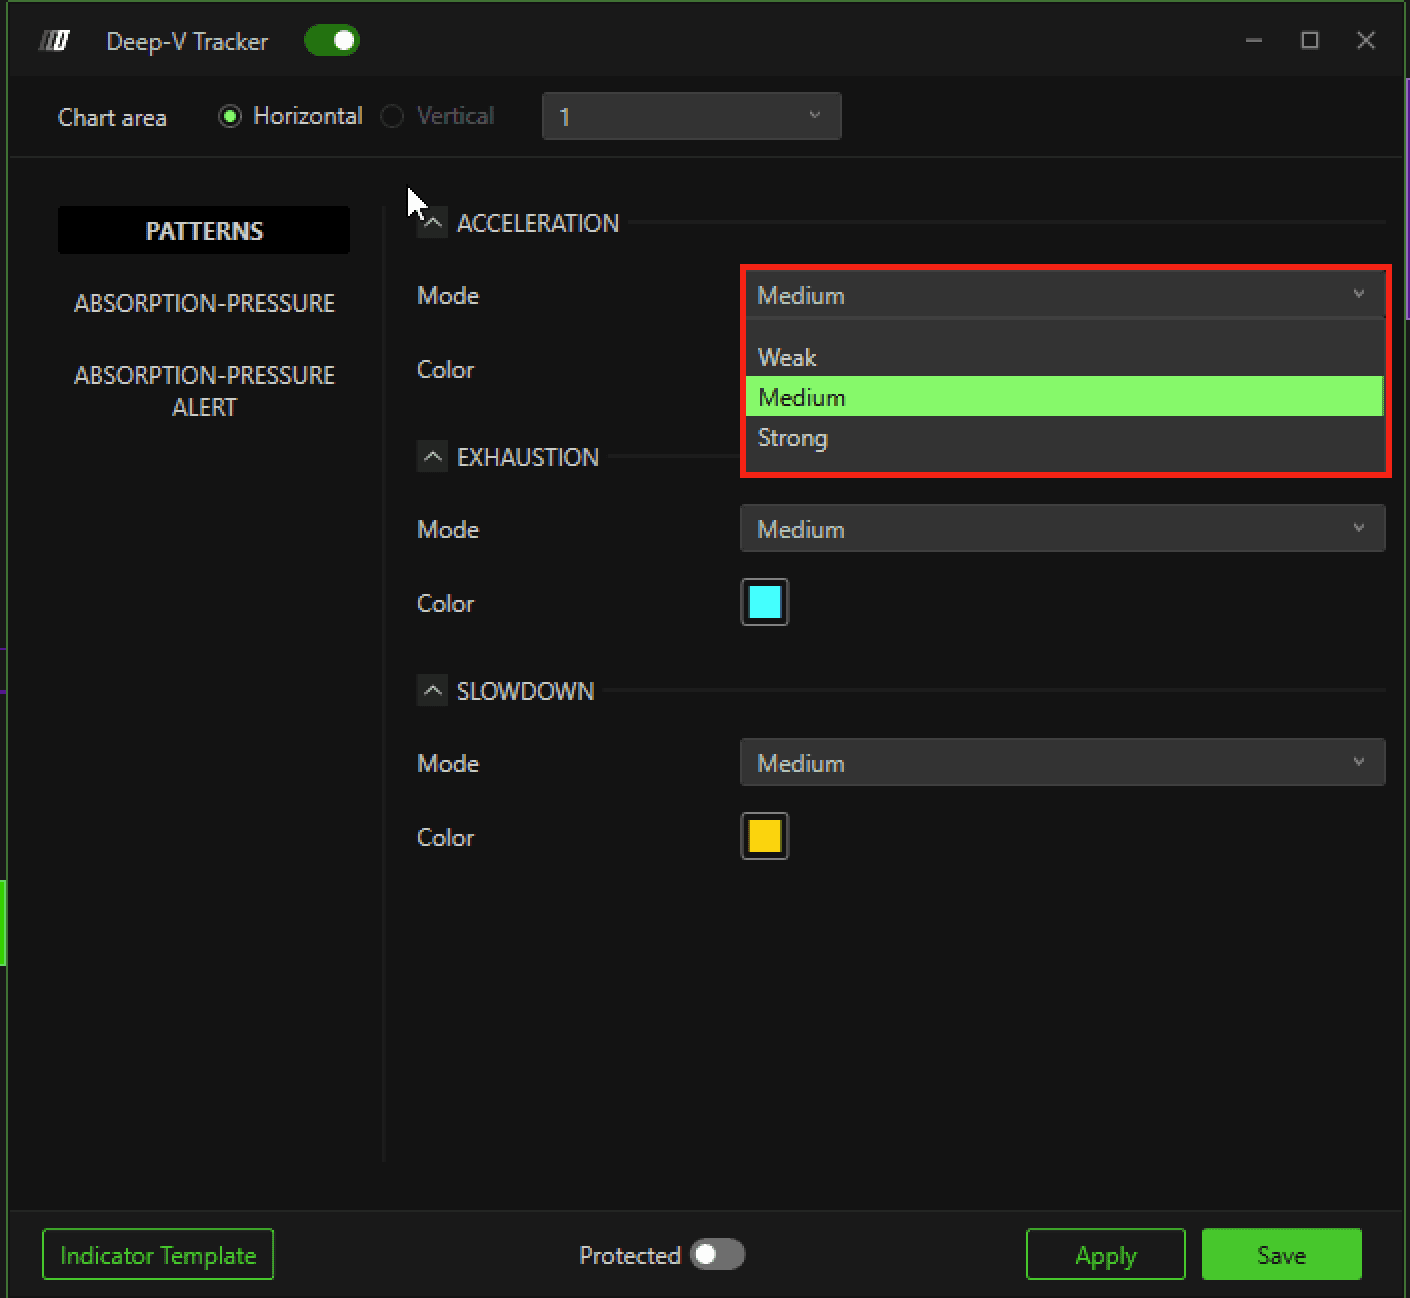
Pattern Mode
Strong: Filters noise, shows only strong levels
Medium: Moderate noise, shows medium strength levels
Weak: More markers, higher noise
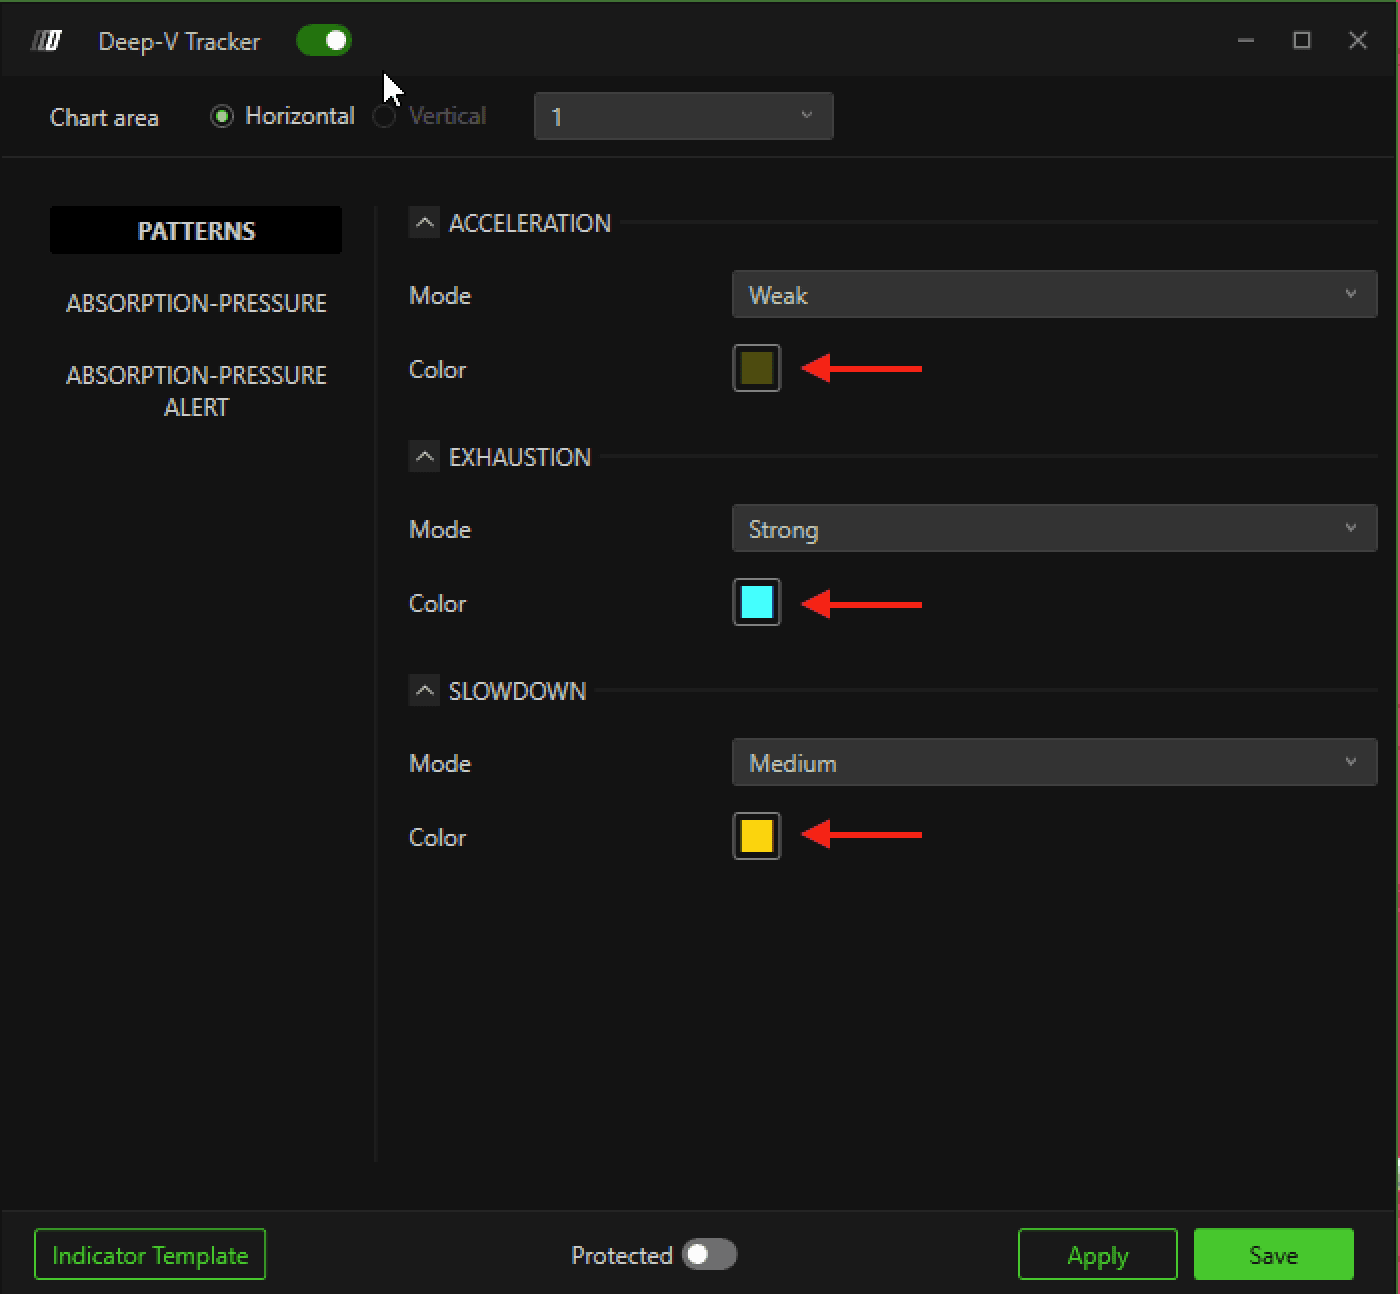
Color: Customize marker color for each pattern
3. Absorption & Pressure Module
This module highlights zones where buyers or sellers are exerting force via horizontal lines.
Color:
Purple: Activity on BID (Seller Pressure)
Green: Activity on ASK (Buyer Pressure)
Colors are fully customizable.
Labels
P = Pressure: Indicates active zones where one counterparty pushes price with force.
Dashed P → Strong buying pressure
Solid P → Strong selling pressure
A = Absorption: Zones where aggressive orders are blocked by passive orders (limit orders). Often signals potential reversal or bounce.
Control Levels (C and E Suffixes)
C = Control (PC / AC): Key level; expect price reaction.
E = Extreme (PE / AE): Maximum limit; closing beyond invalidates the zone.
Label | Meaning |
|---|---|
PC | Pressure Control – key selling level |
PE | Pressure Extreme – invalidation level |
AC | Absorption Control – key buying absorption level |
AE | Absorption Extreme – invalidation level for absorption zone |
Intensity
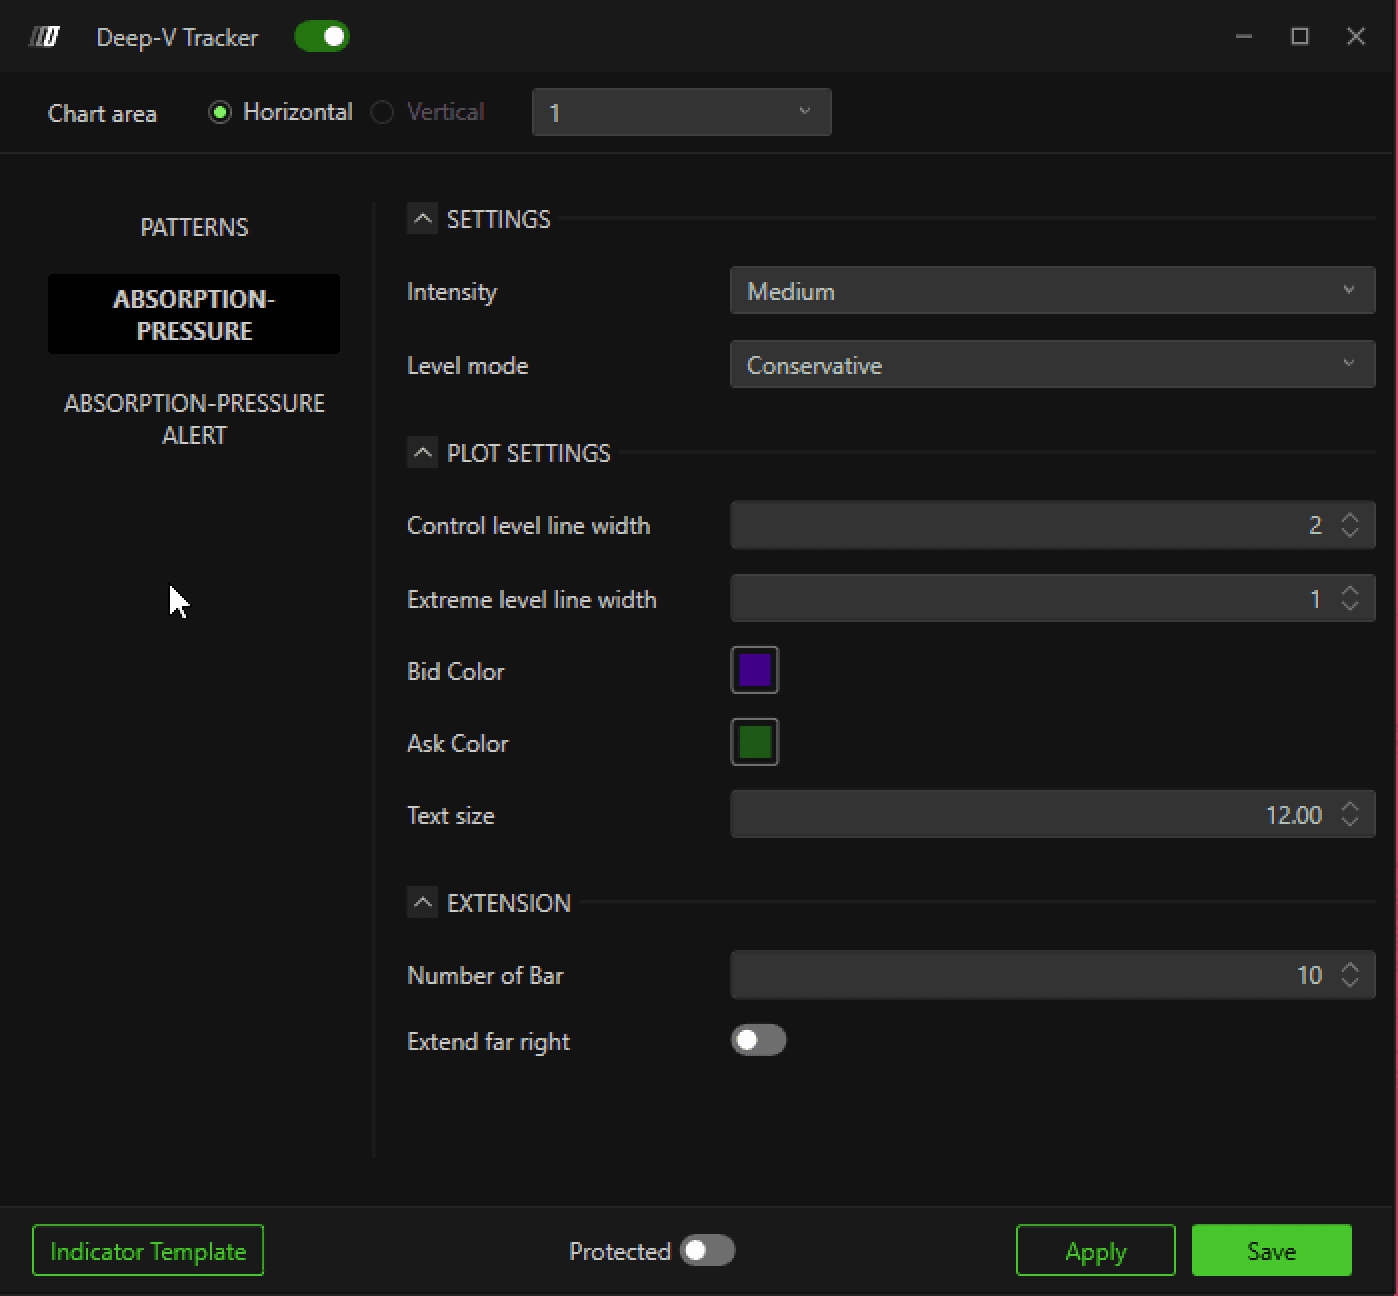
Strong: Shows only the strongest levels, minimal noise
Medium: Balance of visibility and noise
Weak: Shows more levels, higher noise
Level Mode
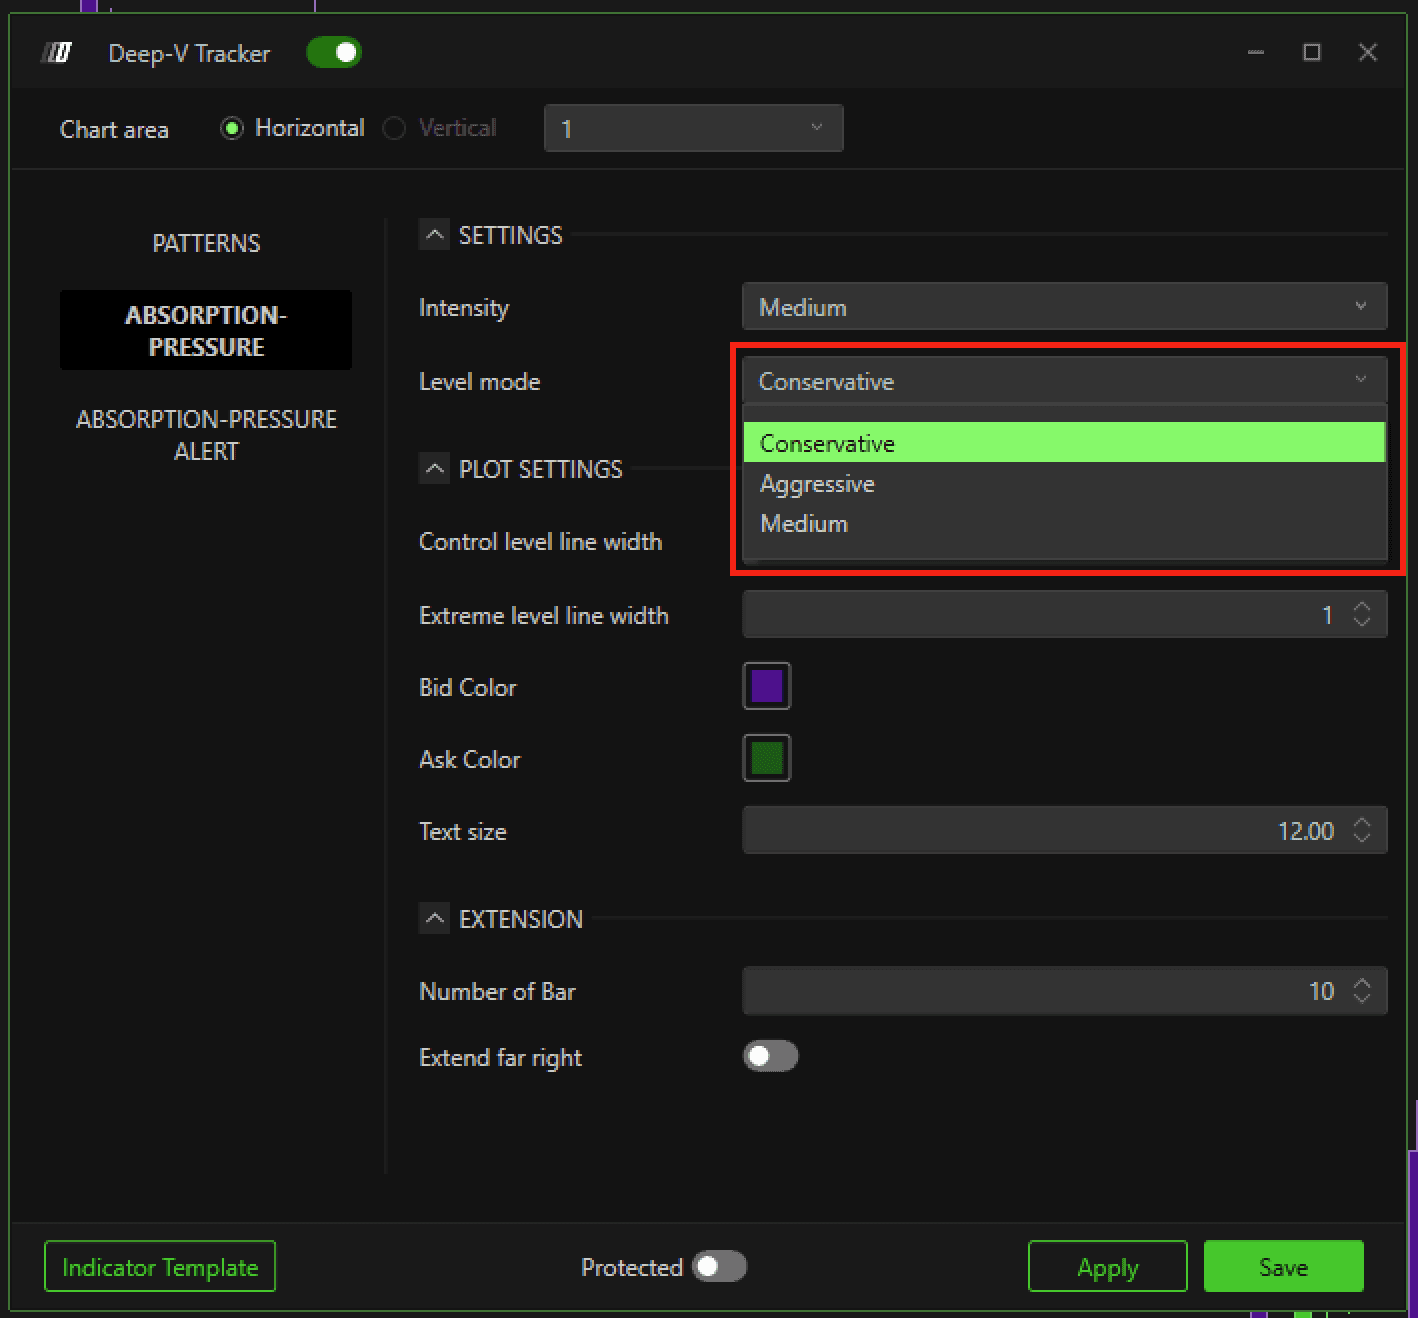
Conservative: Levels appear on solid structural zones
Medium: Balanced approach
Aggressive: May generate levels close to price, easier to violate
Additional settings:
Control/Extreme Line Width: Adjust thickness of lines
Bid/Ask Color: Customize seller/buyer line colors
Text Size: Adjust label size
Number of Bars: Defines line length in bars
Extend Far Right: Extends lines to the chart’s price scale
4. Absorption / Pressure Alerts
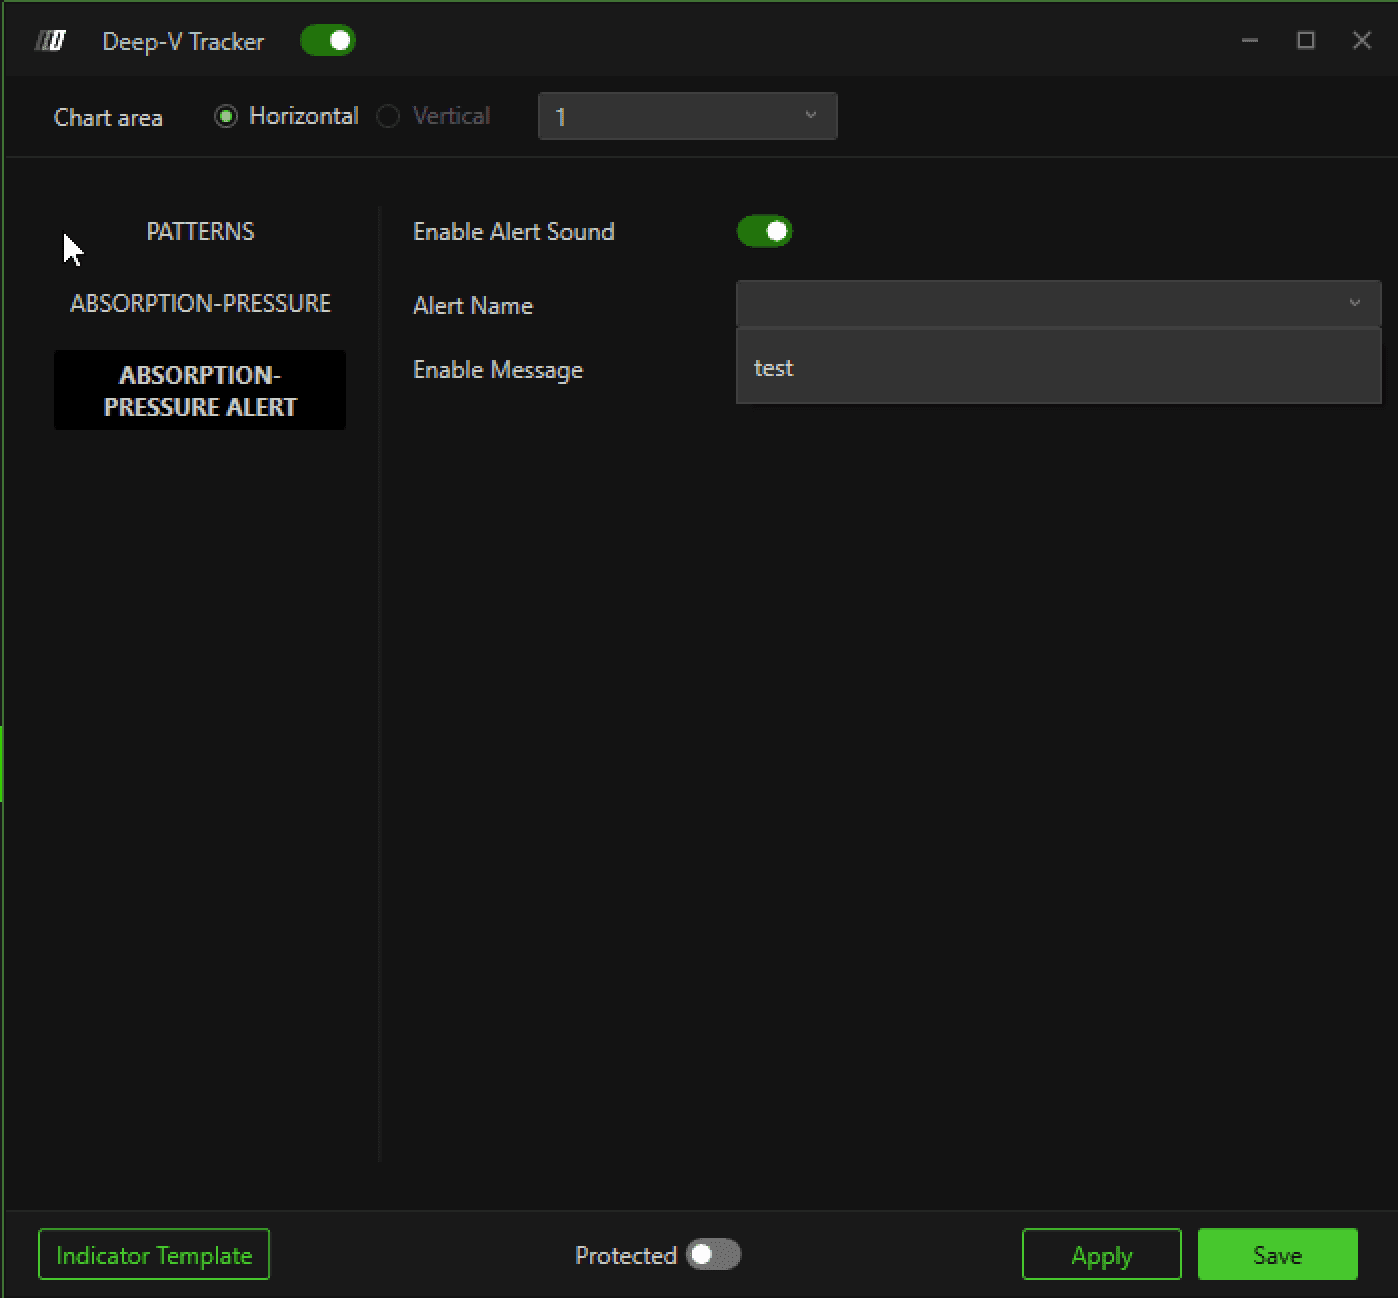
You can set alerts for any pattern, absorption, or pressure event:
Go to Options → Settings → Add Alert
Create a new alert
The alert will appear in the Deep V-Tracker list when triggered
Conclusion
The Deep V-Tracker gives traders actionable insights by combining price action patterns and volumetric order flow analysis. Key benefits include:
Identification of sudden acceleration in order flow
Detection of potential exhaustion points or slowdown points
Mapping of pressure and absorption zones with control and extreme levels
Fully customizable visual and alert settings
By mastering the Patterns and Absorption & Pressure modules, traders can pinpoint institutional activity and high-probability levels for entries and exits.