Deep Indicators
Updated:
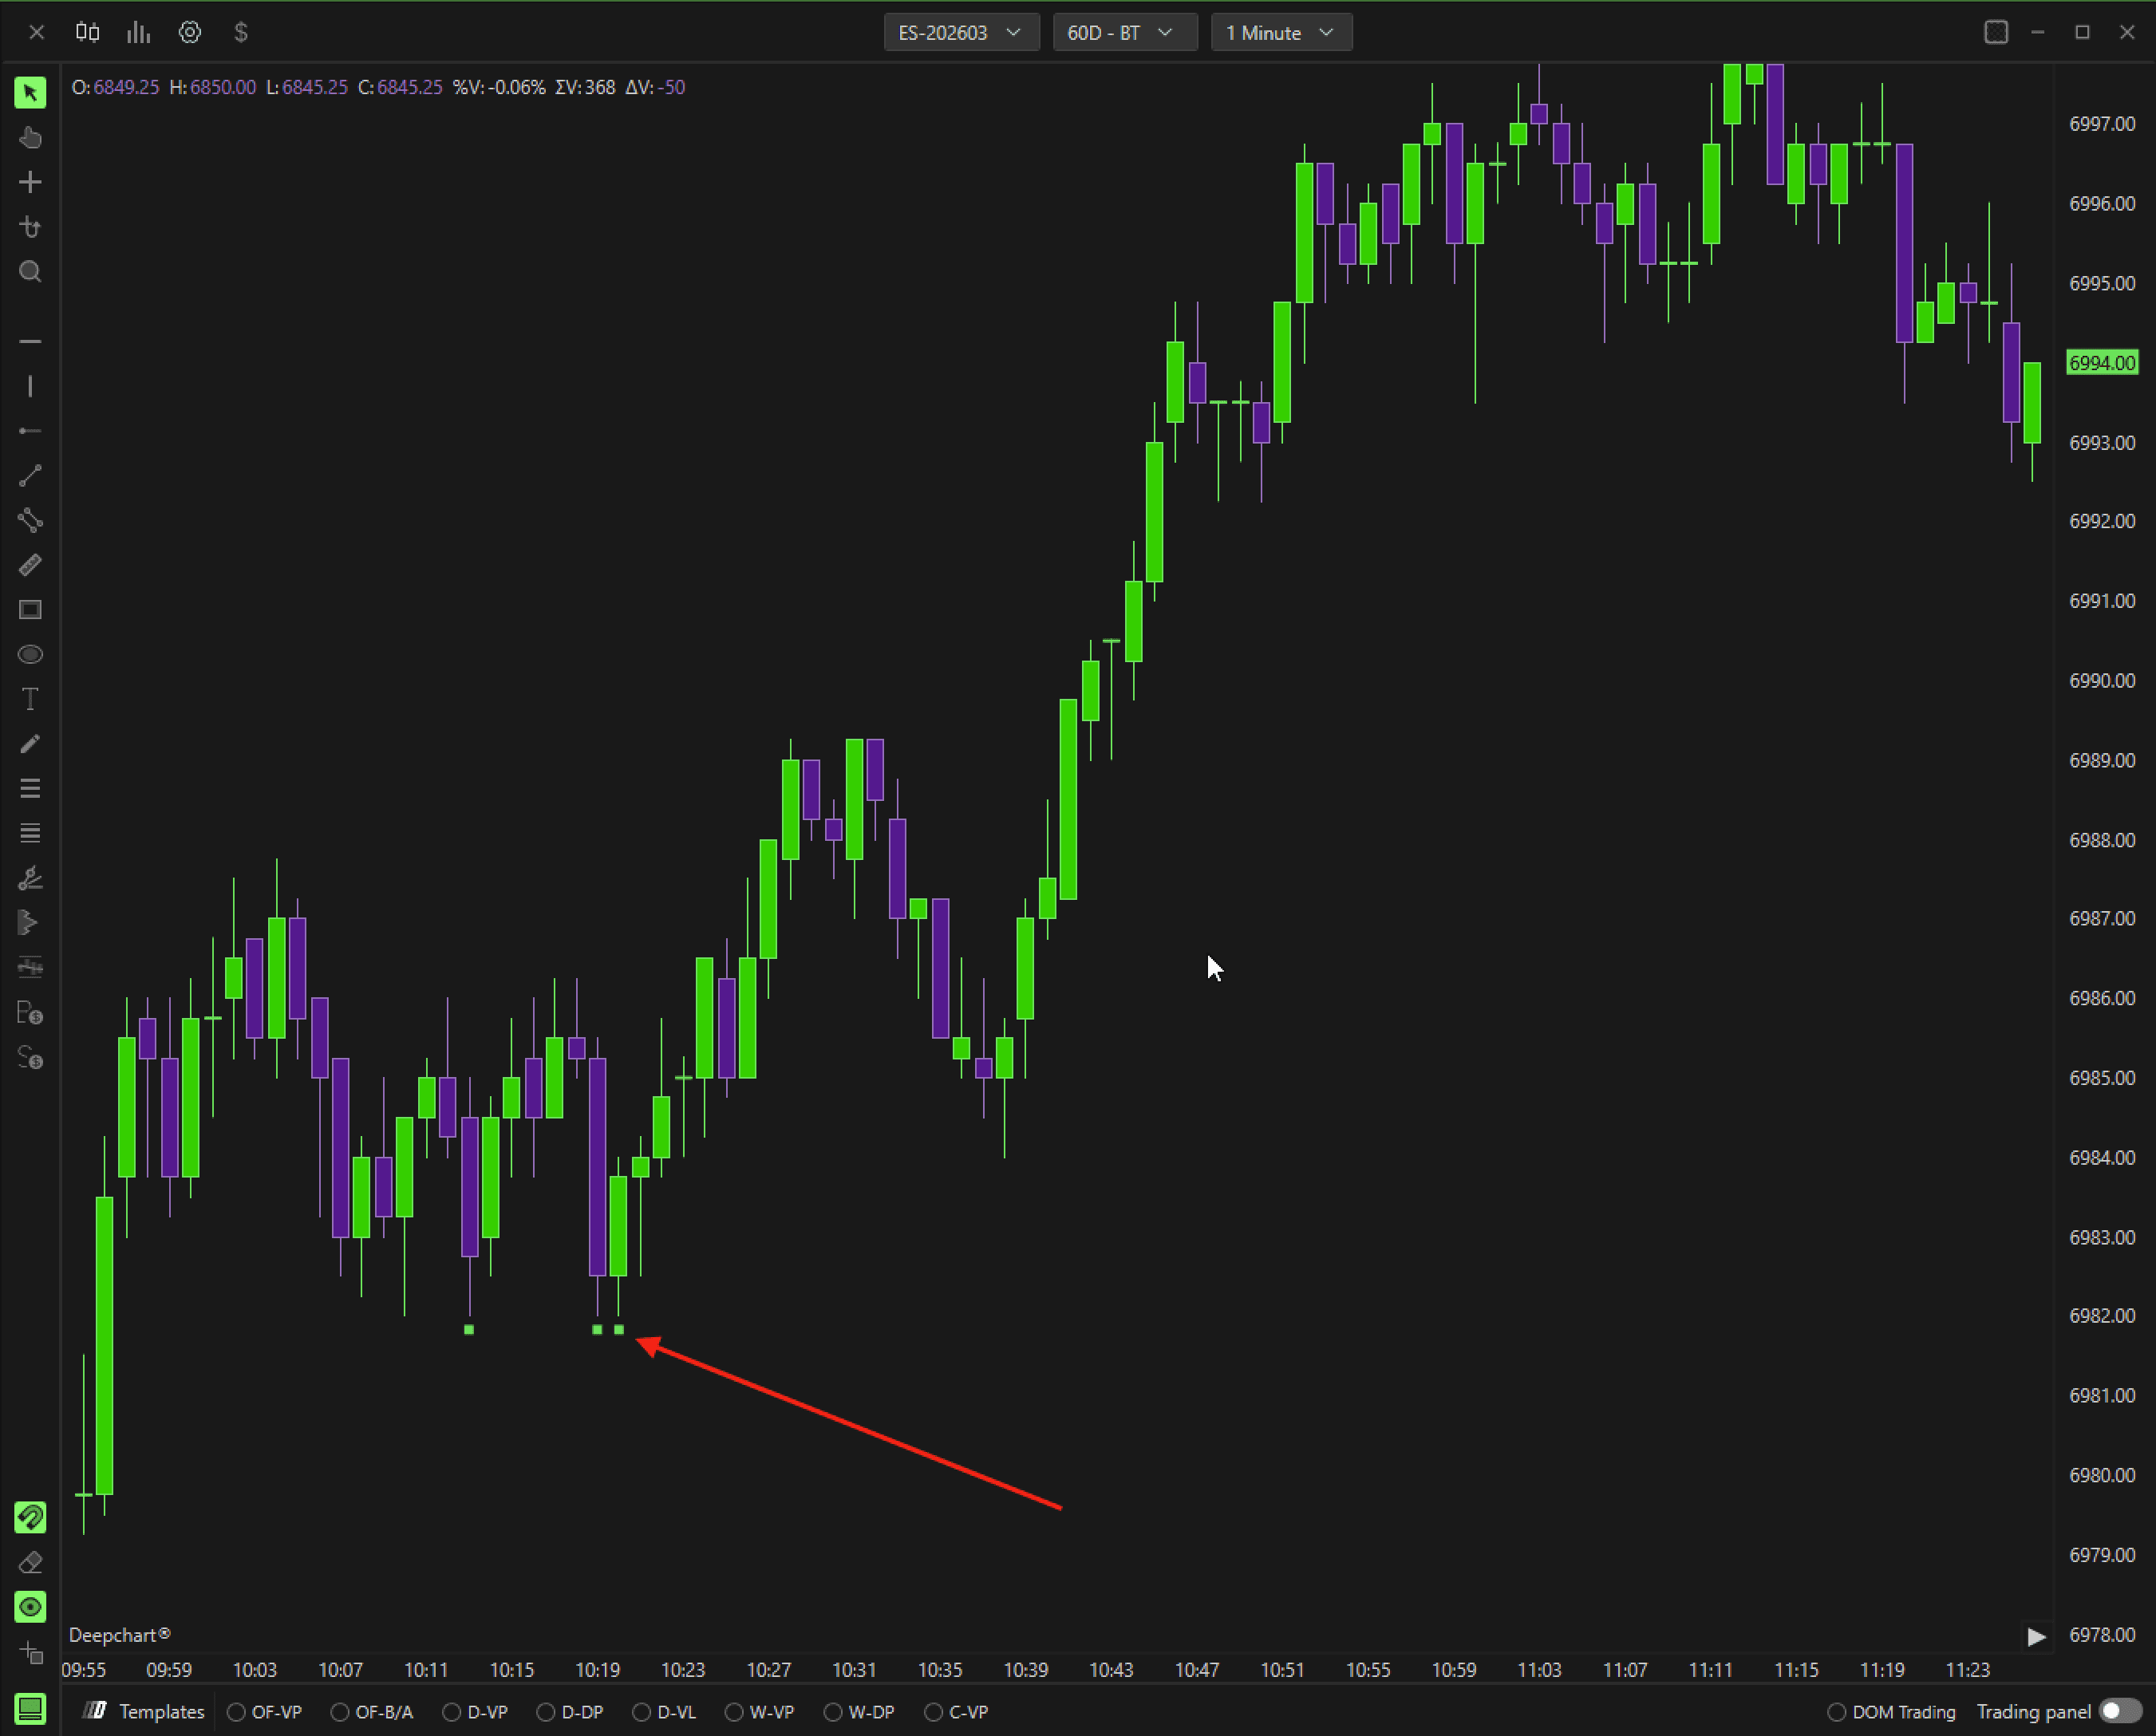
The Deep Wall is a specialized indicator developed by the Deepcharts team specifically for ES charts. It is designed to monitor price behavior at key levels and detect the presence of passive order walls that absorb aggressive orders, causing price rejection.
This behavior often signals the presence of a hidden (iceberg) order. Unlike other patterns, Deep Wall does not appear frequently—it is mostly seen in low-liquidity environments such as the London session, appearing only a few times per week or month.
1. Applying Deep Wall
Open the Indicator List on your chart.
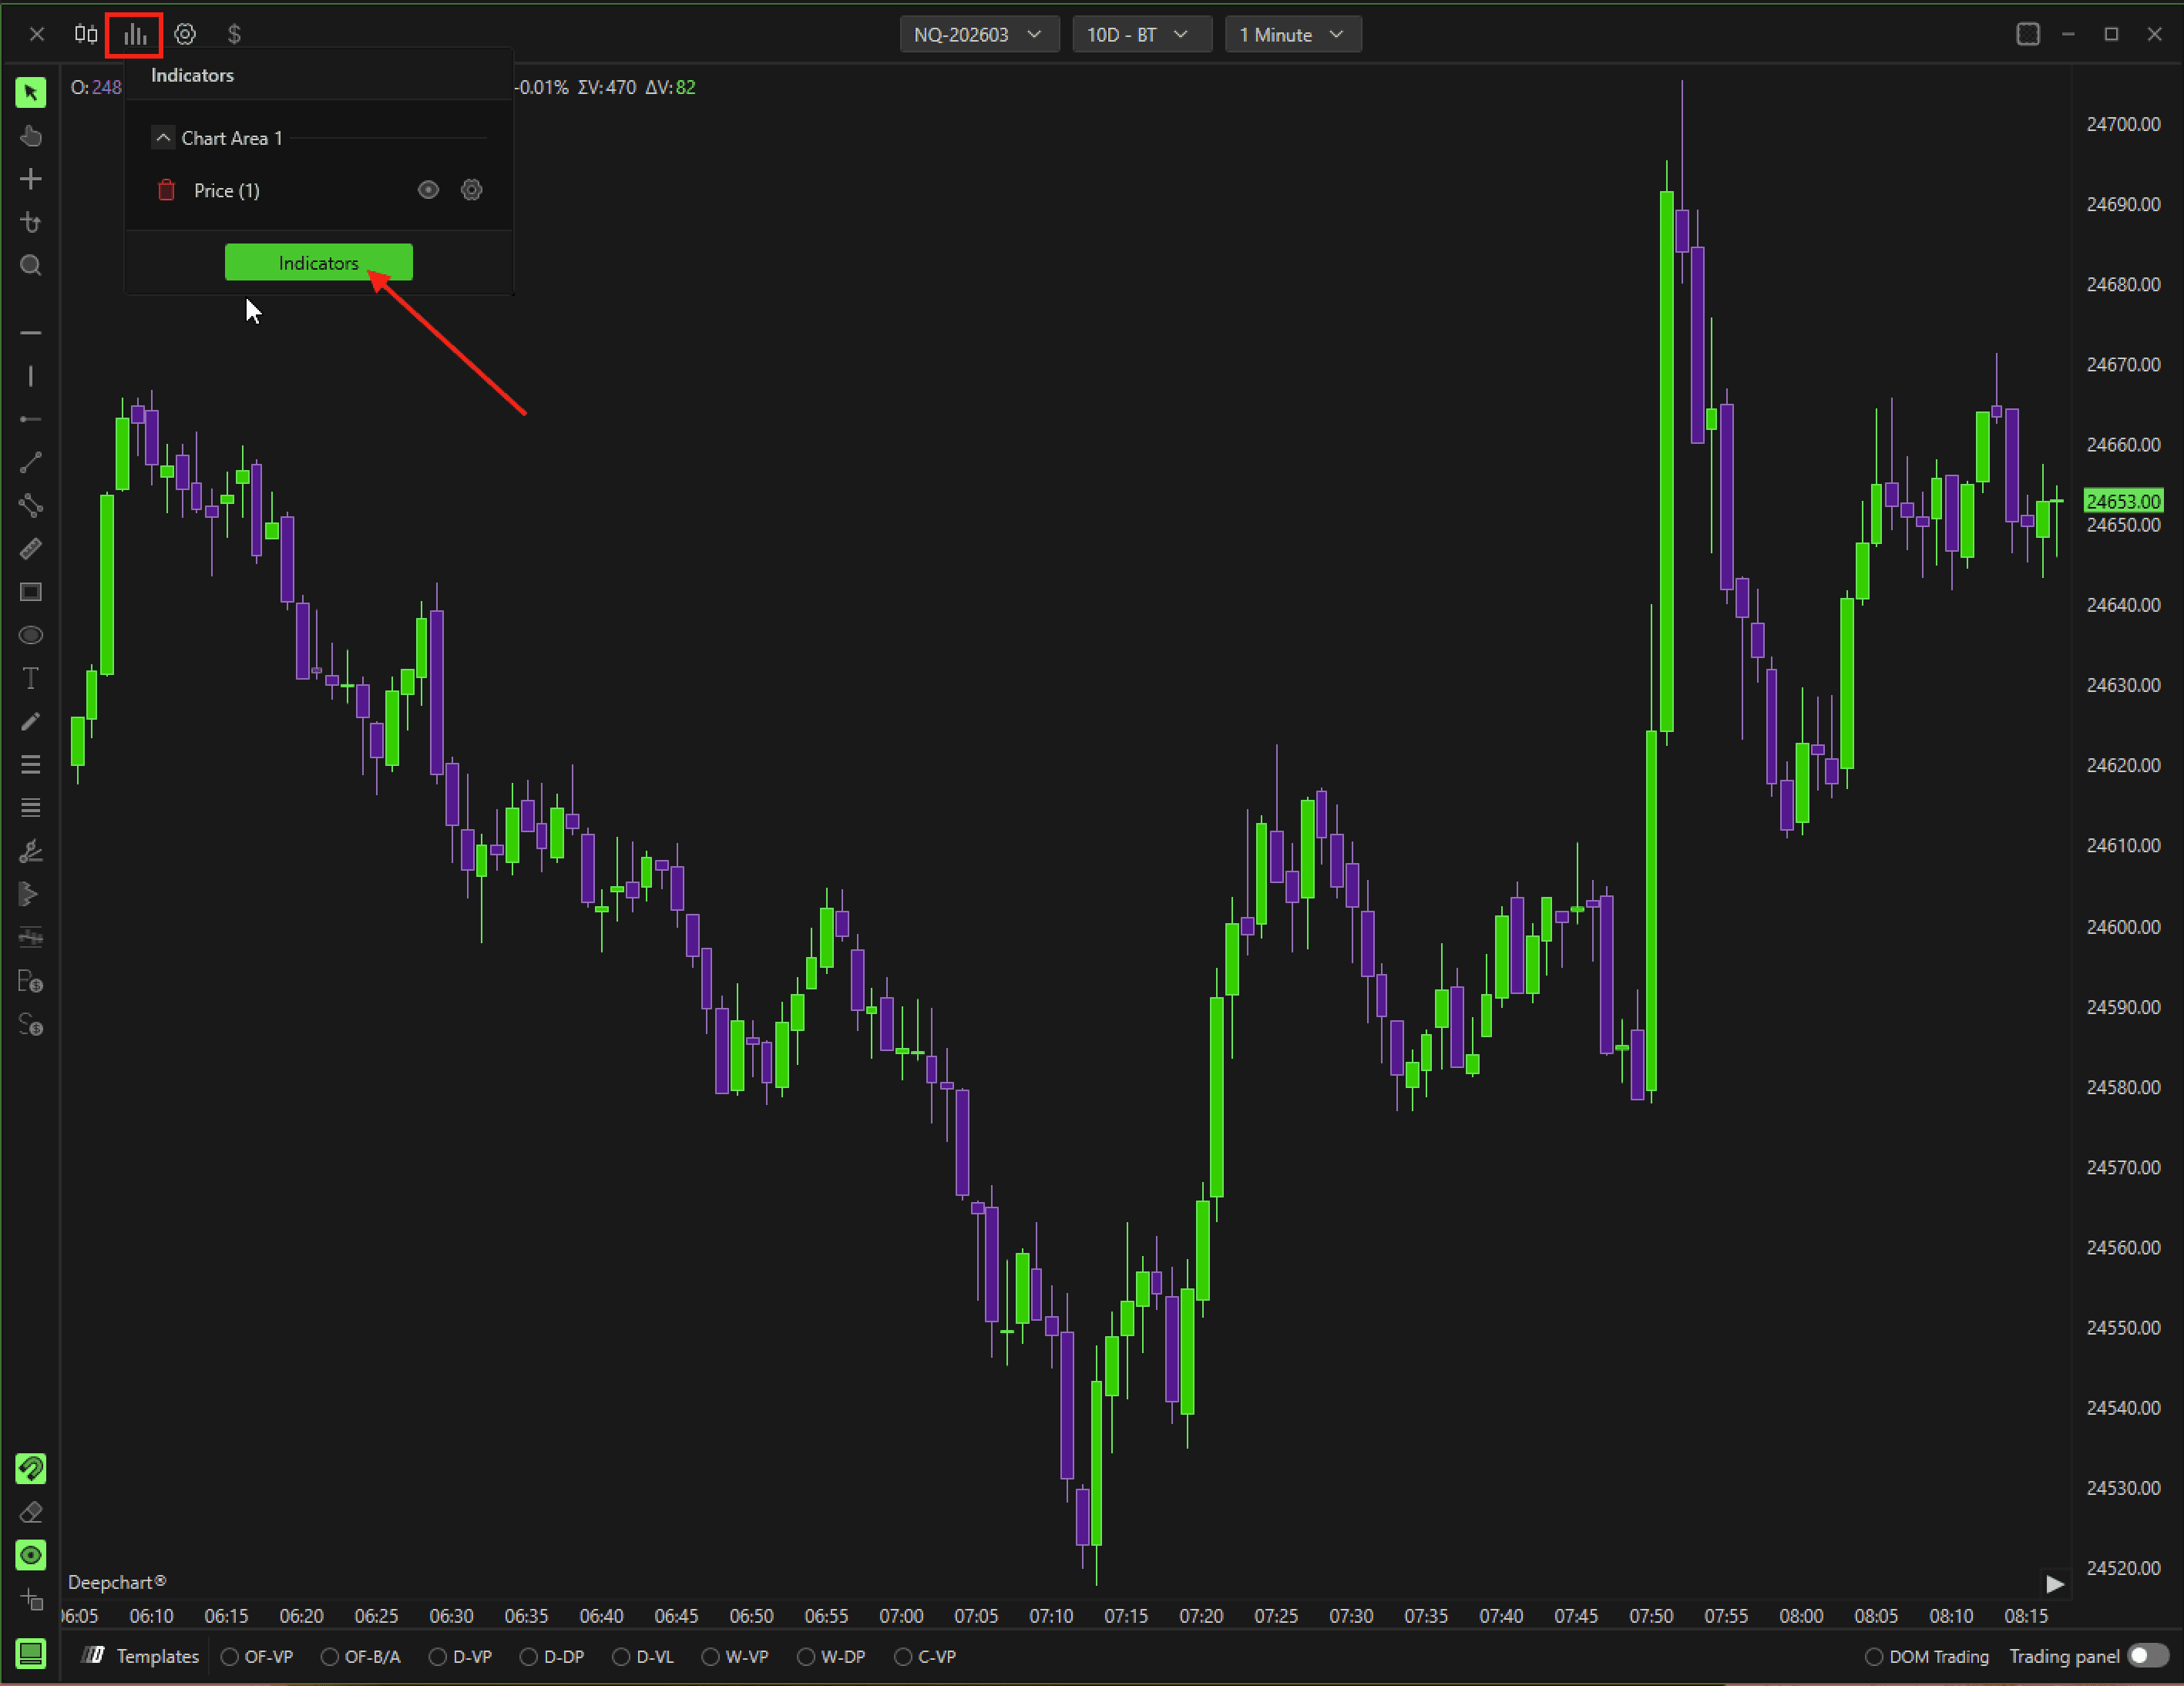
Locate Deep Wall and click + to add it to your chart.
Click the Settings icon next to Deep Wall to configure the indicator.
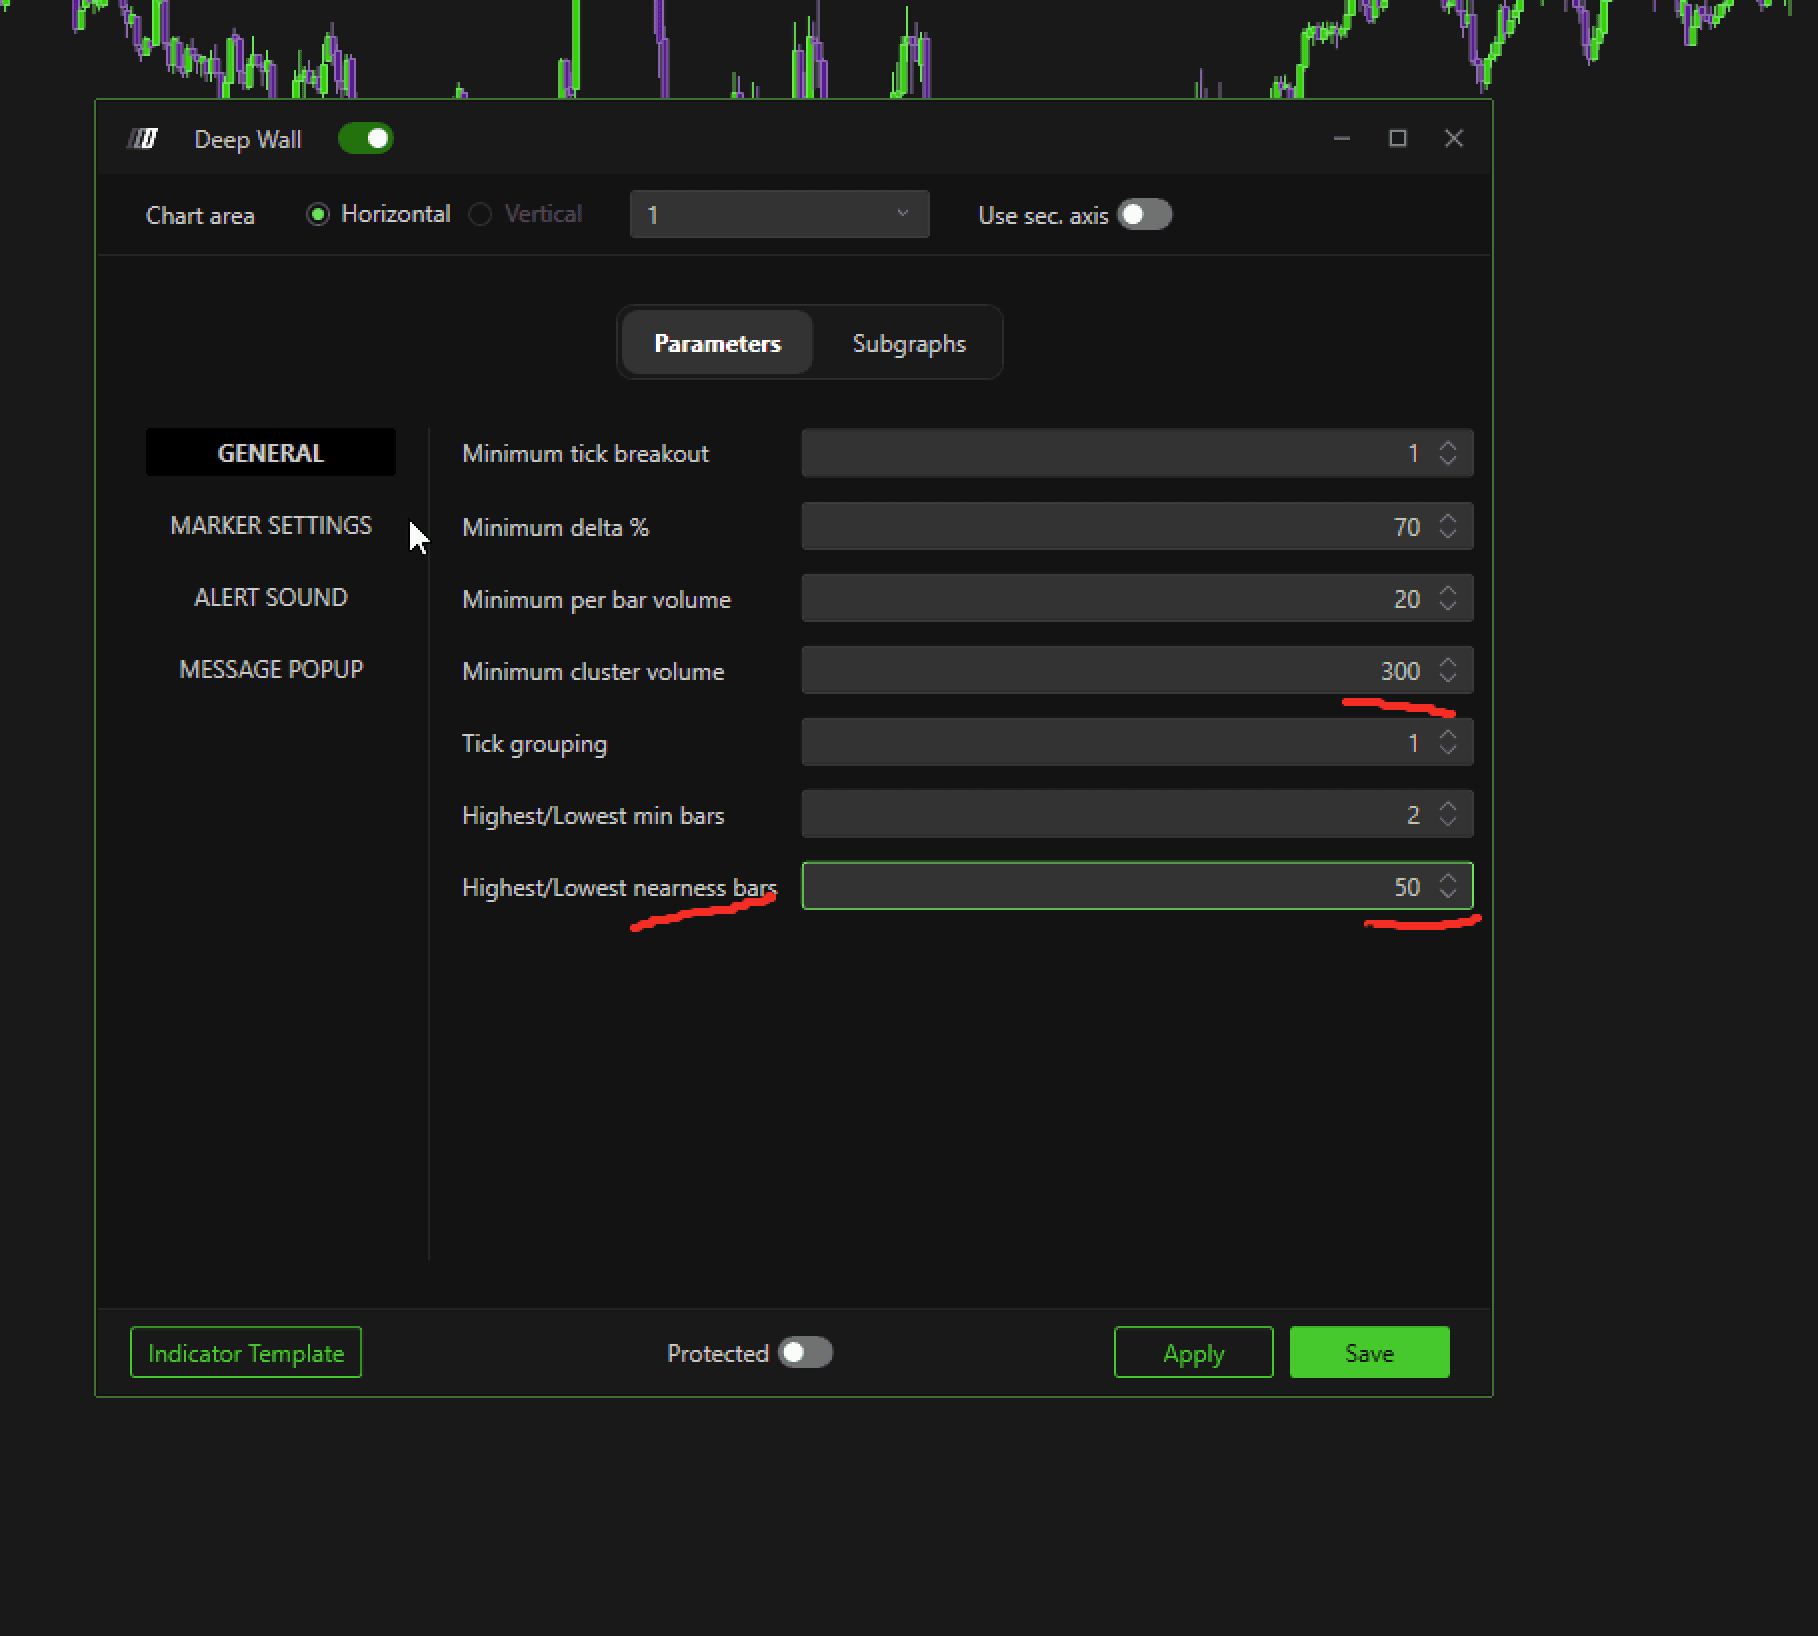
2. Settings
The recommended general settings for optimal usage are as follows:
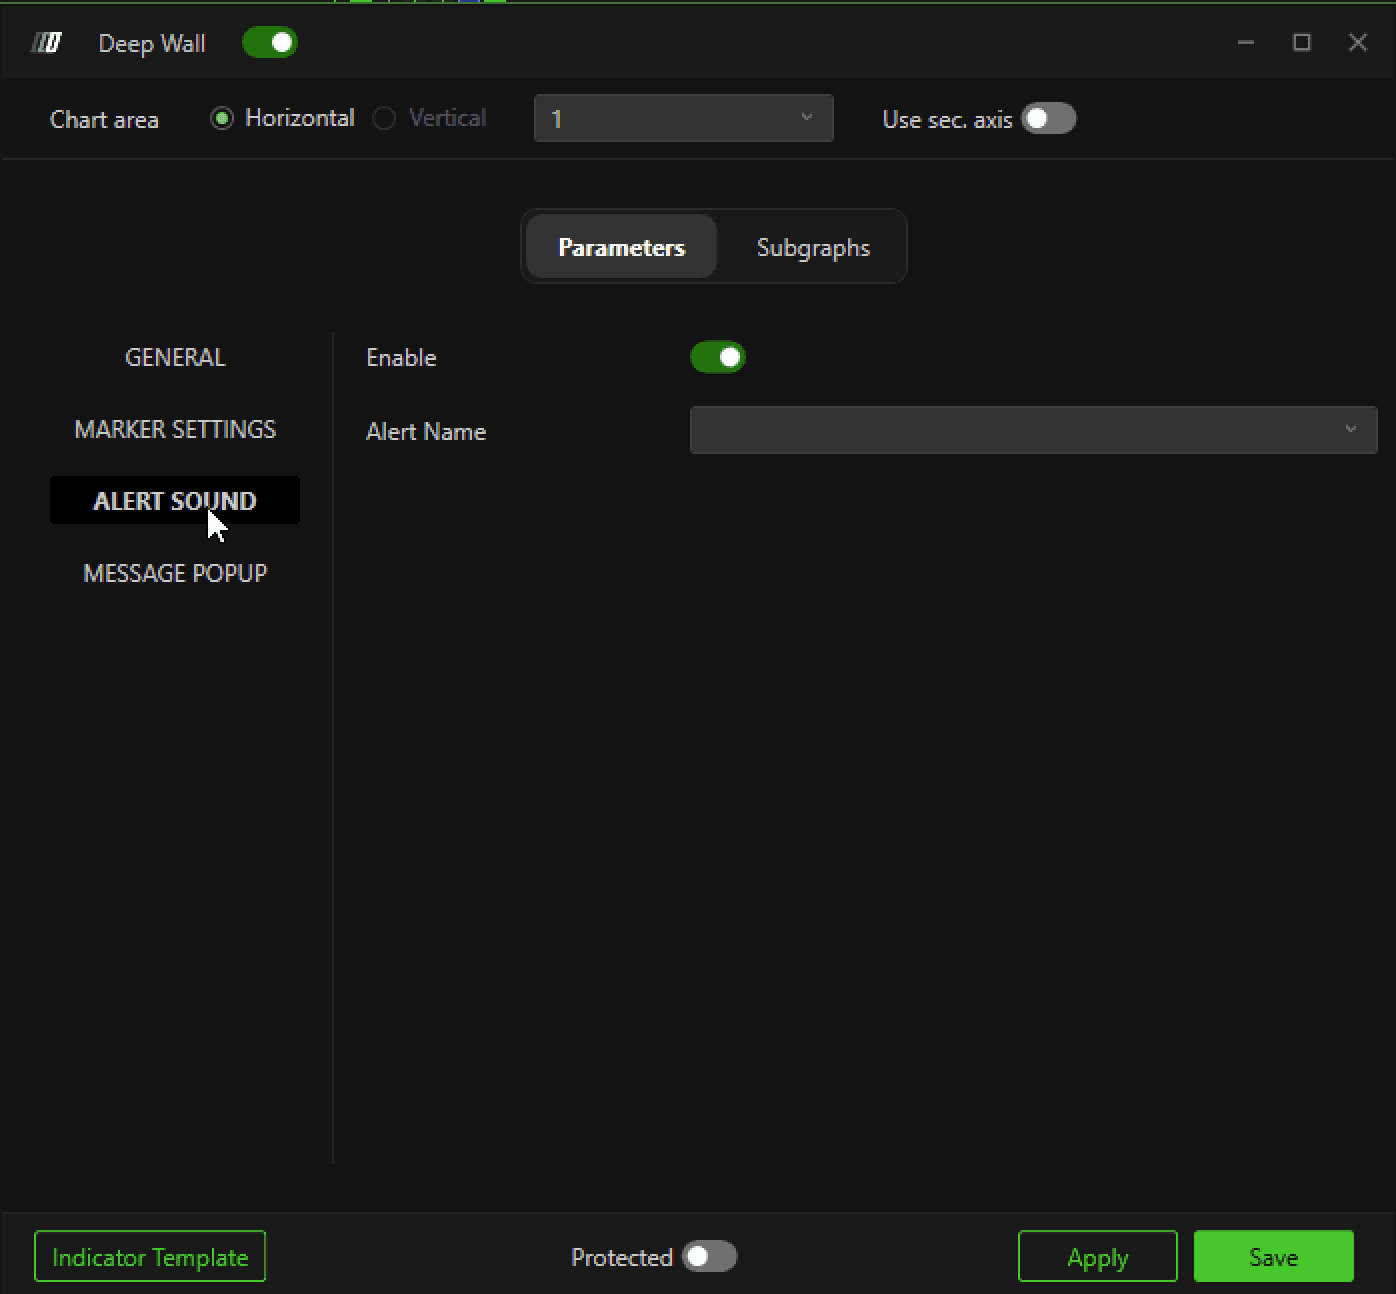
Alert Sound
You can configure a sound alert for Deep Wall events.
To see alerts in the list, navigate to:
Options → Settings → Add AlertAdd the desired alert here, and it will appear in the alert list.
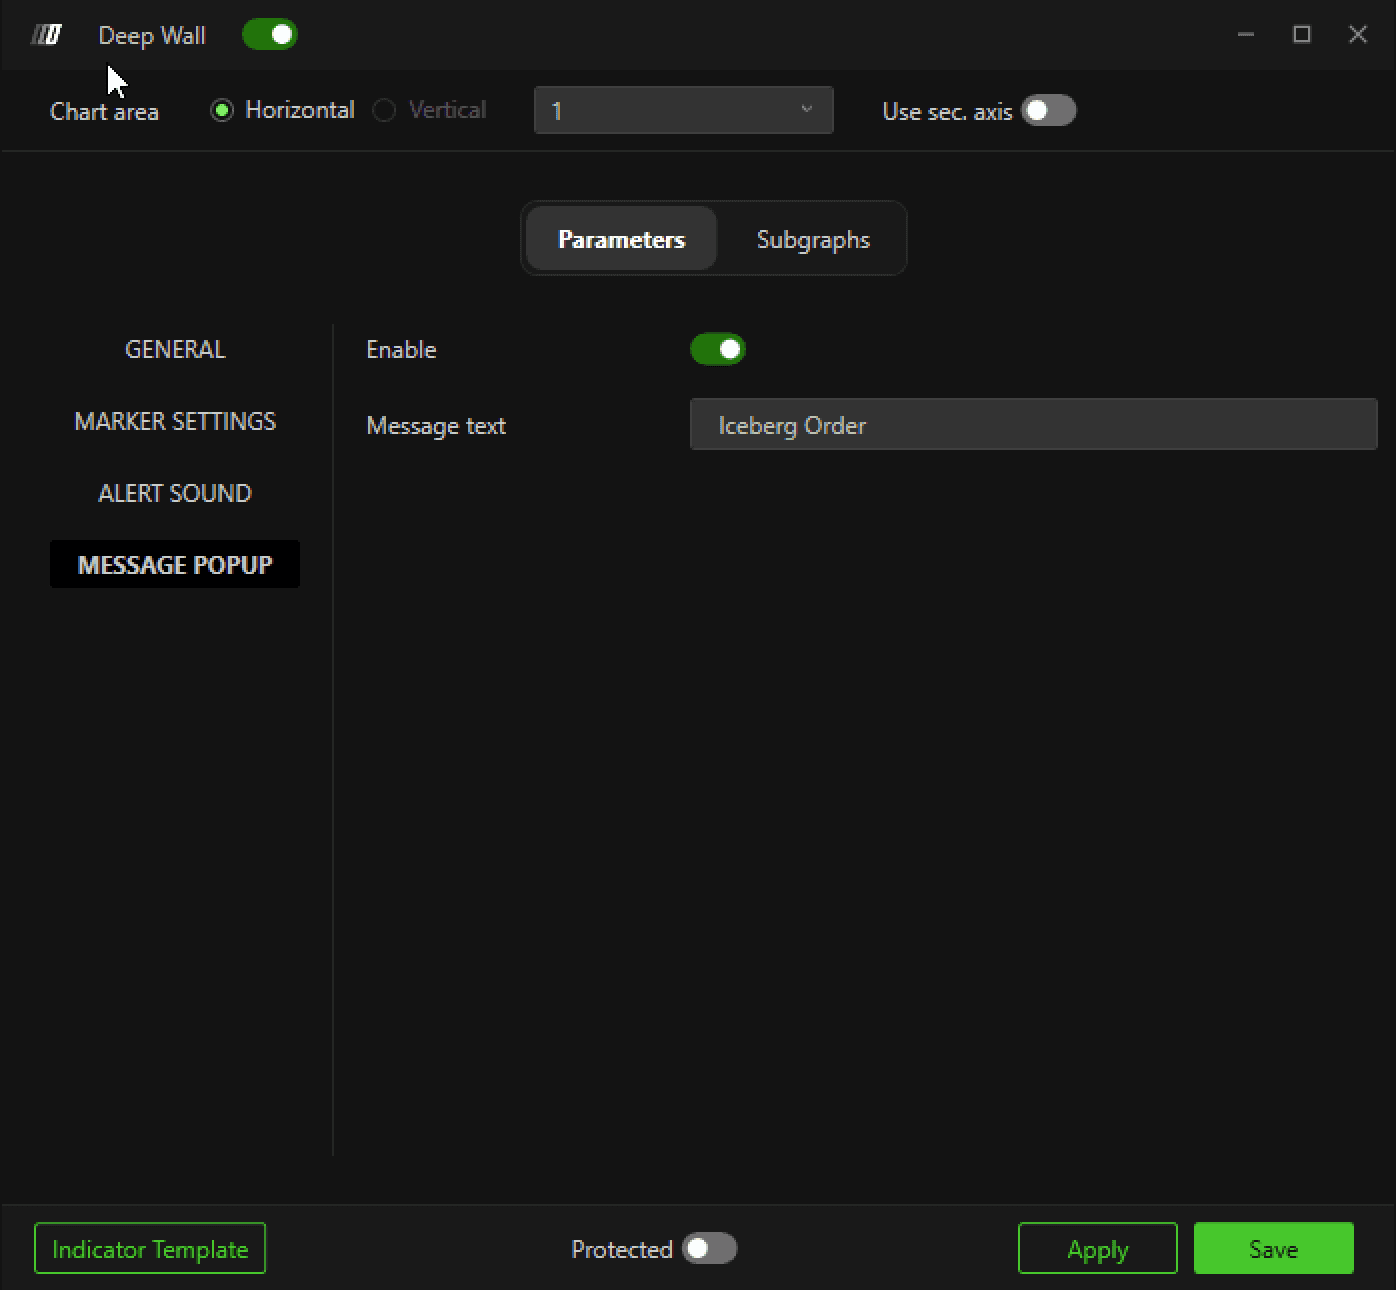
Message Popup
You can also configure a popup message when a Deep Wall event is triggered. This helps ensure you never miss a high-probability iceberg detection.
Summary
The Deep Wall indicator is a precise tool for detecting key liquidity imbalances on ES charts. By highlighting areas where passive orders absorb aggressive flow, traders can identify iceberg orders and anticipate potential price rejections. Its rarity and specificity make it a valuable signal, especially in low-liquidity sessions like London.
Use Case: Detect hidden liquidity and high-probability price reversals.
Frequency: Appears few times per week/month, primarily in low-liquidity periods.