Indicators

Updated:

Feb 21, 2026

How to Change the Layout of Indicators

How to Change the Layout of Indicators

No headings found on page

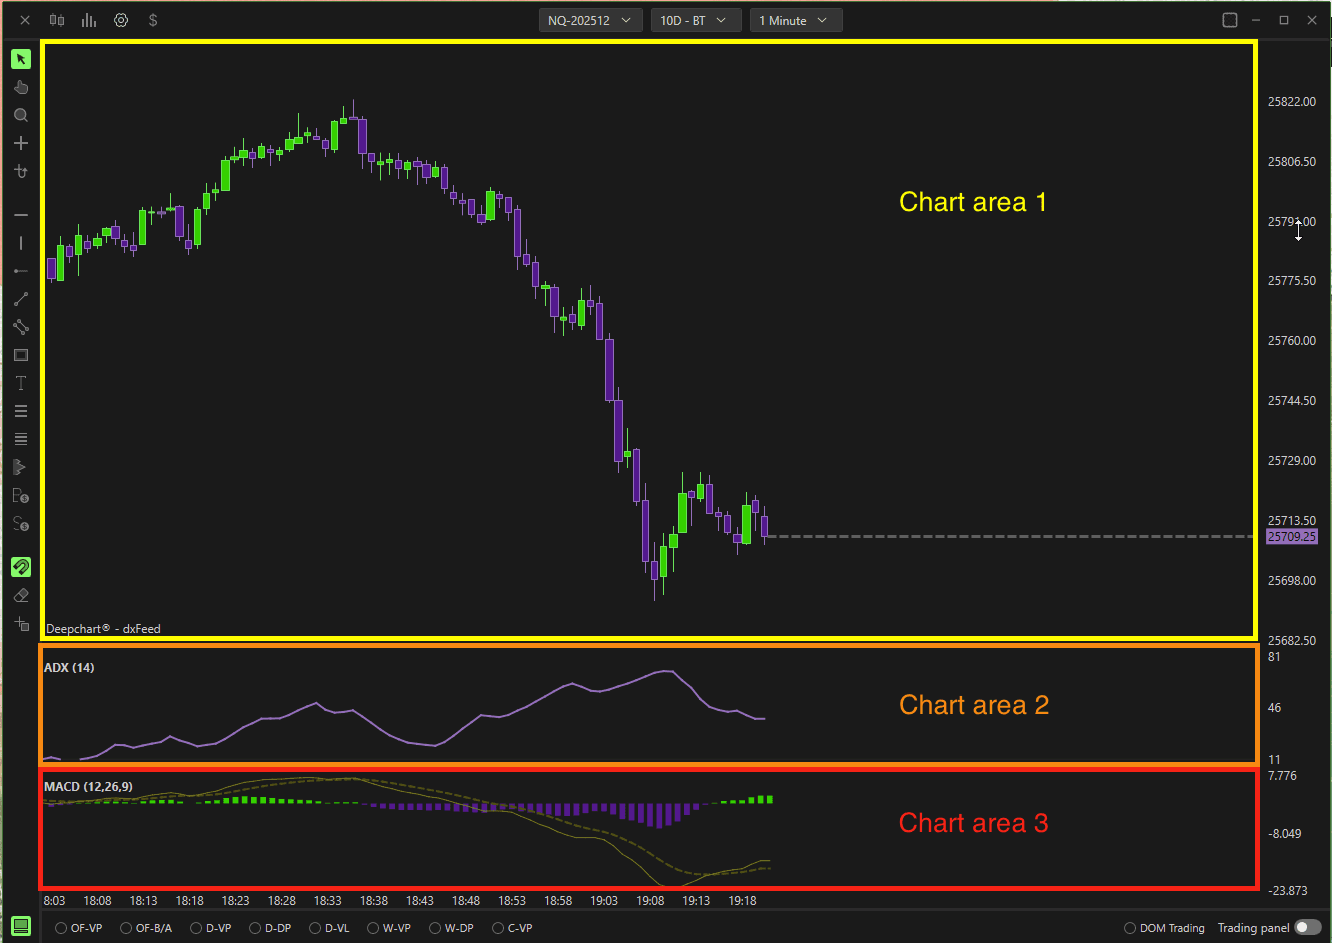
Your DeepCharts window is divided into sections based on the number of indicators you’re using.
For example, if you’re using two indicators — ADX and MACD, your window will be divided into three chart areas:

  1. One for the price chart.

  2. One for the ADX indicator.

  3. One for the MACD indicator 

as shown in the image below.

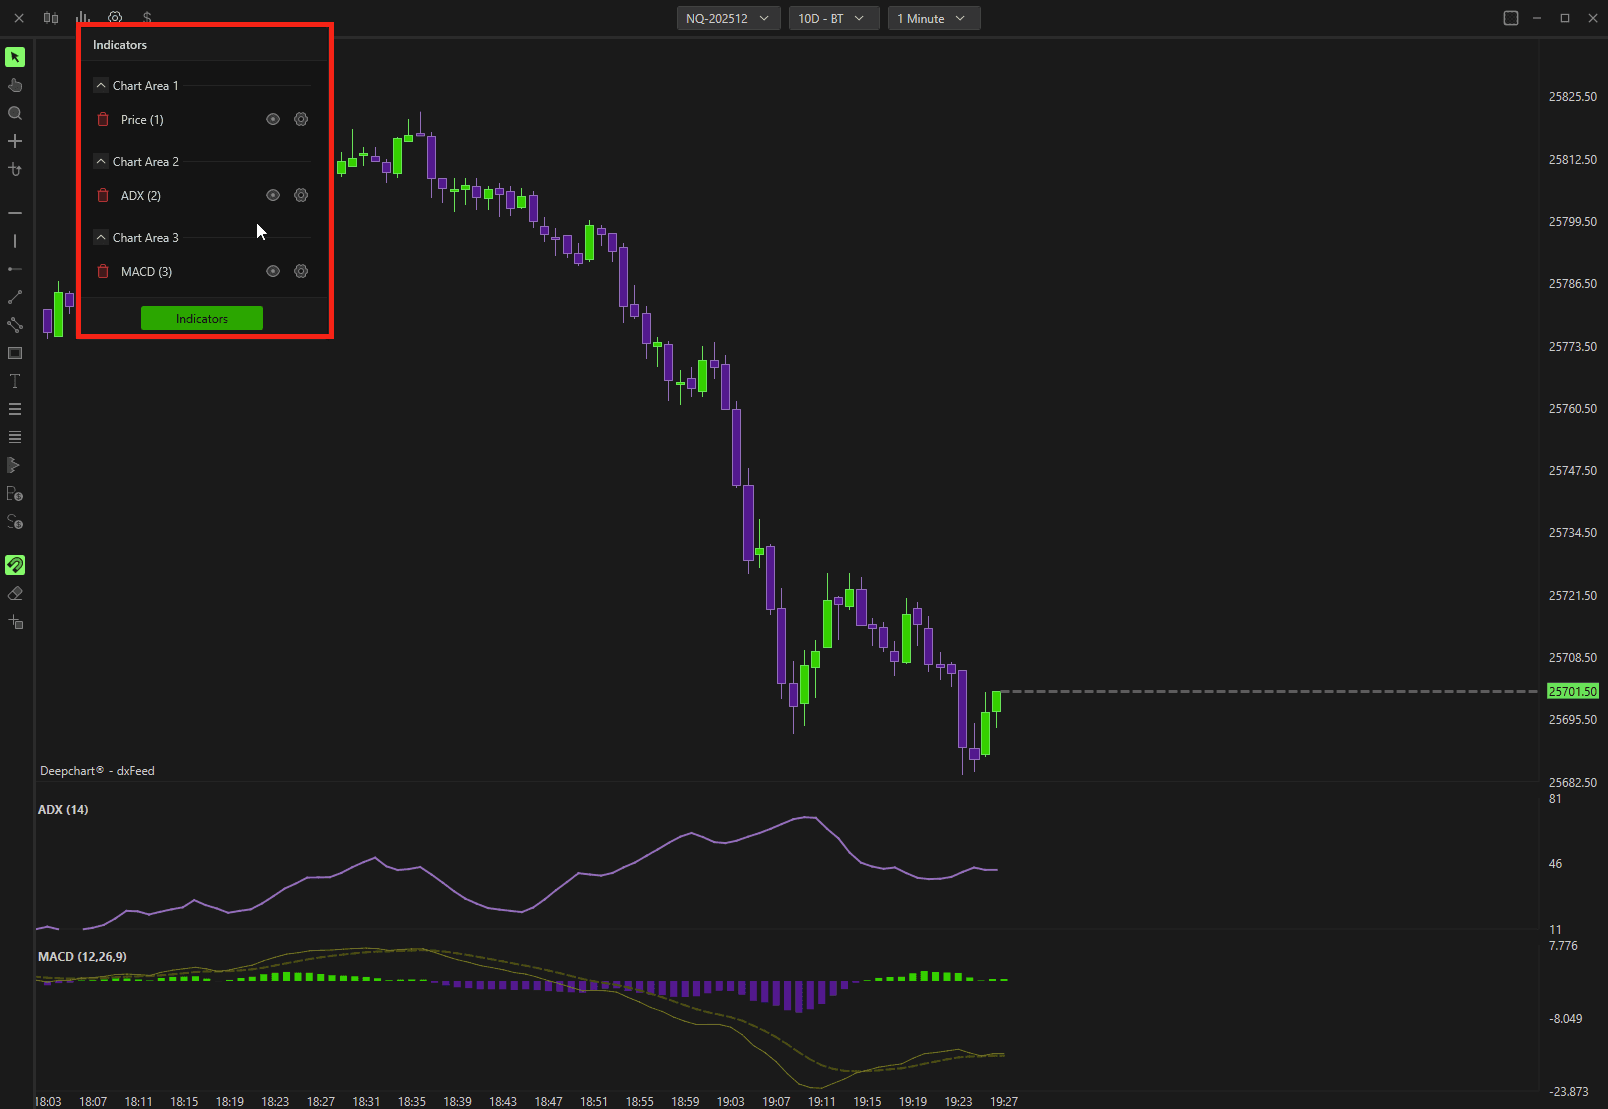
You can check which chart area each indicator is assigned to by clicking the Indicators button.
A dropdown menu will appear showing all the indicators along with their respective chart areas, as shown below.

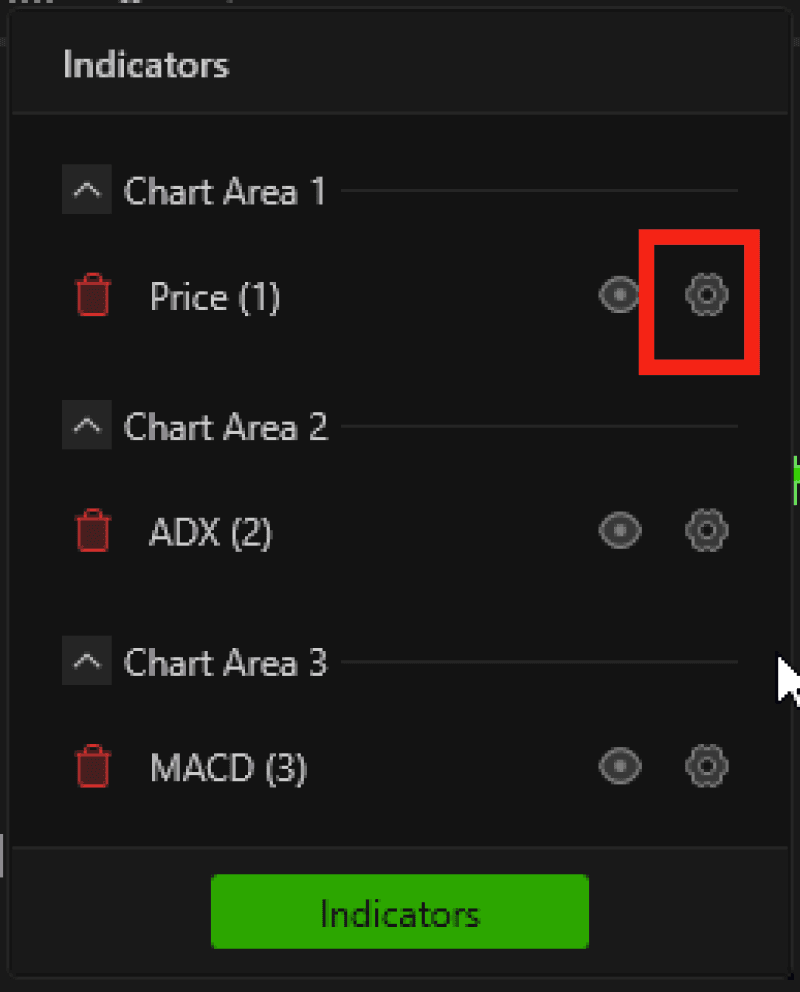
To change the chart area of any indicator and adjust the layout, open the indicator settings and select a different chart area, as demonstrated below.

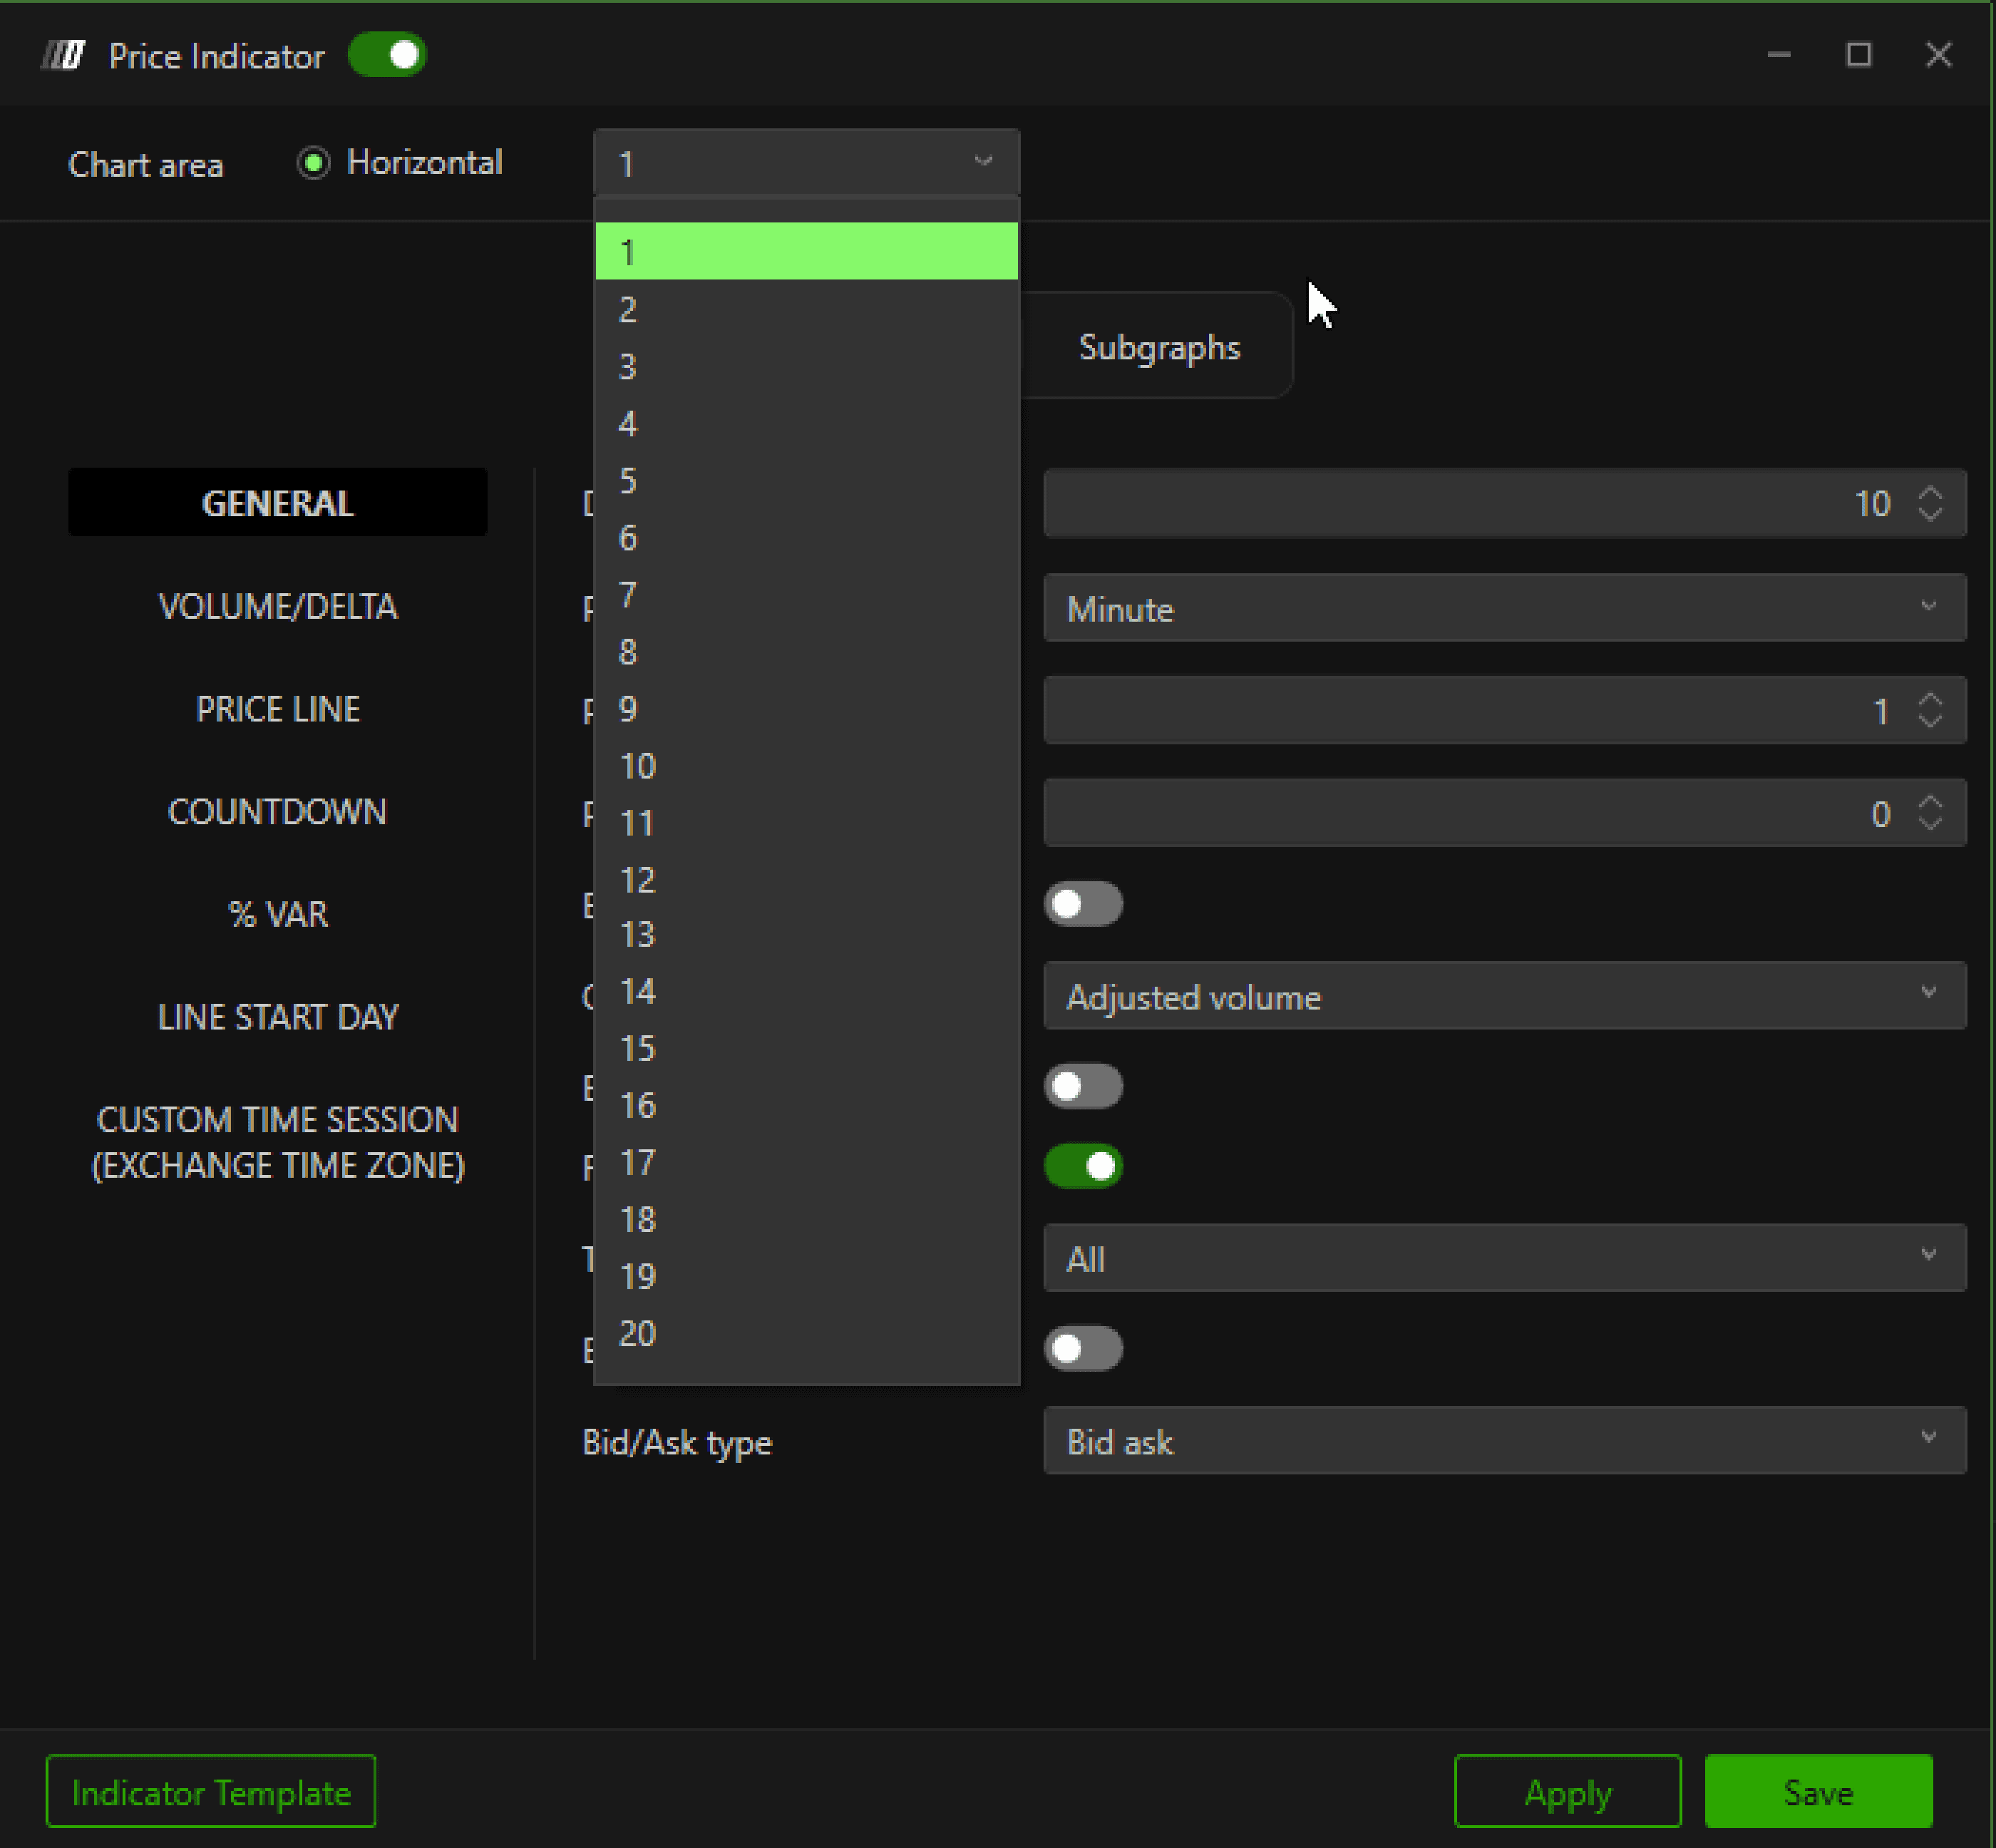
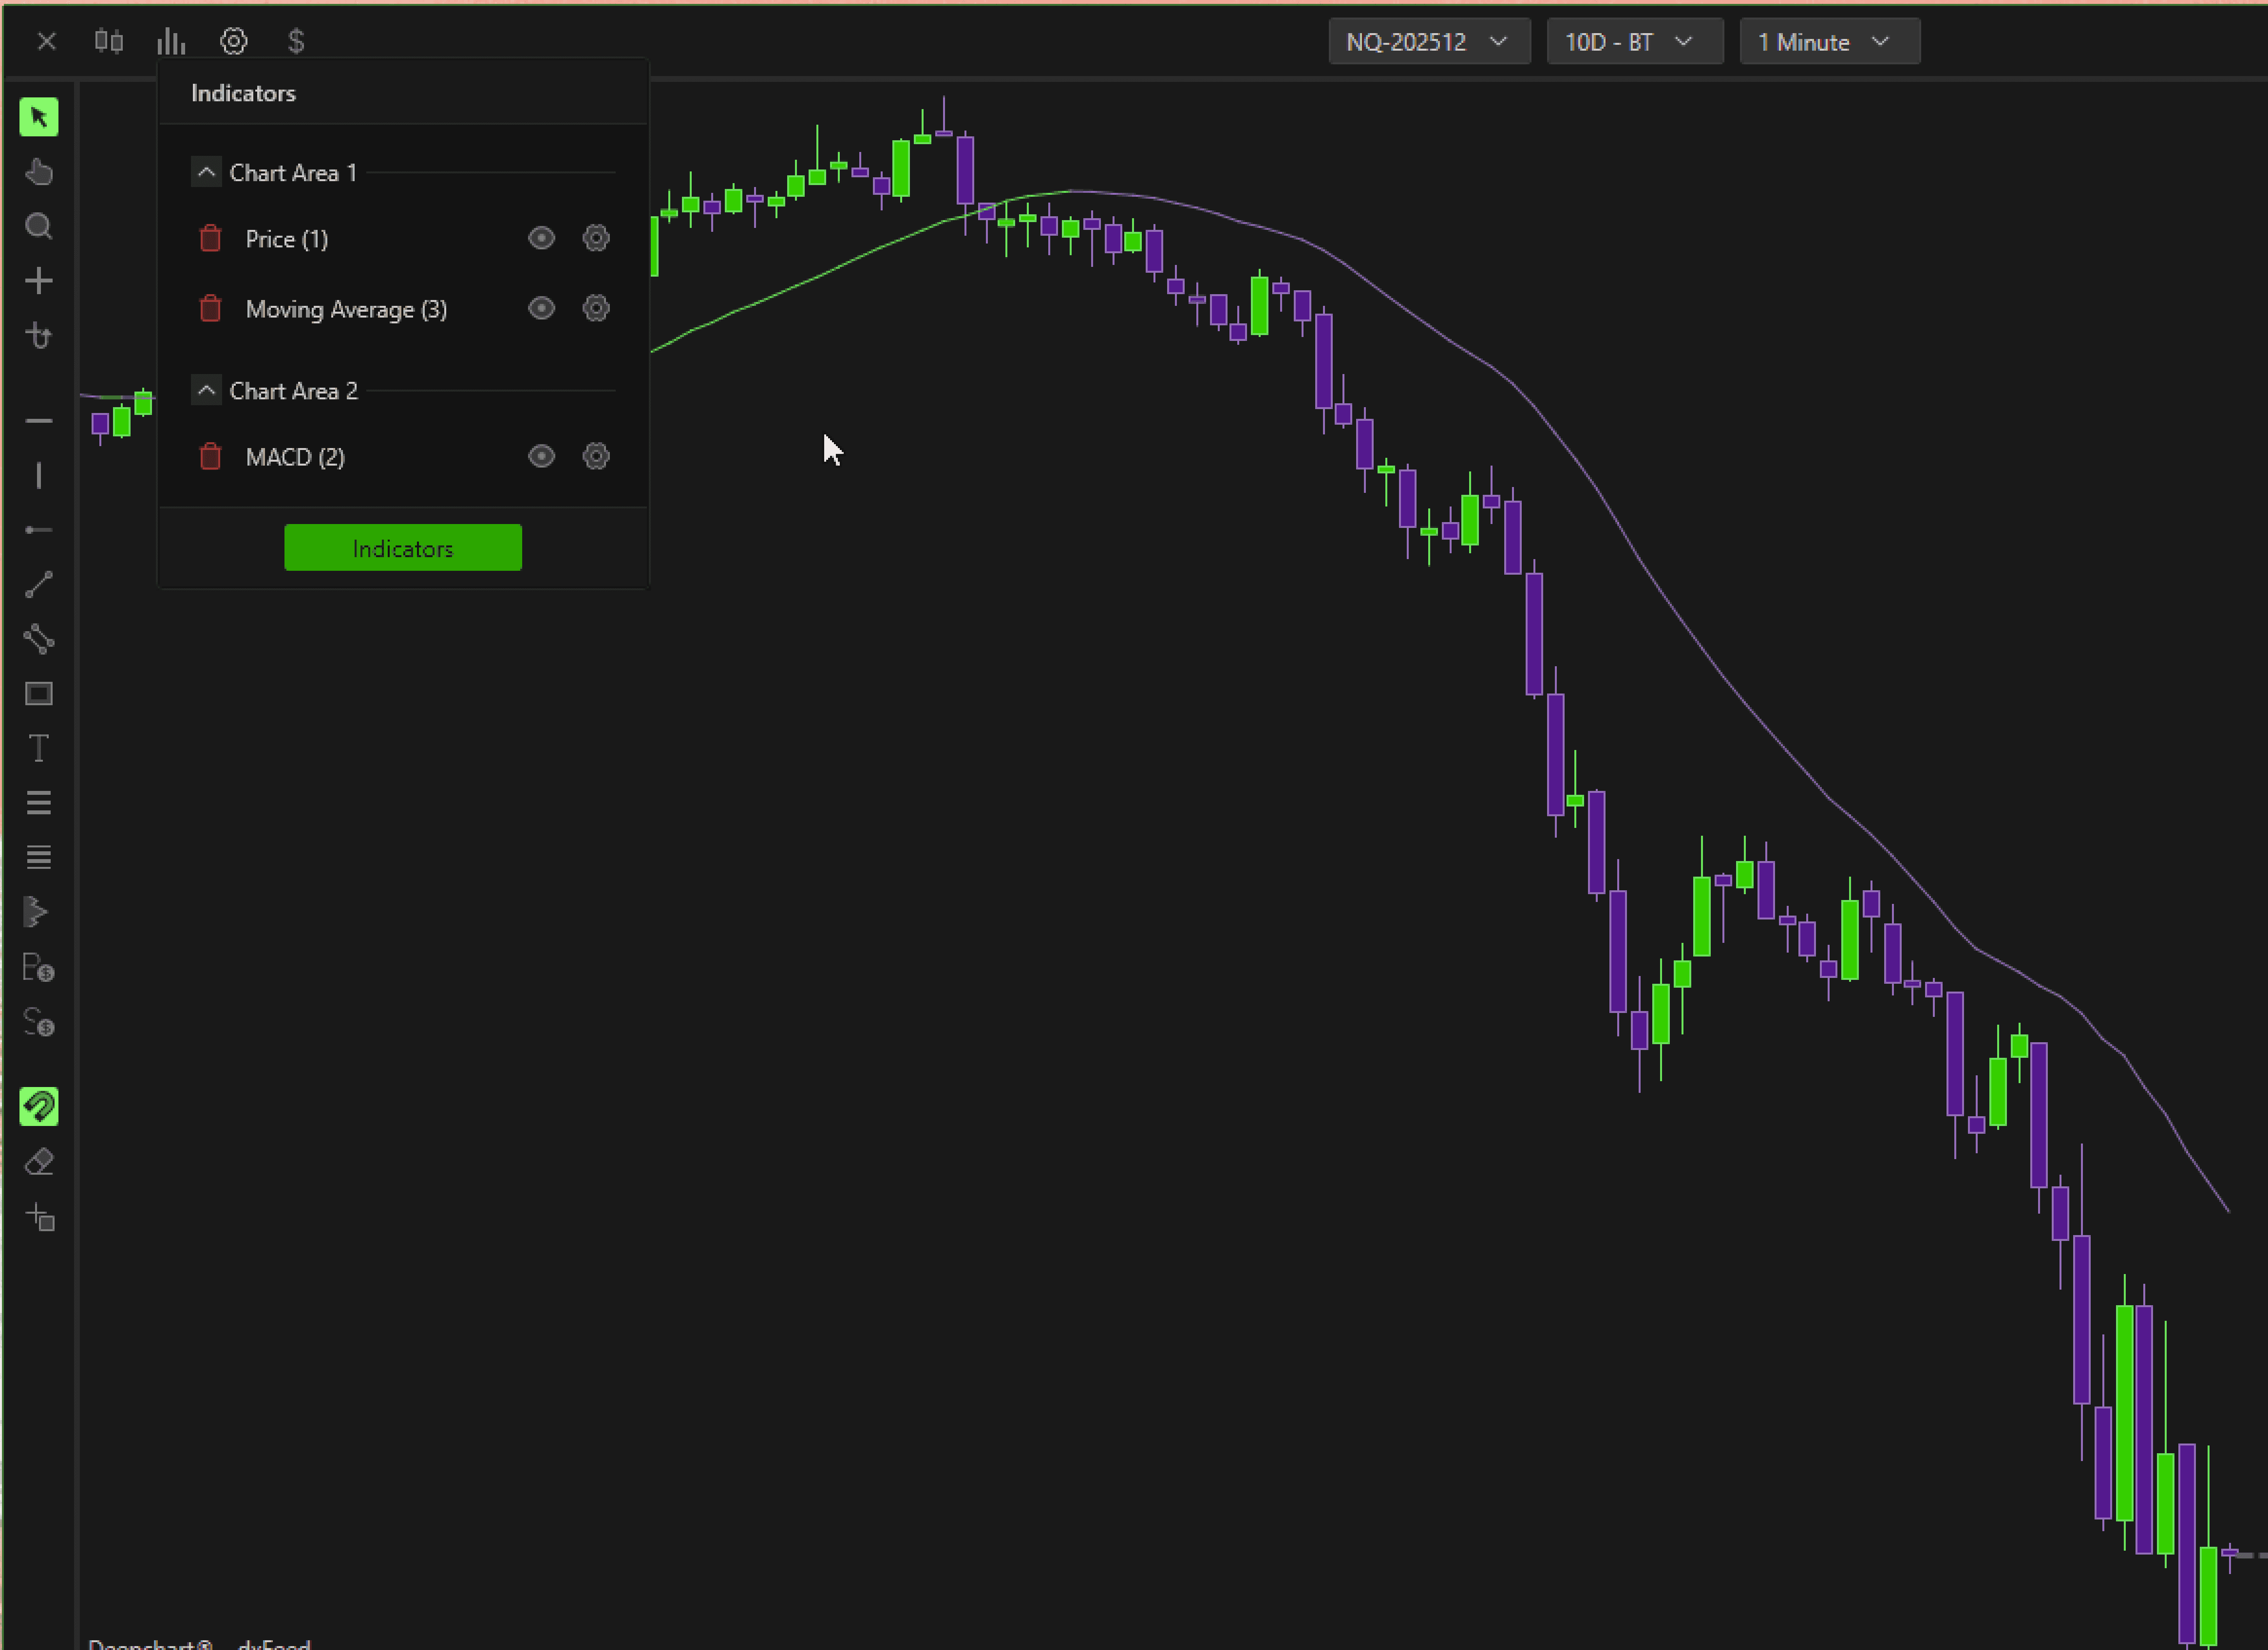
You can also merge two indicators into the same chart area by assigning them the same area number.
For example, in the image below, both the Price and Moving Average indicators are displayed together in the same chart area 1.

Tools for futures, currency & options involves substantial risk & is not appropriate for everyone. Only risk capital should be used for trading.

Testimonials appearing on this website may not be representative of other clients or customers and is not a guarantee of future performance or success.

Tools for futures, currency & options involves substantial risk & is not appropriate for everyone. Only risk capital should be used for trading. Testimonials appearing on this website may not be representative of other clients or customers and is not a guarantee of future performance or success.

Deepcharts © 2026 All right reserved