Indicators
Updated:
Overview
The Advanced DOM (Depth of Market) in Deepchart provides a powerful, professional-grade interface for order execution, market depth analysis, and volume profiling.
This article explains how to open the Advanced DOM, understand its layout, and configure it for optimal trading use.
Opening the Advanced DOM
Open the Deepchart platform and connect your data feed.
Navigate to New → Book → ADV DOM.
Select the desired instrument from your list of subscribed symbols.
Click Select to open the Advanced DOM.
Example: ES (E-mini S&P 500).
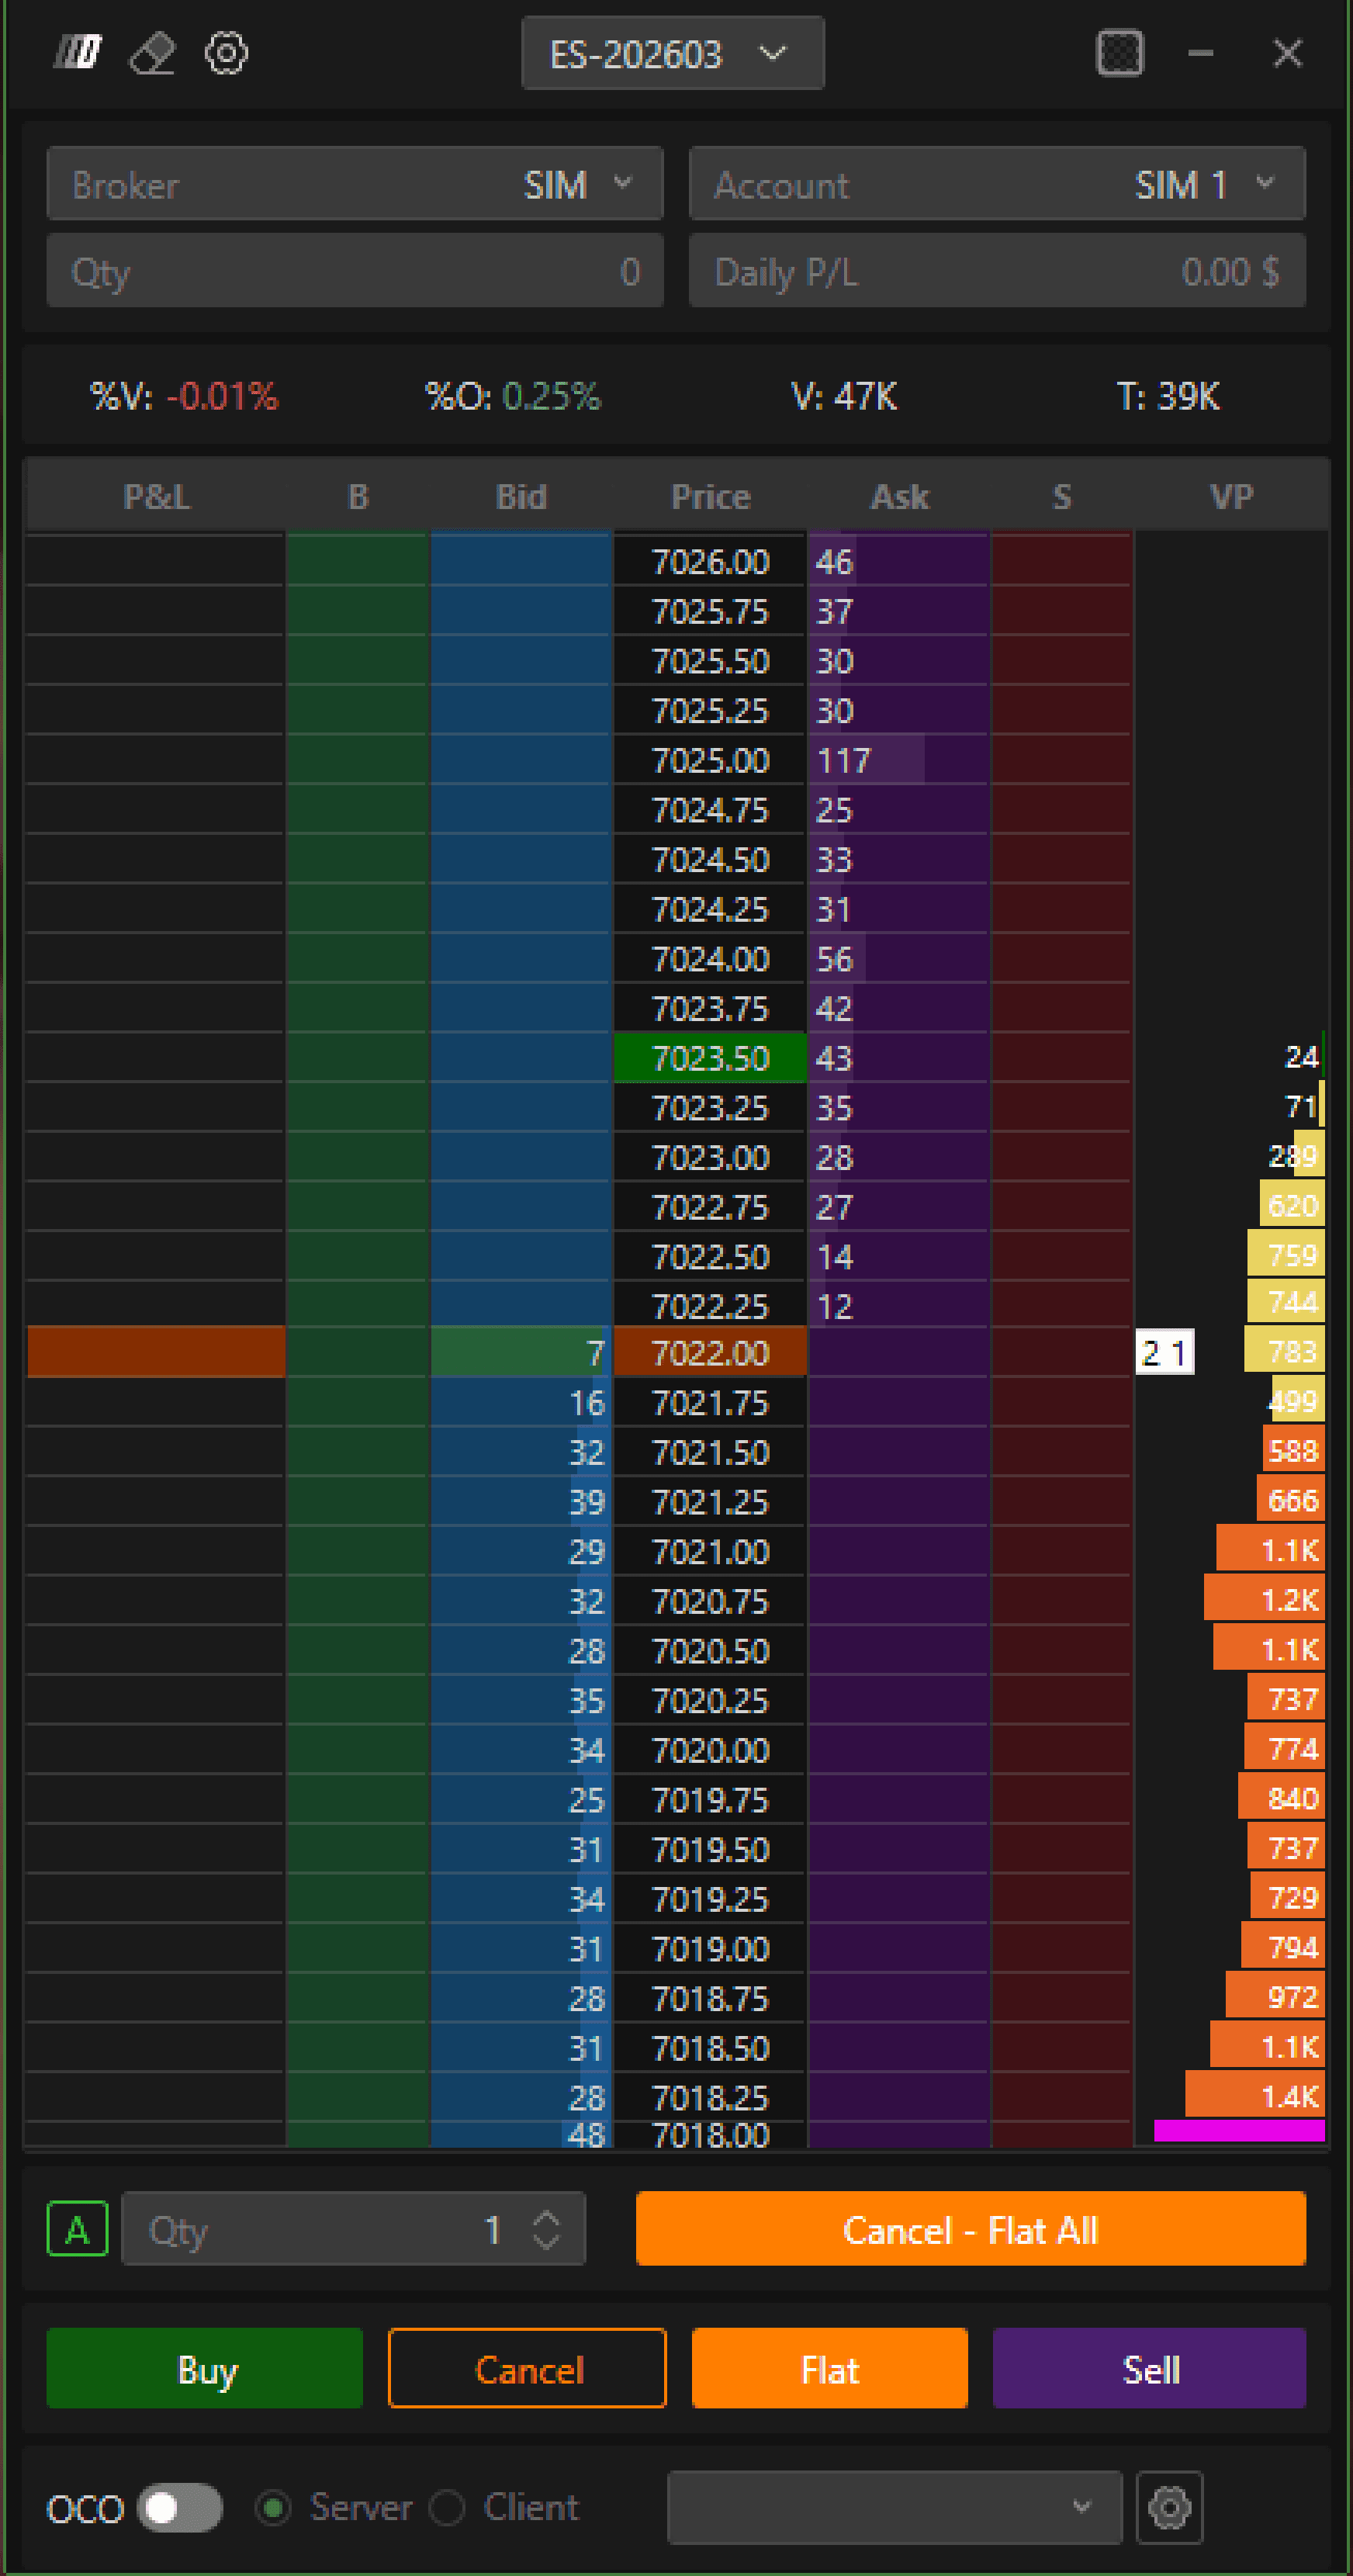
Advanced DOM Layout
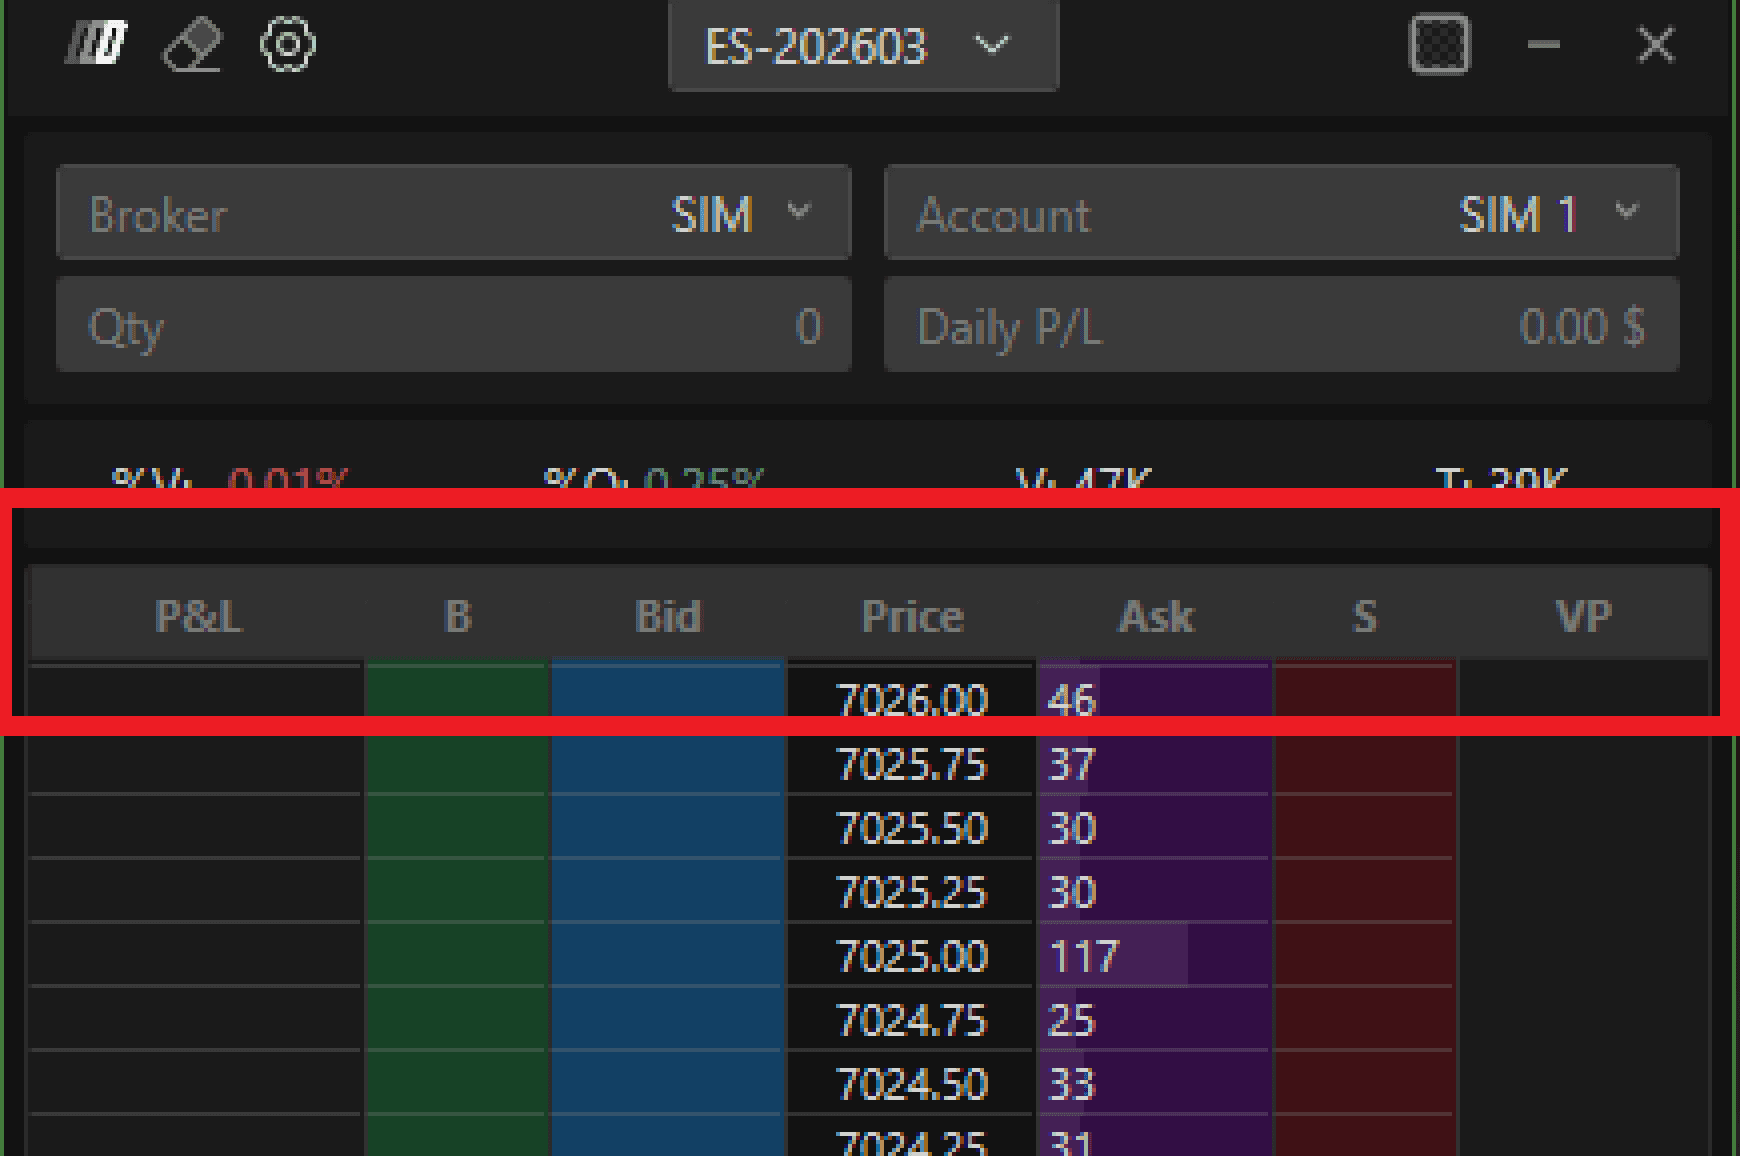
By default, the Advanced DOM displays multiple columns arranged from left to right:
P&L – Displays profit or loss per individual tick.
B – Buy order management column.
Bid – Placement of buy limit orders.
Price – Central price ladder.
Ask – Placement of sell orders.
S – Sell order management column.
VP – Daily Volume Profile.
Top Information Panel
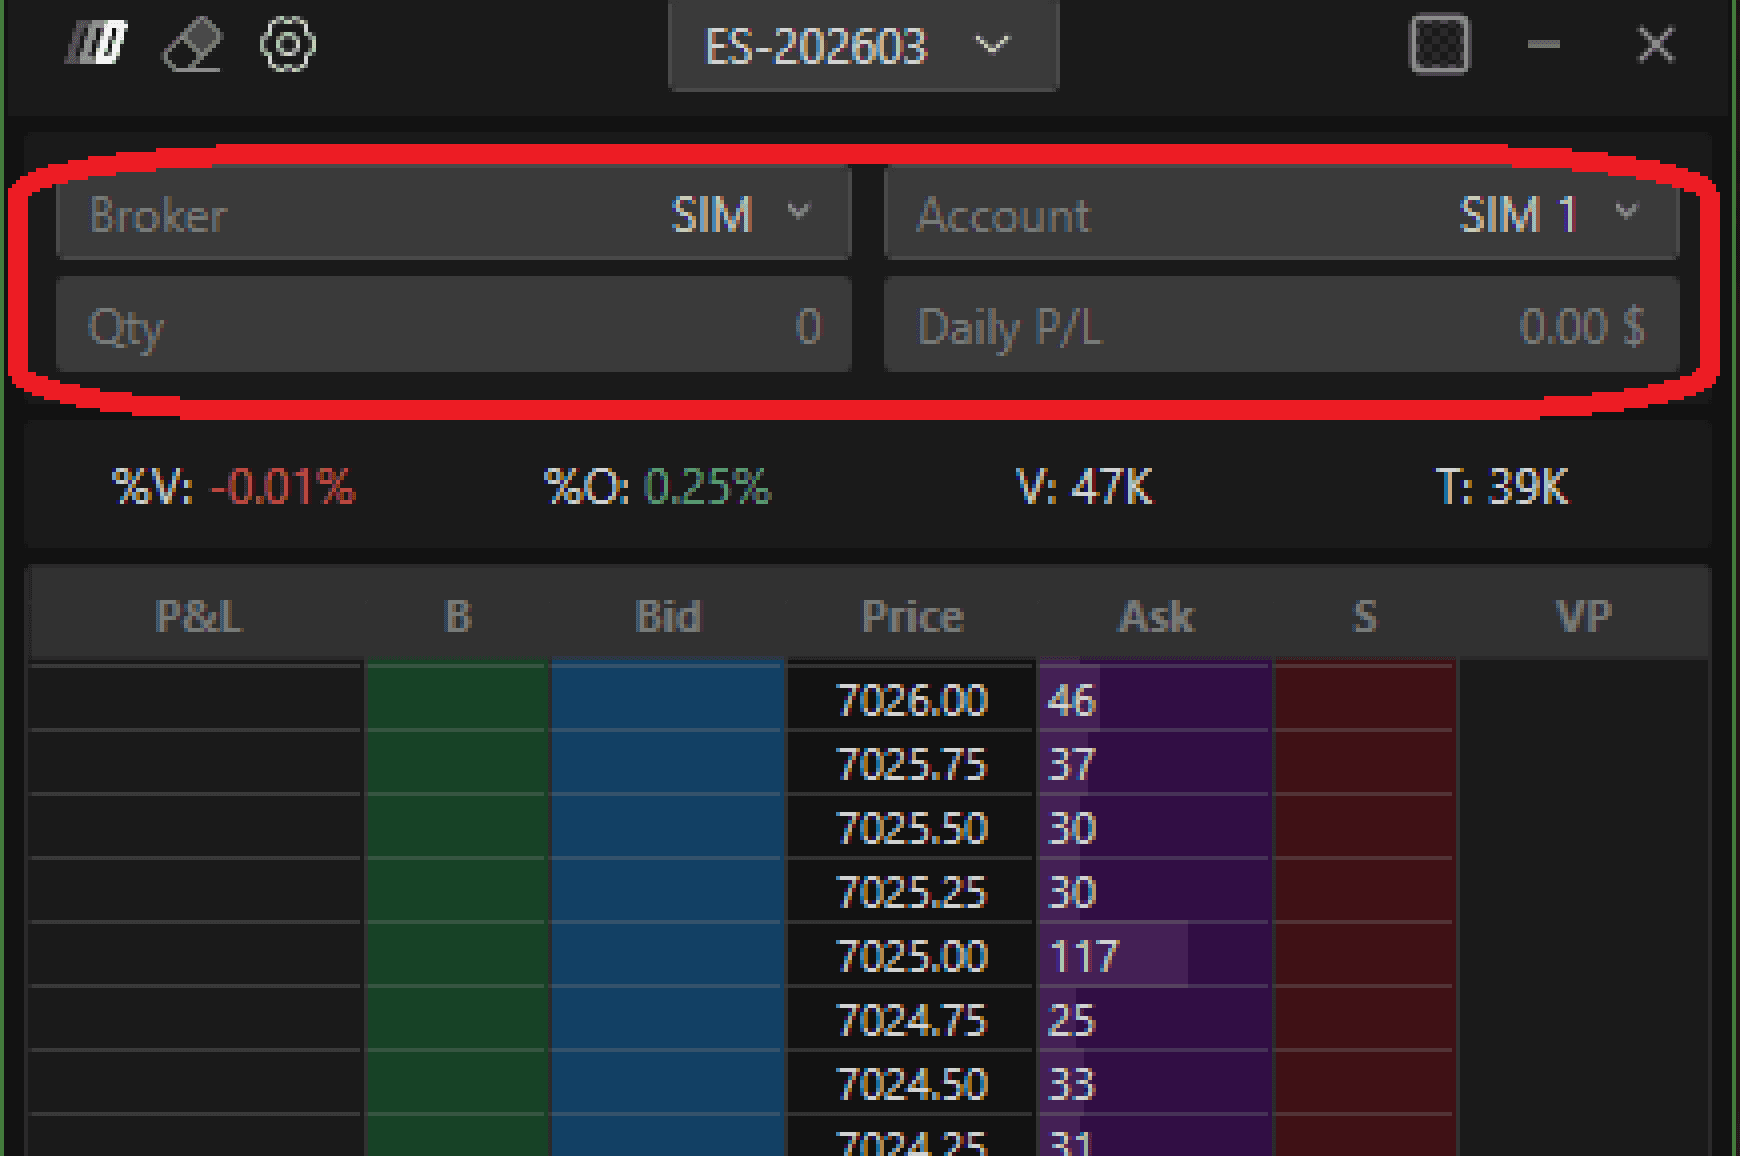
At the top of the Advanced DOM, you can view:
Selected instrument
Connected broker
Active trading account
Open position quantity
Daily profit and loss (P&L)
Fundamentals Table
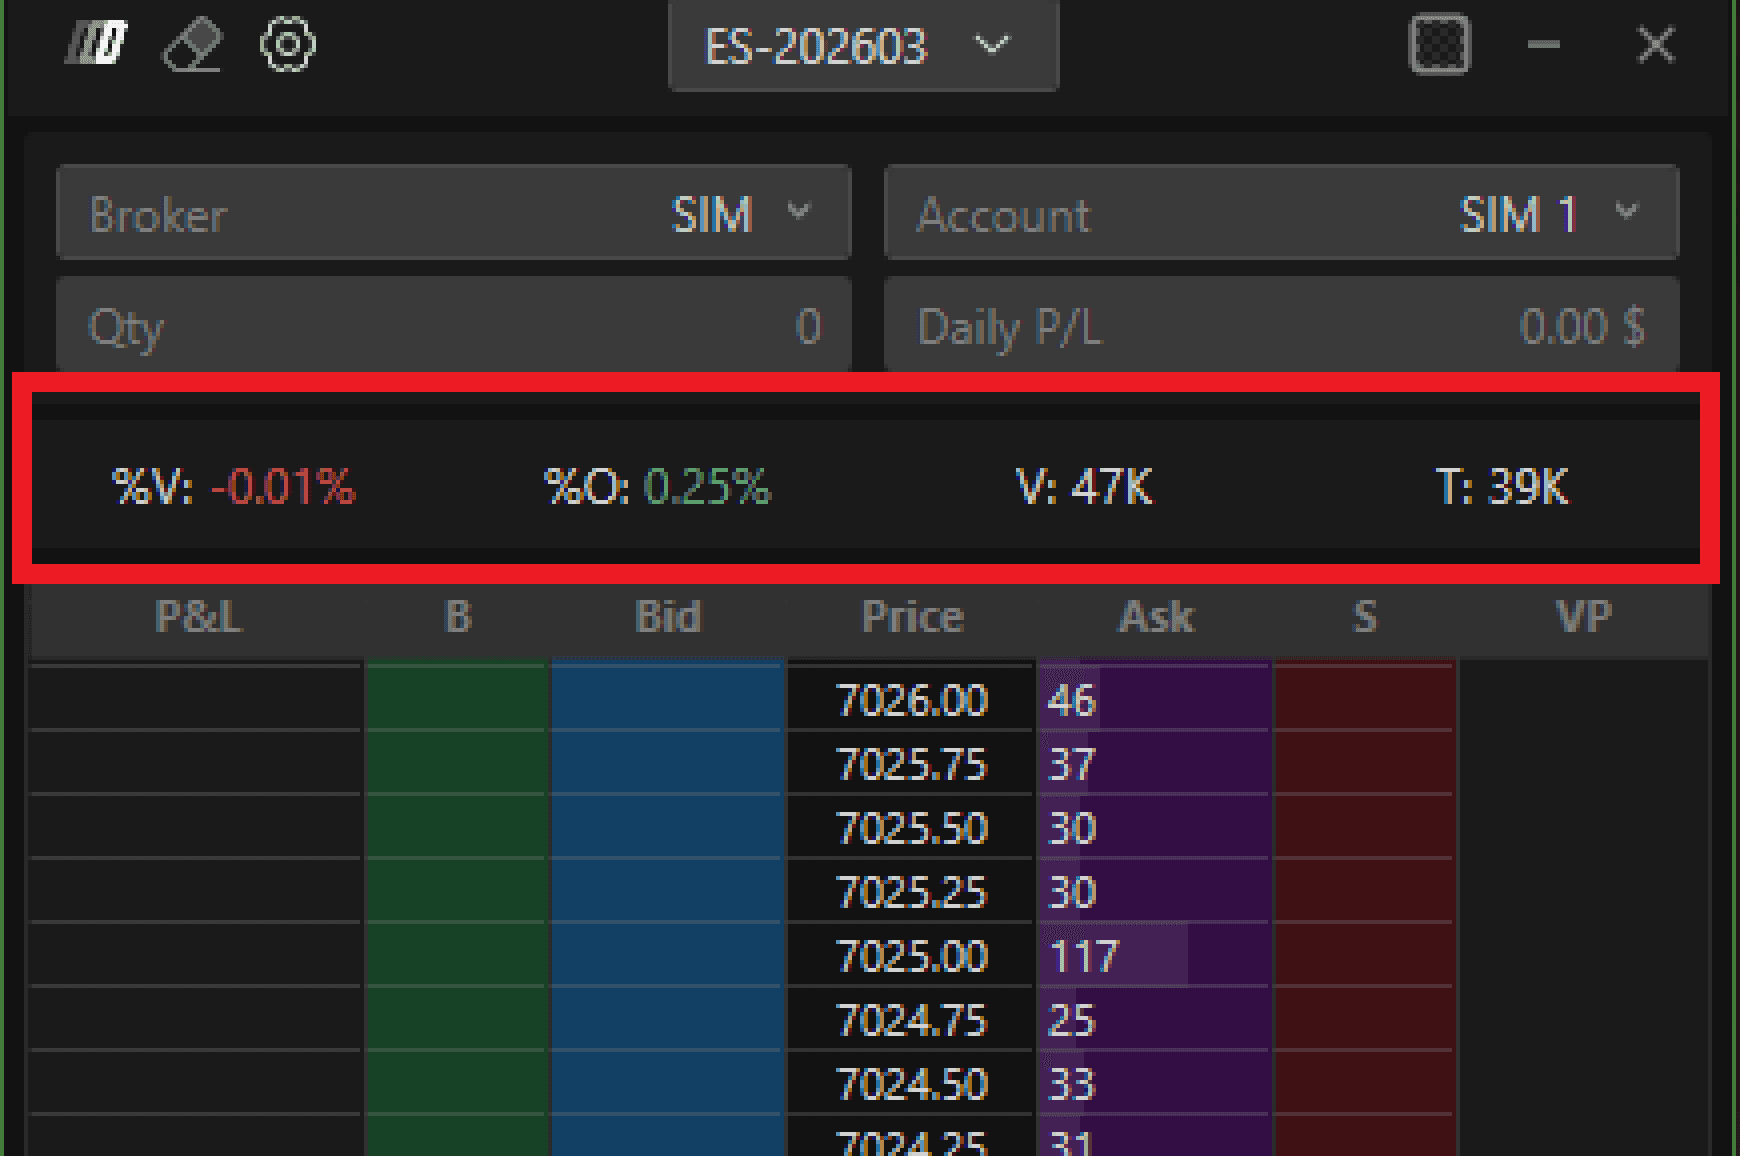
Located below the main header, this section displays:
Percentage change from the previous close
Change from the current session’s open
Total traded volume
Number of trades (for stocks)
Upper and lower suspension prices
Order Quantity and Trading Controls
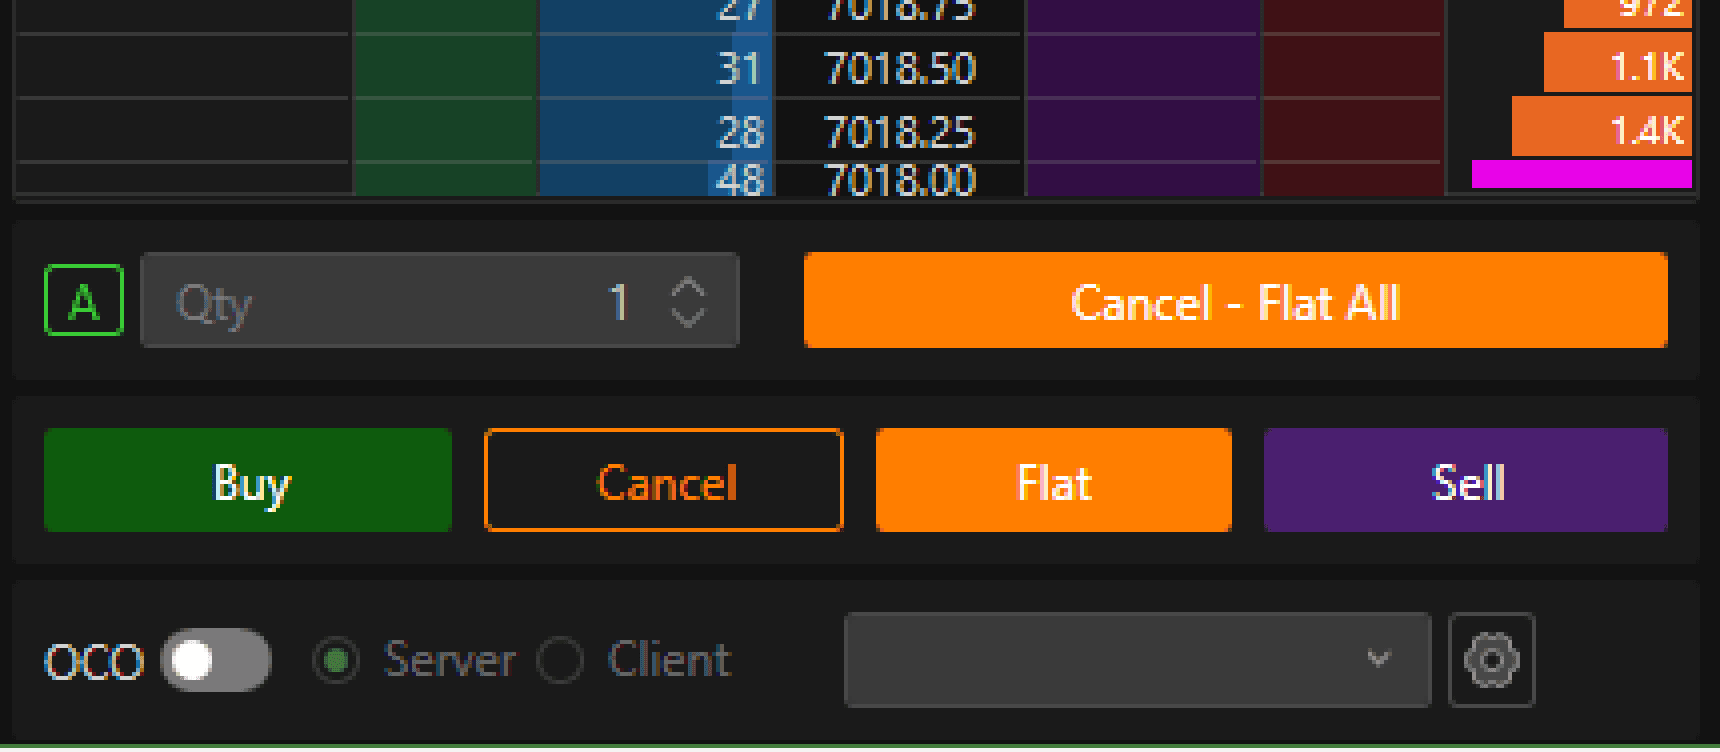
At the bottom of the DOM:
Set the order quantity
Access classic trading buttons
Enable OCO (Order Cancels Order) strategies
OCO Strategies
OCO allows you to attach:
A take-profit limit order
A protective stop order
to a single entry order.
Use the gear icon (bottom right) to:
Create and save OCO strategies
Recall saved strategies from the dropdown menu
Order Types (A Menu)
The A menu allows you to select the order type:
Automatic
Limit
Market
Conditional
Automatic Mode Behavior
In Automatic mode, order type is determined by mouse position at specific price:
Right-click Bid → Buy Market
Right-click Ask → Sell Market
Left-click Bid
Below price → Buy Limit
Above price → Buy Stop
Left-click Ask
Above price → Sell Limit
Below price → Sell Stop
Managing Pending Orders
Pending orders can be managed directly from the DOM:
Left-click & drag → Move order
Right-click → Delete order
Double left-click → Modify quantity
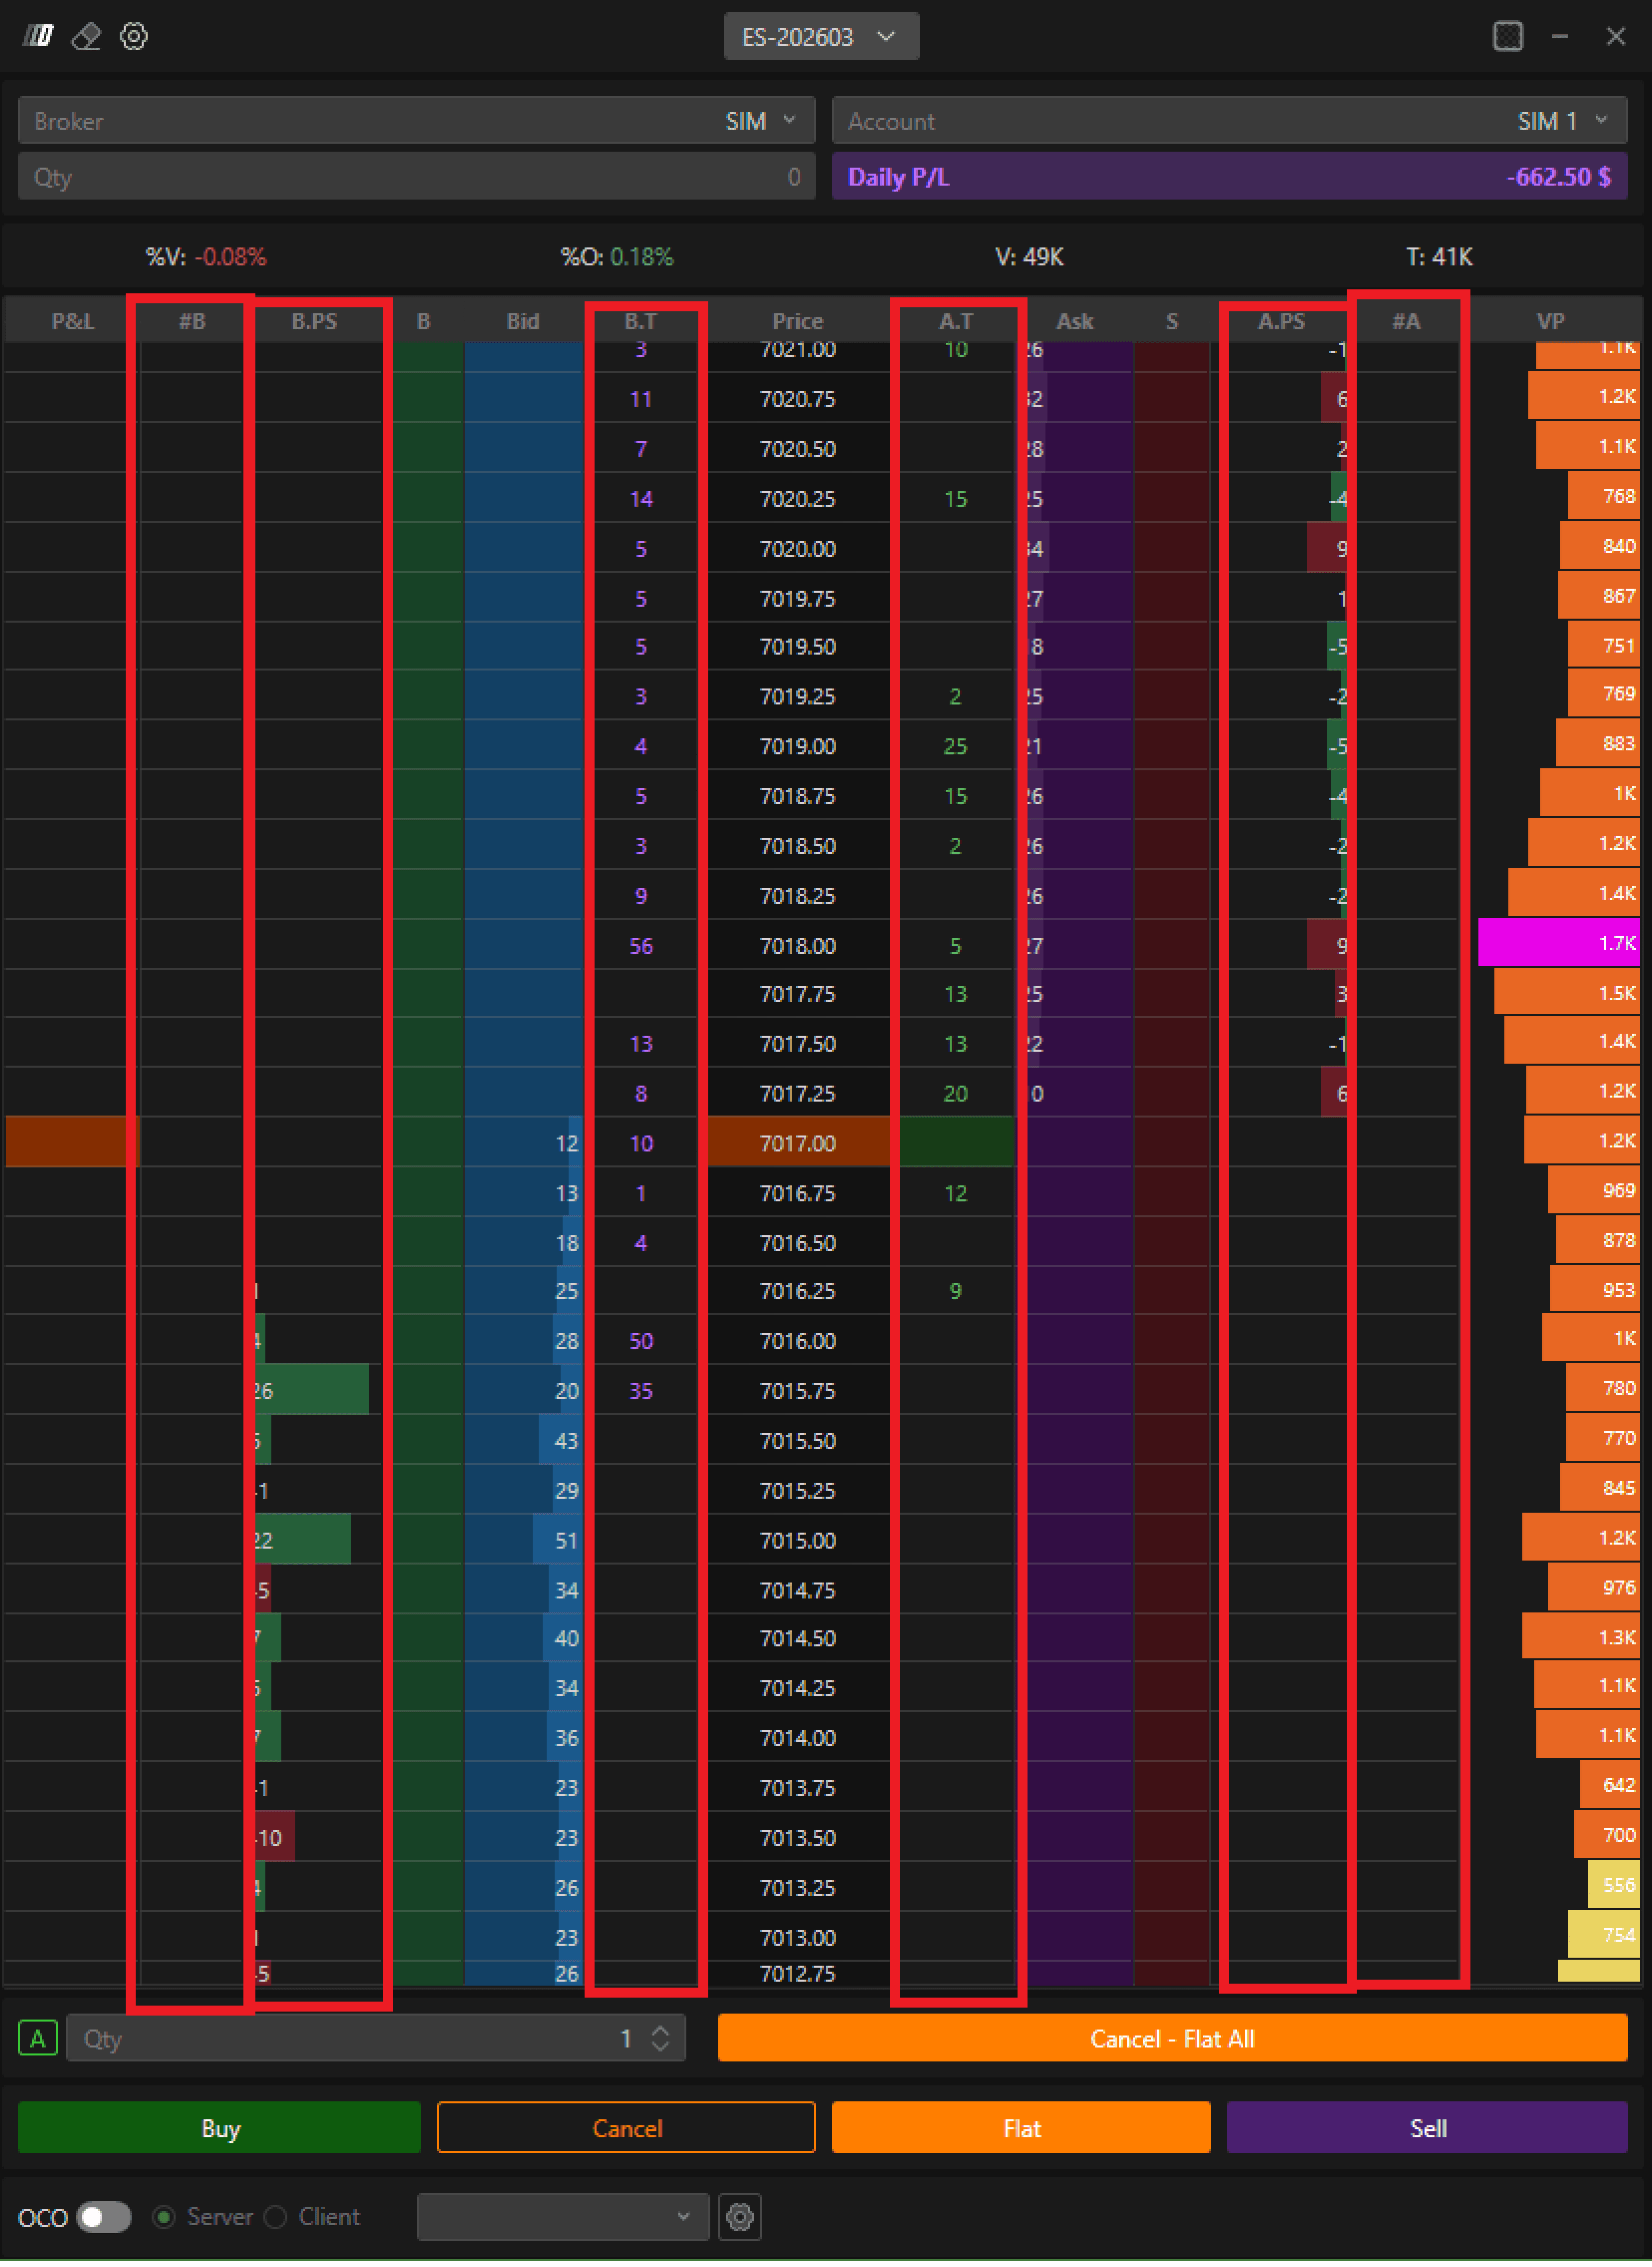
Additional Columns and Market Data
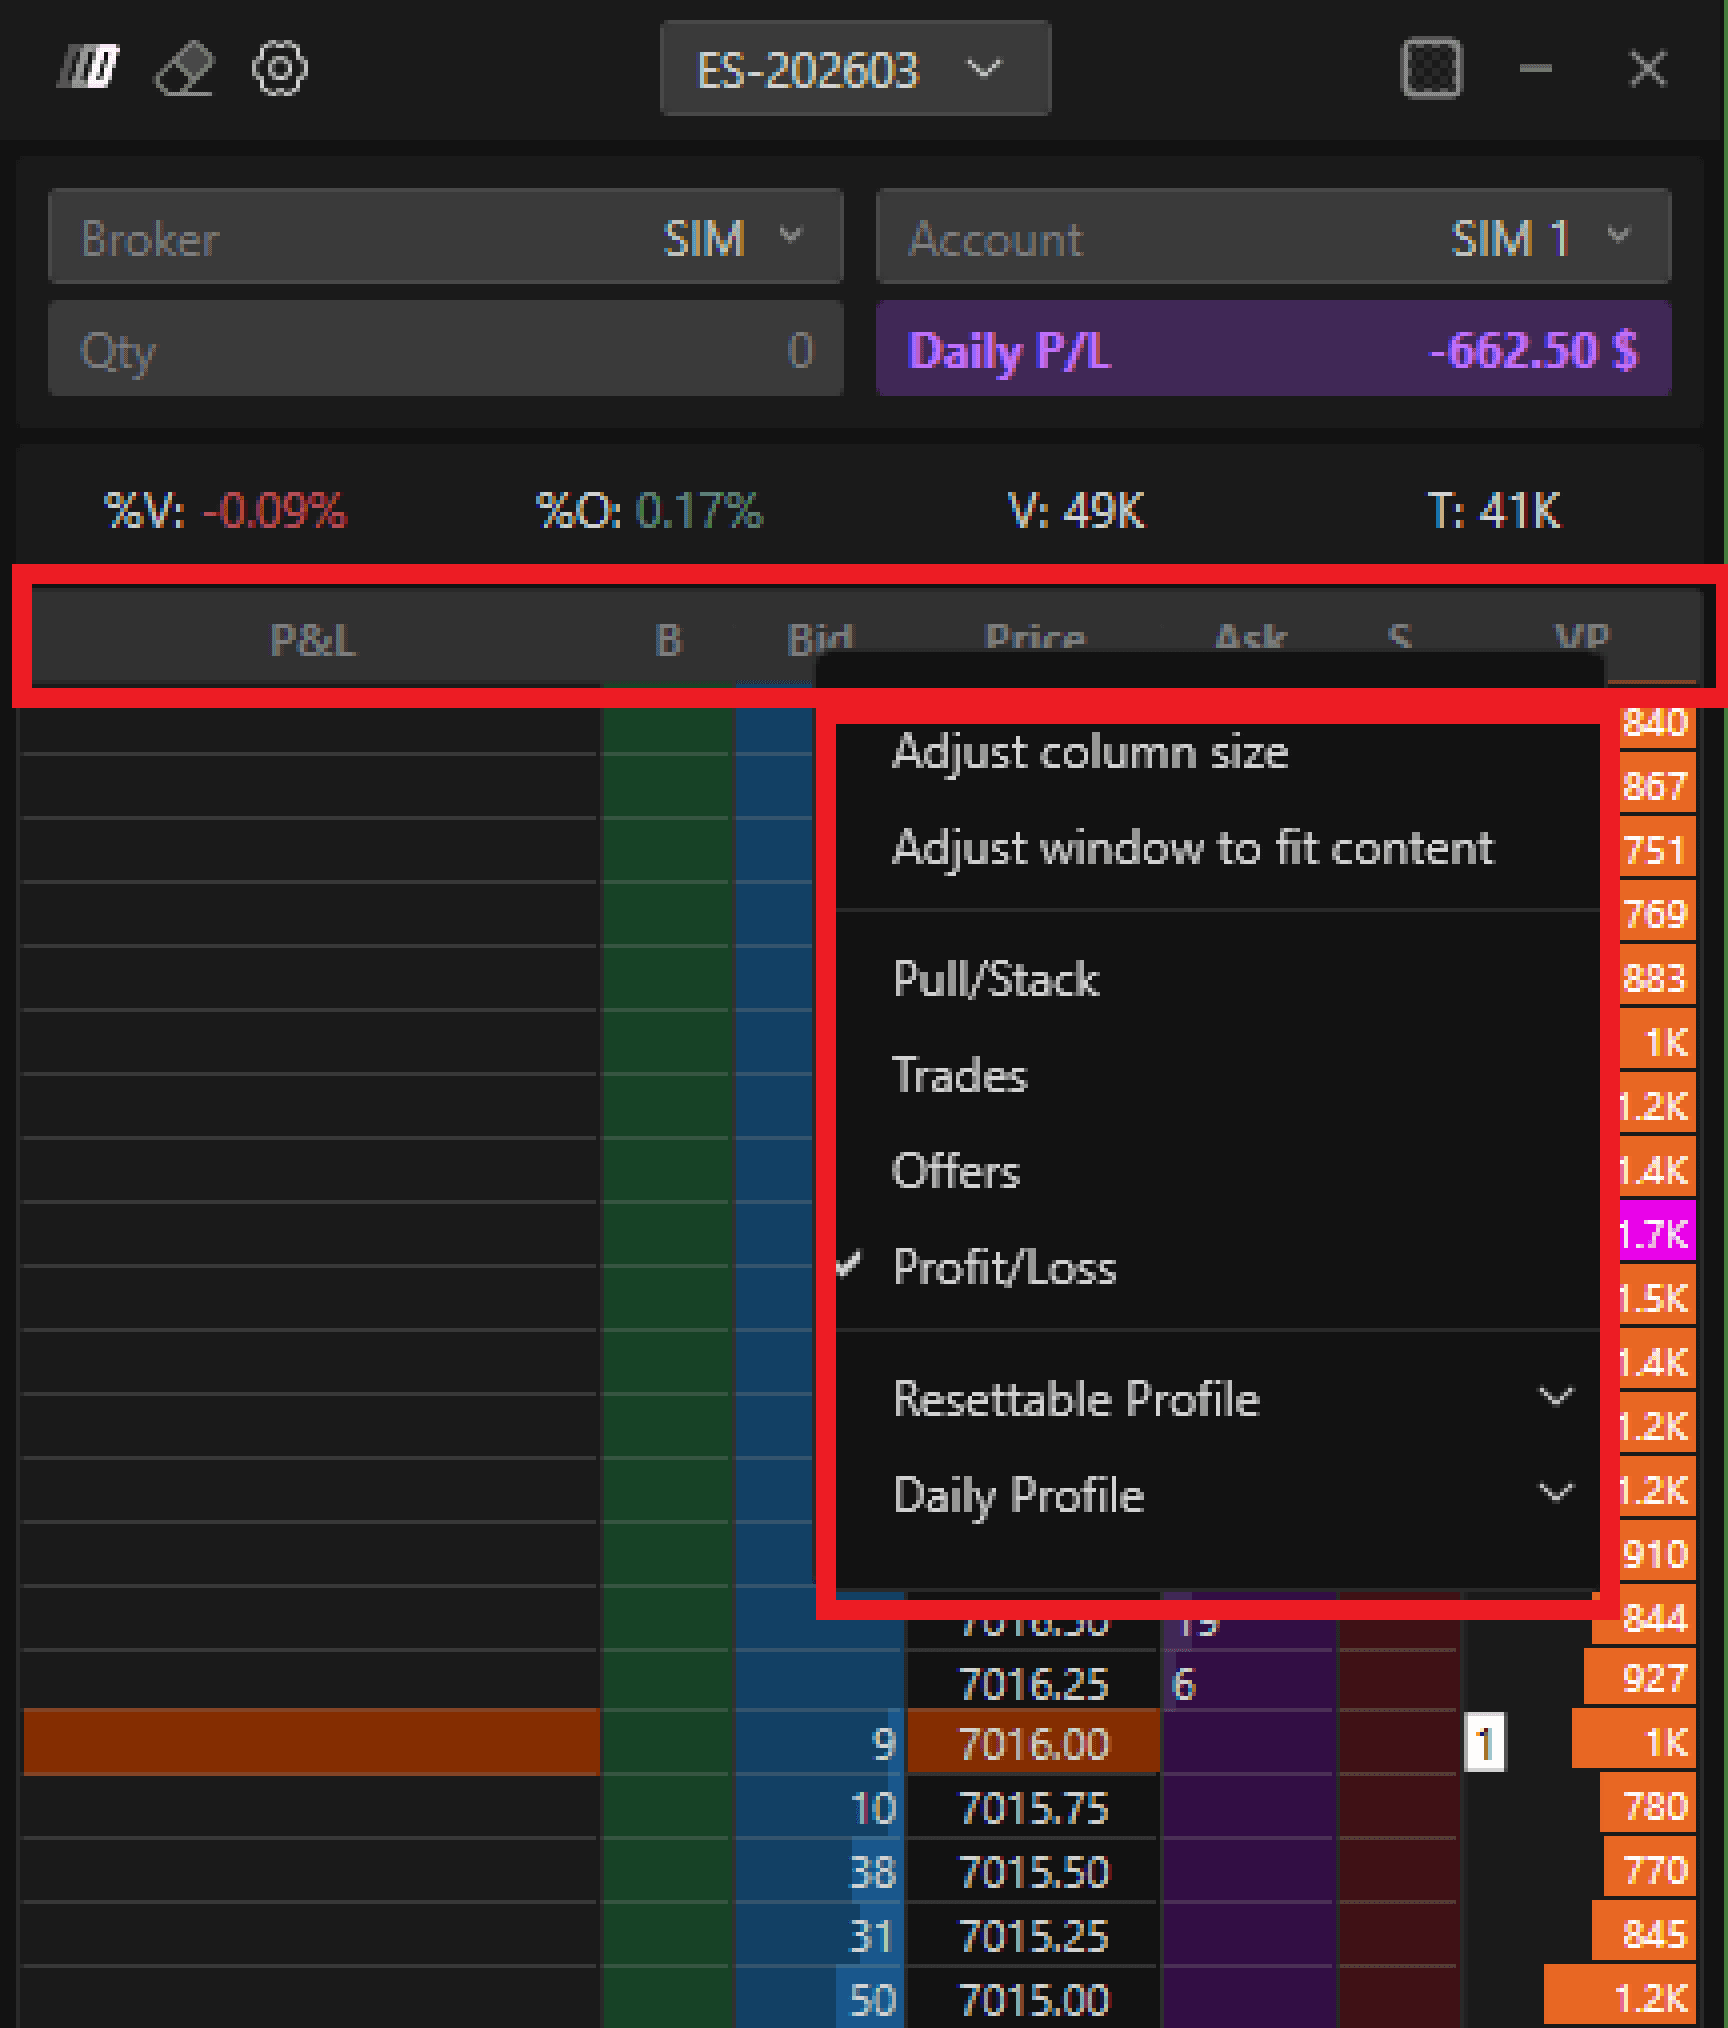
To enable additional columns:
Right-click on the column header row
Select desired columns or auto-resize
Pull/Stack Columns
Show changes in resting liquidity:
B.PS
Green = quantity added
Red = quantity removed
A.PS
Color logic reversed
Trades Columns
BT – Volume sold at market
AT – Volume bought at market
Offers Columns
Display the number of individual orders at each bid and ask level
Profiles and Volume Configuration
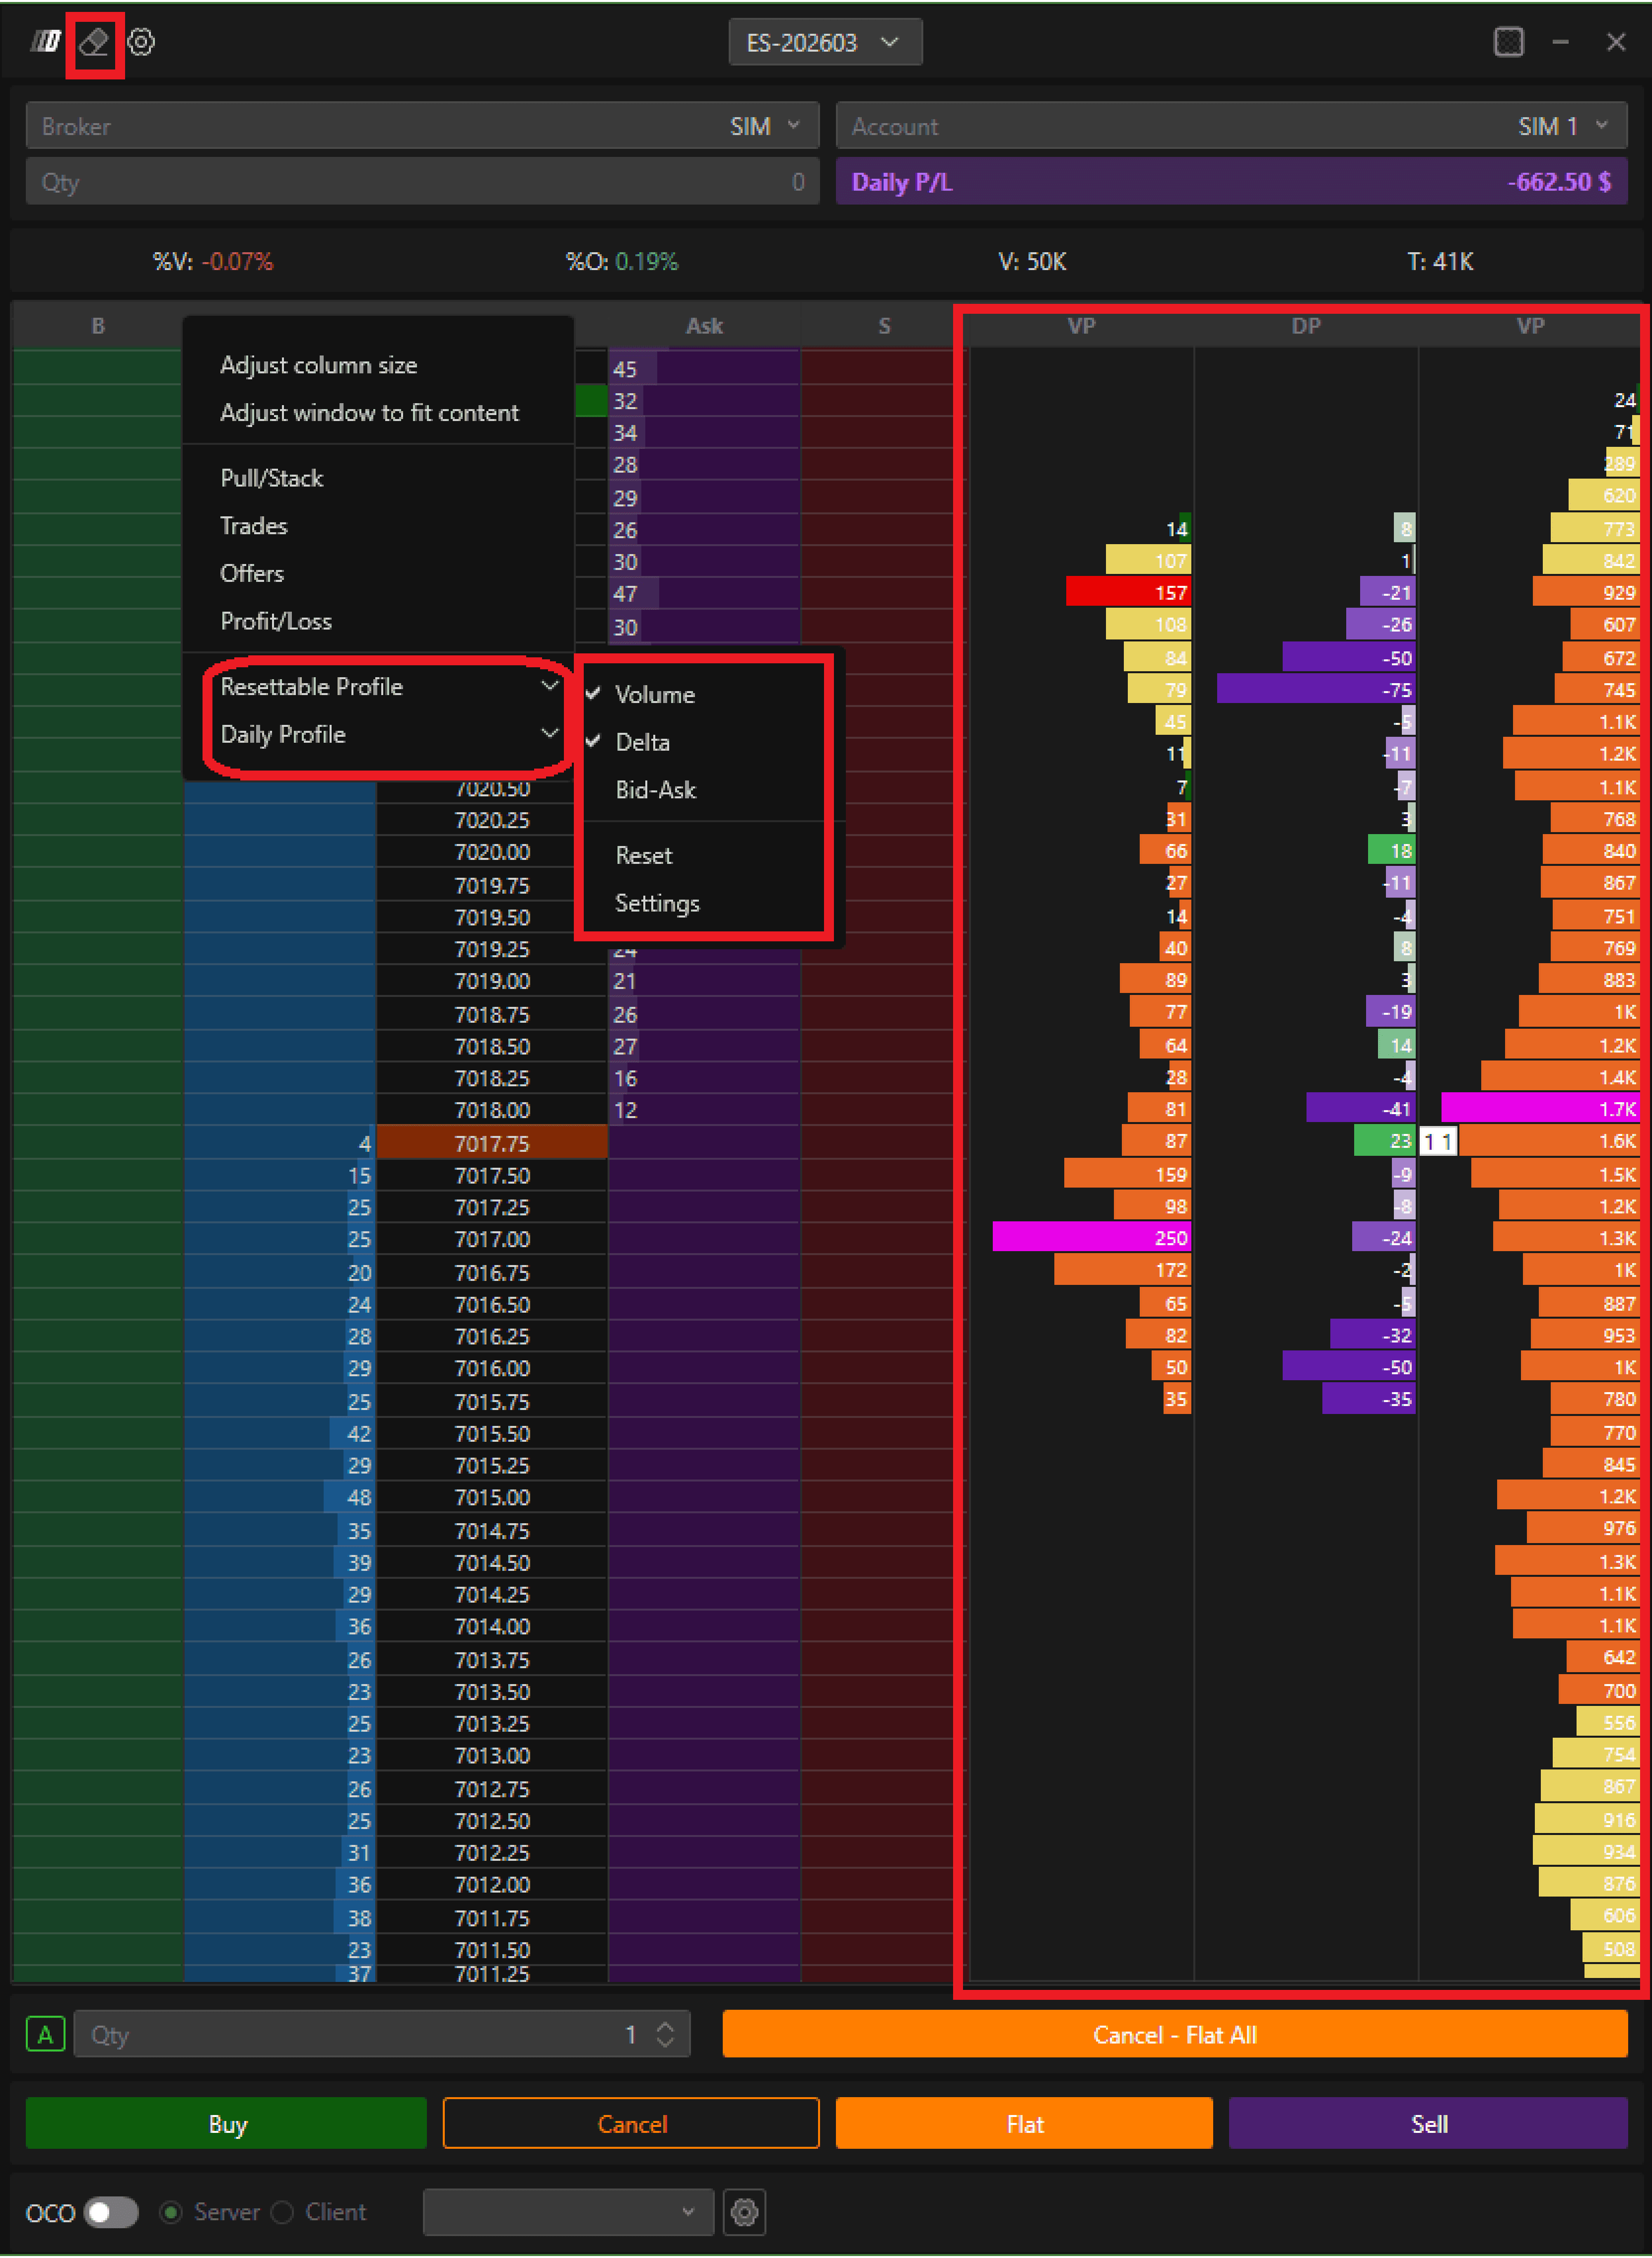
Profiles can be added from the header row, including:
Volume
Delta
Bid / Ask
Volume Profile Types
Resettable Profile
Starts recording when enabled
Can be cleared using the eraser icon
Daily Profile
Displays data from the start of the trading session
Advanced DOM Customization
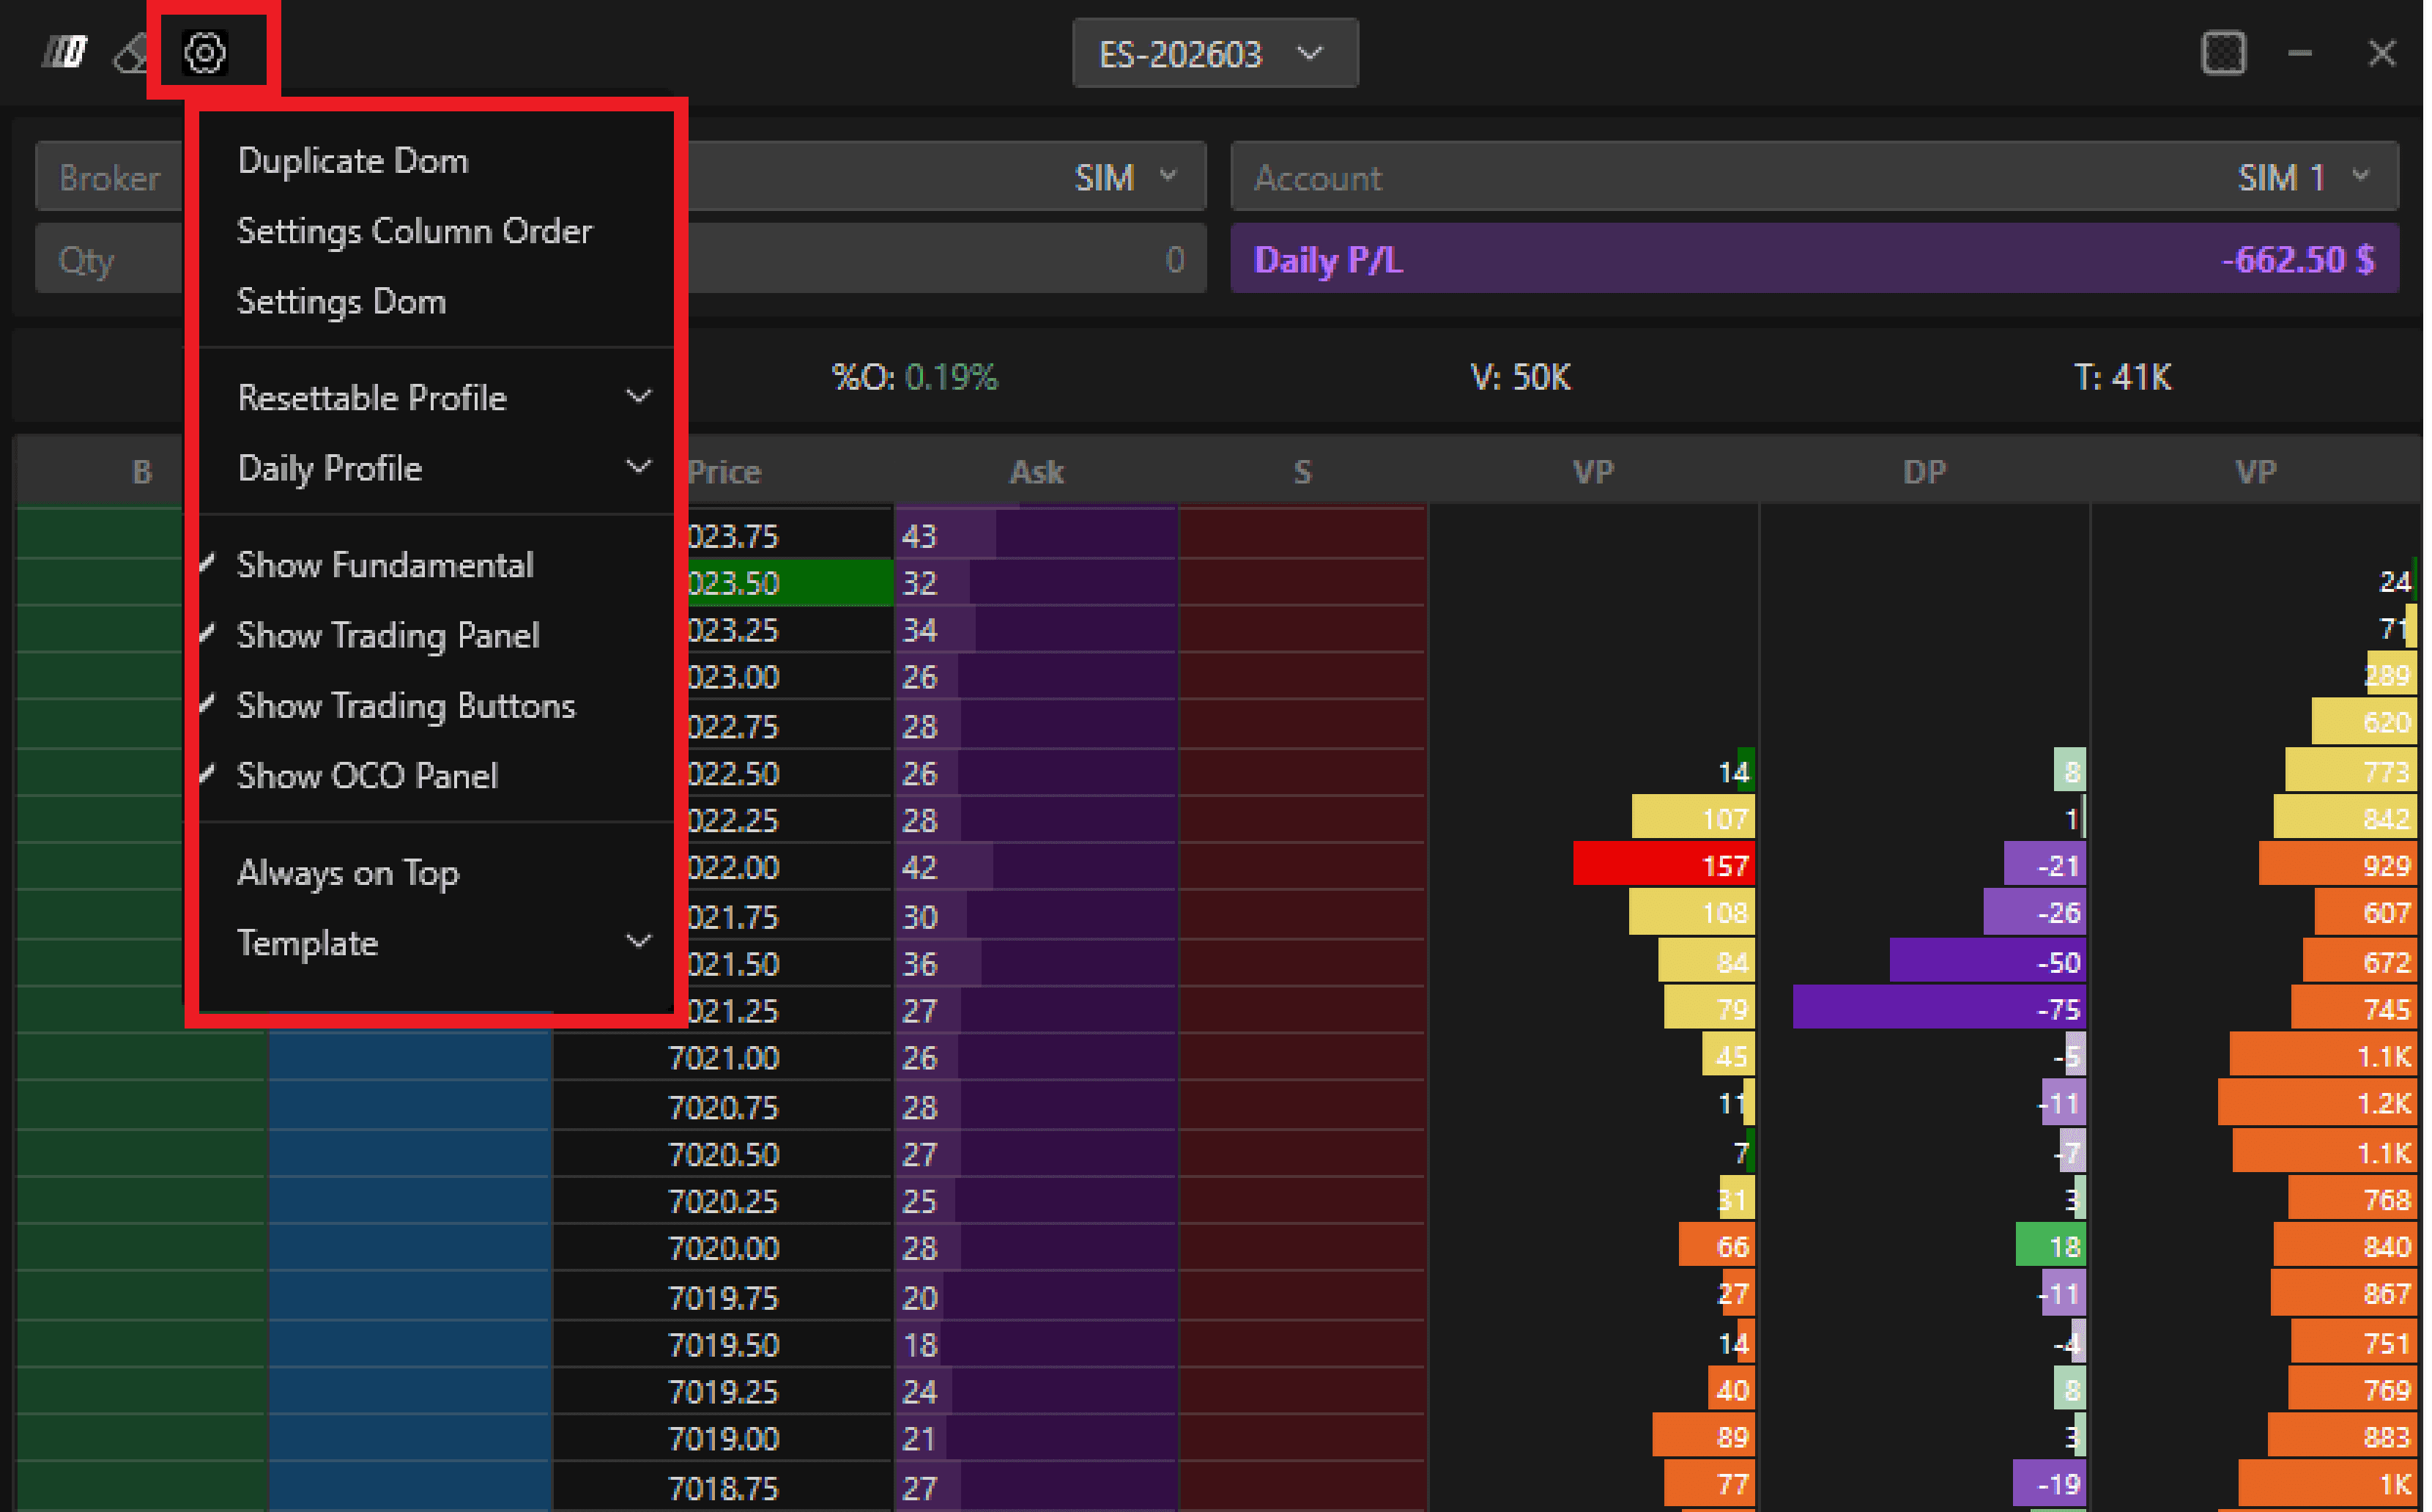
Click the gear icon (top left) to open Advanced DOM settings.
Customization Options
Enable / disable sections to simplify the DOM
Order Column Settings
Reorder columns
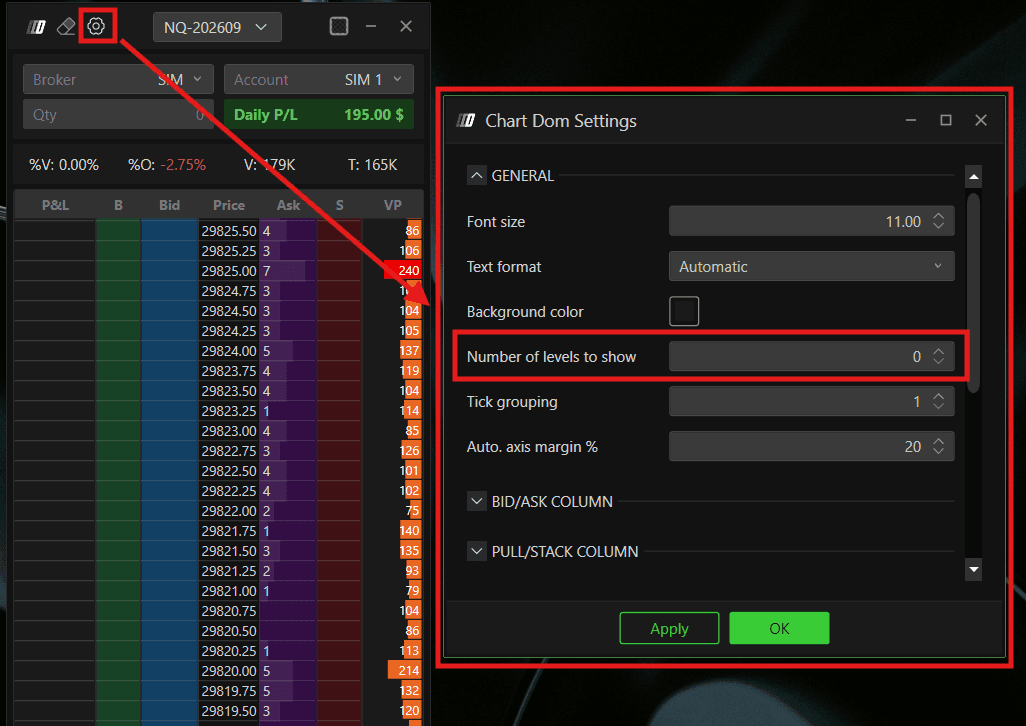
Chart DOM Settings
Customize text, colors, and background
Enable markers for:
High
Low
Open
Suspension levels
Full Depth DOM Support
The DOM supports displaying the full market depth available from your data provider. For traders who prefer a cleaner DOM layout, you can limit the number of displayed levels.

Location: DOM Settings >> Number of Levels Show
Set the value to 20 to display only 20 levels of market depth
Increase or decrease the value depending on your preference
Leave unrestricted to display the full depth available from your feed
Layout Templates (Model Section)
Save custom layouts
Load previously saved templates
Vertical Scale (Price Column)
Right-click inside the Price column to manage the vertical scale using auto-recognition mode:
Clicking near current price → Scrolls the view
Clicking near top or bottom → Expands or compresses the price scale
Still Having Trouble?
Our support team is available 24/7 and ready to help you with any issue you encounter.
When reaching out, please include:
A screenshot of the issue
A brief description of what you were trying to do
Support Ticket (Fastest Response)
Visit www.deepcharts.com and create a support ticket directly on our website.
Email Support
Reach us at support@deepcharts.com - please note that email responses may take a little longer than a support ticket.