Indicators
Updated:
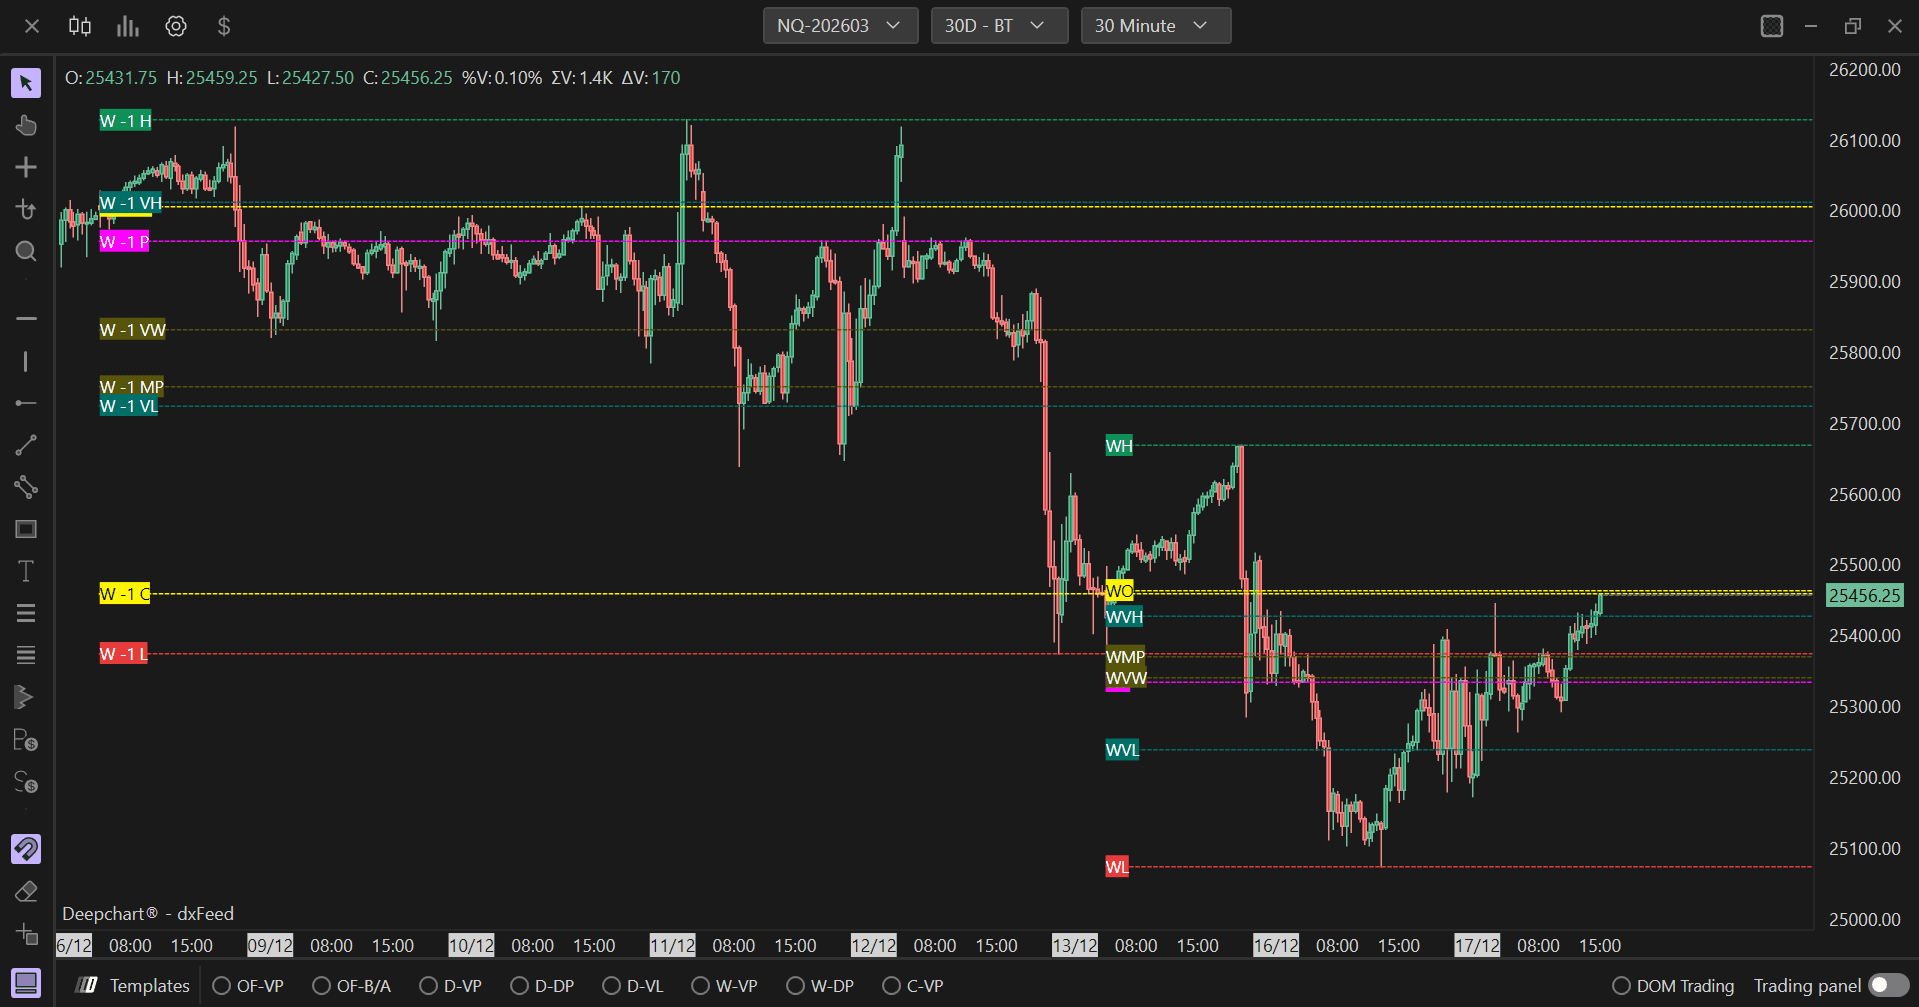
The Important Levels indicator allows you to highlight the most important price levels on a daily, weekly, and monthly basis. This indicator is particularly useful in intraday charts, as it allows the user to always have the highs, lows, opening and closing prices, POCs, value areas, VWAPs, and average values of the periods enabled easily visible on the chart.
Using Settings
Clicking on the indicator's settings icon will open its configuration window, within which you can make several choices regarding the functionality of the indicator itself.
Length Settings

In this section you will be able to set the number of days, weeks, and months that you want to highlight:
Days: Define how many previous days' levels to display
Weeks: Define how many previous weeks' levels to display
Months: Define how many previous months' levels to display
Skip Last: If enabled, the indicator will not highlight the important values of the current day, week, and month
Plot Settings
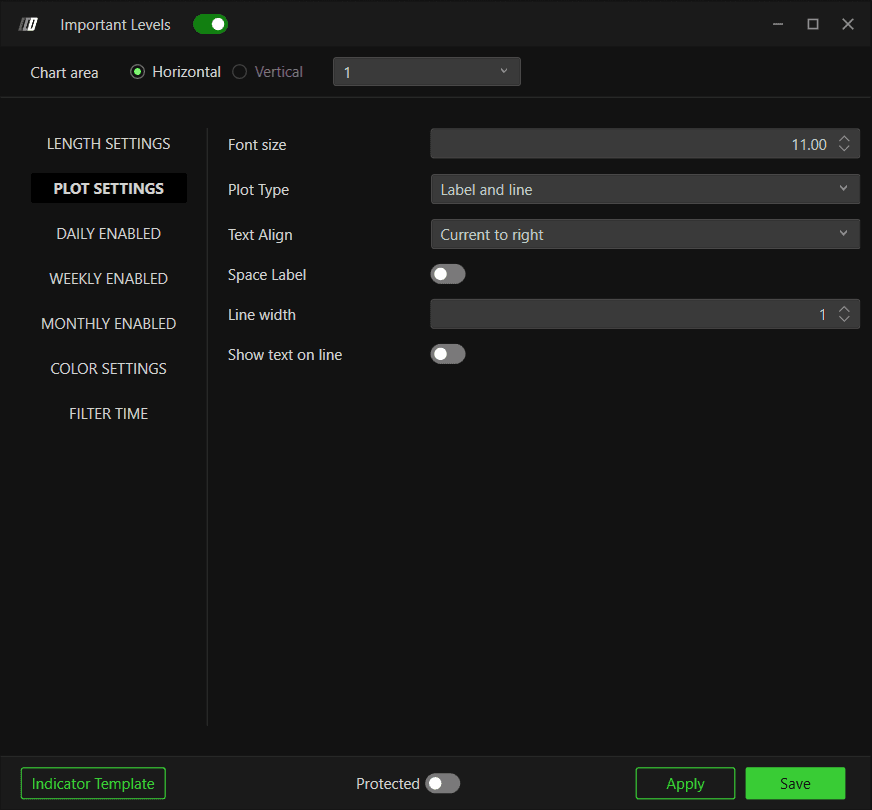
Font Size
Allows you to change the text size of the various labels reported by the indicator.
Plot Type
Lets you determine the display type for important levels, being able to choose between:
Label: Display only text labels for the levels
Line: Display only horizontal lines for the levels
Label and Line: Display both text labels and horizontal lines
Text Align
Allows you to determine where to display text on the chart:
Left: Display labels on the left side of the chart
Right: Display labels on the right side of the chart
Current to Right: Display labels from current position to the right
Current to Last: Display labels from current position to the last visible level
Enabled Daily/Weekly/Monthly Levels
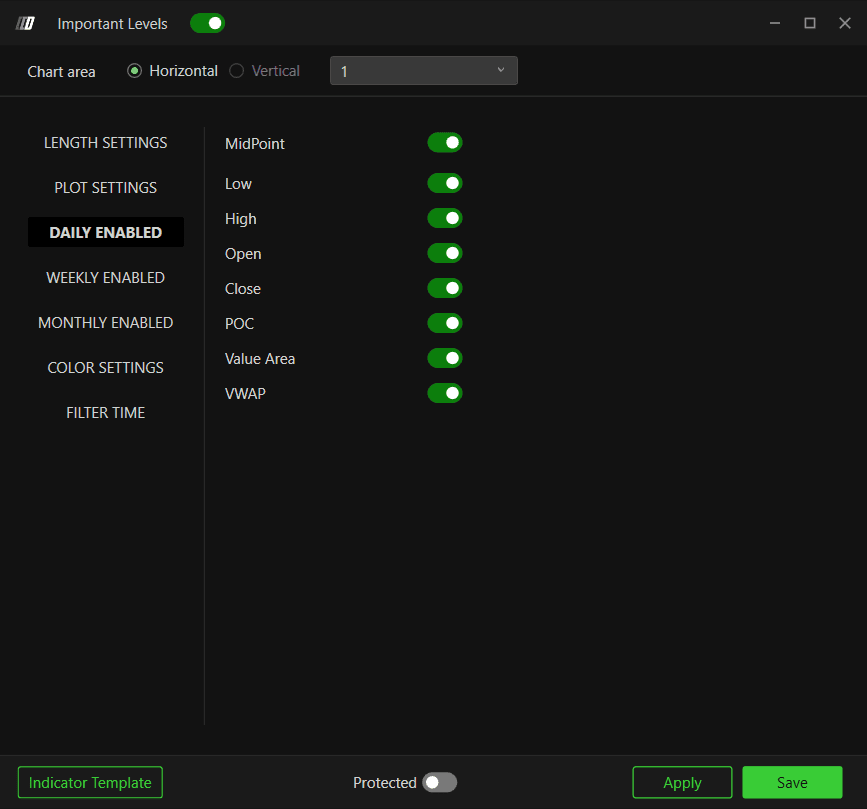
Enables important values that the user is interested in. For each period (Daily, Weekly, Monthly), you can choose to display or hide the following levels:
Average Value: The average price of the period
Low: The lowest price during the period
High: The highest price during the period
Open: The opening price of the period
Close: The closing price of the period
POC (Point of Control): The price level with the highest trading volume
Value Area: The price range containing a specific percentage of total trading volume
VWAP: Volume-weighted average price of the period
Color Settings
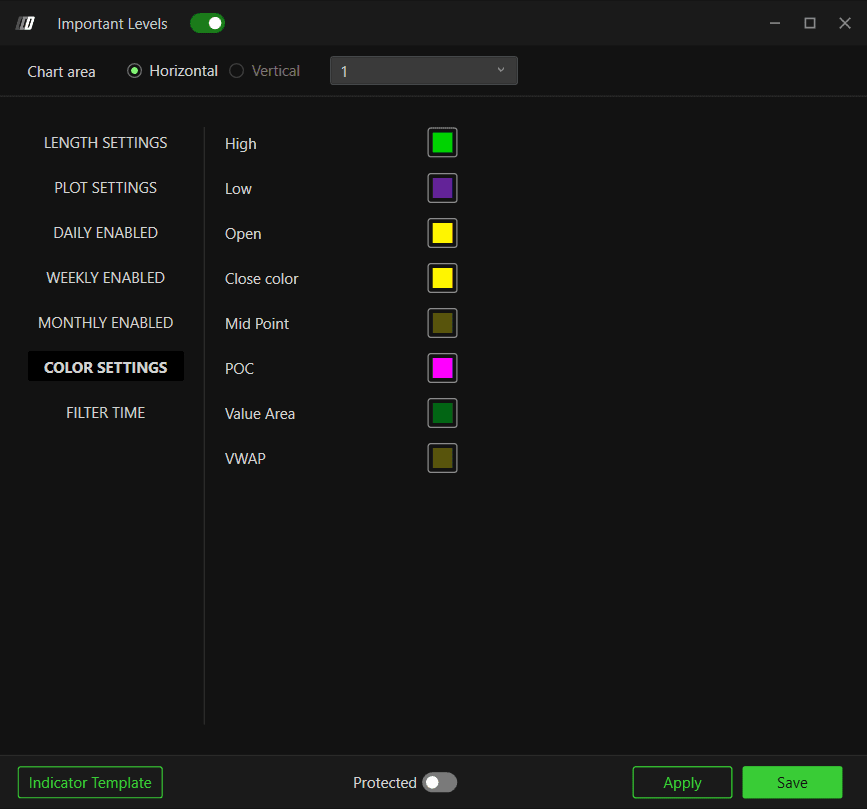
Lets you change the colors of the various important values displayed. You can customize colors for:
Low: Color for Lowest price
High: Color for Highest price
Open: Color for opening price
Close: Color for closing price
Mid Point: Color for midpoint
POC: Color for Point of Control
Value Area: Color for Value Area
VWAP : Color for VWAP
Tip: If you want to differentiate colors between daily, weekly, and monthly important values, you can insert multiple Important Levels indicators—for example, one with only daily values and one with only weekly values—and differentiate their colors.
Filter Time
General
Filter Time - Determines which trading session is used when calculating and displaying levels.
None – No time filtering is applied. Levels are calculated using the full trading session.
ETH – Levels are calculated using Extended Trading Hours data.
RTH – Levels are calculated using Regular Trading Hours data.
Custom – Levels are calculated using a user-defined session time range.
Custom Time (Exchange Time Zone)
The Custom Time section becomes available when Custom is selected in the Filter Time setting. It allows you to define a specific session window for level calculations.
Ini Session
Specifies the start time of the custom session.
End Session
Specifies the end time of the custom session.

Note: Custom session times are based on the exchange time zone of the selected instrument. Only data within the defined session range will be used to calculate Important Levels.
Still Having Trouble?
Our support team is available 24/7 and ready to help you with any issue you encounter.
When reaching out, please include:
A screenshot of the issue
A brief description of what you were trying to do
Support Ticket (Fastest Response)
Visit www.deepcharts.com and create a support ticket directly on our website.
Email Support
Reach us at support@deepcharts.com - please note that email responses may take a little longer than a support ticket.