Indicators
Updated:
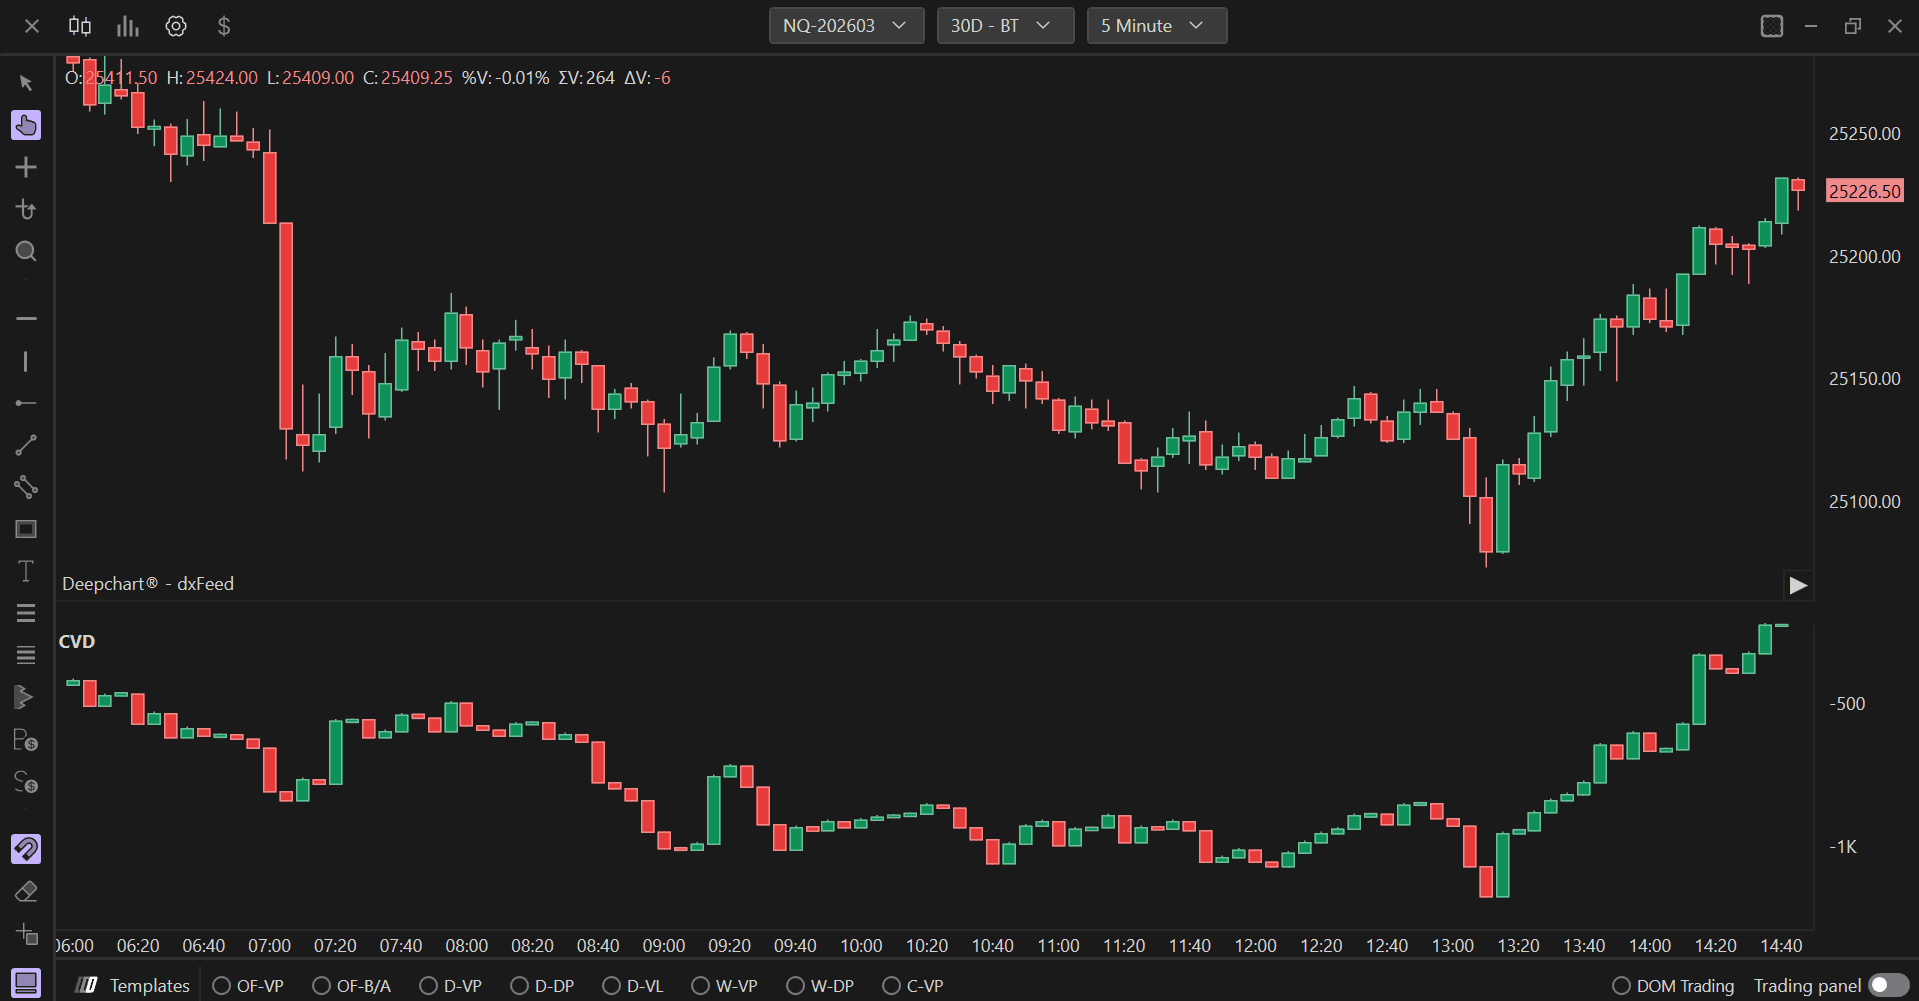
The Delta Cumulative Candlestick indicator allows you to visualize through candlesticks at the footer of the chart the cumulative delta summation of each candlestick, that is, the difference between sell market and buy market. This allows users to identify which side of the market is more aggressive. Candlestick display may make it easier for some users to identify divergences between cumulative delta and price.
Using Settings
Clicking on the indicator's settings icon will open its configuration window, within which you can make several choices regarding the functionality of the indicator itself.
Parameters (General)
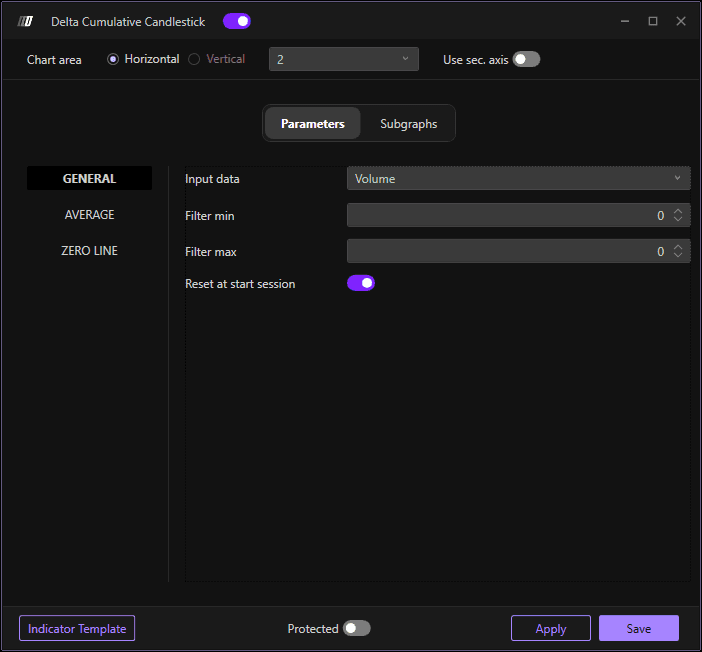
Input Data
Defines which database to use for calculating the indicator. You can choose from:
Volumes: Indicate the amounts of contracts/shares traded. This option is useful for understanding the intensity of trading activity and the total amount moved by traders.
Order: Considers order data, such as the quantity of buy and sell orders at each price level. This option is useful for assessing order pressure and analyzing the behavior of market participants
Aggregates Trades: Indicate the number of exchanges or transactions executed. This option is useful for understanding how frequently the instrument is traded.
In other words, Trades indicate how often a financial instrument is traded, while Volumes indicate how much of the financial instrument is traded.
For example, an increase in the number of Trades without a corresponding increase in Volumes indicates that there is frequent activity but on small amounts. Conversely, an increase in Volumes without a corresponding increase in the number of Trades indicates that few traders are moving large quantities.
Filter Min
Lets you apply a minimal filter to the indicator. Only cumulative delta values above this threshold will be displayed.
Filter Max
Lets you apply a maximum filter to the indicator. If the value 0 is left, the indicator will not apply any maximum filter. Set a specific value to exclude cumulative delta that exceeds this threshold.
Reset to Start Session
If enabled, it allows you to restart the cumulative delta calculation at the beginning of every trading session. This is useful for analyzing delta behavior within individual sessions.
Average
Allows you to insert a moving average to the indicator. This smooths the cumulative delta line and can help identify trends more clearly.
Zero Line
Allows you to enable the zero line, which is the dividing line between a positive cumulative delta (more buying aggression) and a negative cumulative delta (more selling aggression).
Subgraphs
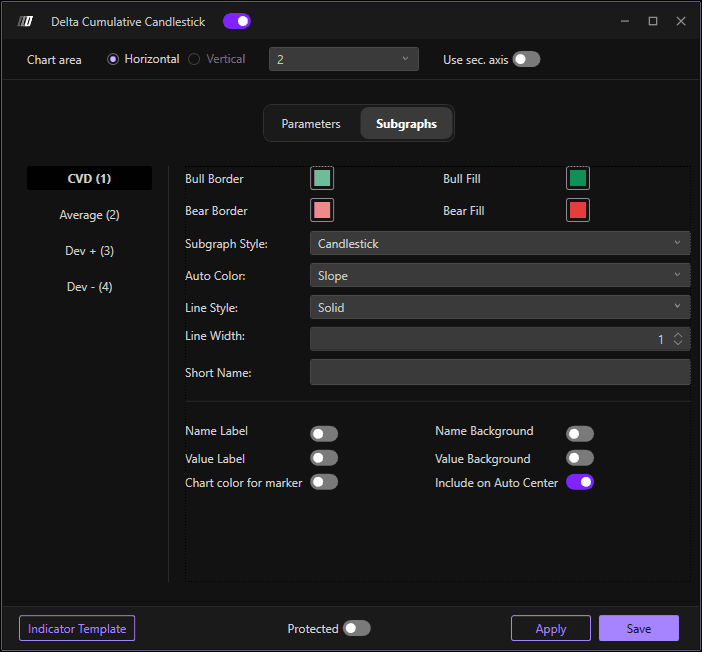
In this section you can define the visual appearance of the delta cumulative candlestick indicator:
Cumulative Delta Settings
Colors: Define the color scheme for the cumulative delta candlesticks (typically different colors for positive vs negative delta)
Subgraph Style: Choose between different display styles:
Candlestick: Display cumulative delta as candlestick bars
OHLC: Display as Open, High, Low, Close format
CandleBody: Display only the body of the candle without wicks
Line Width: Adjust the width/thickness of the candlesticks for better visibility
Average
Color: Define the color of the moving average line
Line Style: Choose the line style for the moving average
Line Width: Adjust the width of the moving average line
Deviations: Enable standard deviations from the moving average to show volatility bands