Indicators
Updated:
The Market Statistics indicator helps traders obtain useful statistical information to configure other tools such as Big Trades, Volume Clusters, Significant POCs, Delta Filter Bars, and Time & Sales. By analyzing the data loaded on the reference chart, it allows traders to identify the most frequent and least frequent values of a user-selected dataset, providing a useful statistical framework for determining meaningful levels and setting parameters for other indicators.
Using Settings
Clicking on the indicator's settings icon will open its configuration window, within which you can make several choices regarding the functionality of the indicator itself.
General
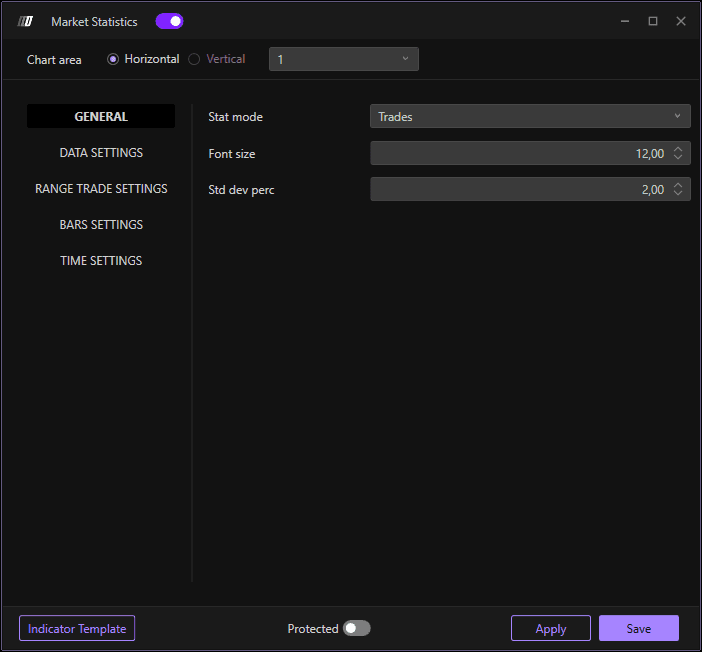
Stat Mode
Select the type of statistics to display:
Trades: Displays statistics based on the number of trades/contracts.
Bars: Provides a display of statistics related to bars and candles.
Font Size
Set the size of the displayed text for better readability of statistics on the graph.
% Dev. Std. (Standard Deviation)
Setting the percentage of standard deviation. Standard deviation is a statistical measure that indicates how far the values of a set of data deviate from the mean of those values.
Understanding Standard Deviation: The higher the standard deviation, the further from the mean the data are; the lower it is, the more concentrated the data are around the mean.
Lower deviation (e.g., 0.5-1.5): Filters out values closest to the mean, finding only those closest to the center frequency of volumes.
Higher deviation (e.g., 2-3): Broadens the selection to include values further from the mean, capturing a broader picture of less frequent activity.
Data Settings
Data Type
Determine the type of data you wish to analyze:
Volume: Measures the total amount of securities traded in a given time period.
Order: Tracks order data and placement information.
Aggregate Trades: Shows the total aggregate trades by combining trades at the same price level.
Filter Min
Lets you set a minimum filter value for the selected data, allowing you to exclude values below the chosen level.
Filter Max
Lets you set a maximum filter value for the selected data, allowing you to exclude values above this threshold.
Range Trade Settings

Initial Range
Defines the start value for trade range calculation. This sets the lower bound of the range you wish to analyze.
End Range
Specifies the last range value for which calculations will be performed, defining the range extension to be analyzed. This sets the upper bound.
Step Range
Sets the increment between each range value. This option allows you to determine how often the analyses are performed on the different range intervals. For example, a step of 50 would analyze ranges 0-50, 50-100, 100-150, etc.
Bar Settings
Base Data Bar
Choose the basis for bar statistics:
POC (Point of Control): The statistical calculation will focus on the POC of each bar.
Delta POC: The calculation will be done on the Delta POC, i.e., the point where the difference between purchases and sales is greatest.
Volume: The calculation will be done on the volume of trades occurring for each bar.
Time Settings
Defines time limits for calculating statistics, specifying a start and end filter to select the time range of interest.
Initial Filter
Sets the start time from which to collect data. For example, starting 15 minutes after market open to exclude opening volatility.
End Filter
Defines the end time for data collection, allowing the analysis to be restricted to a specific interval of the trading day. For example, ending 15 minutes before market close to exclude closing volatility.
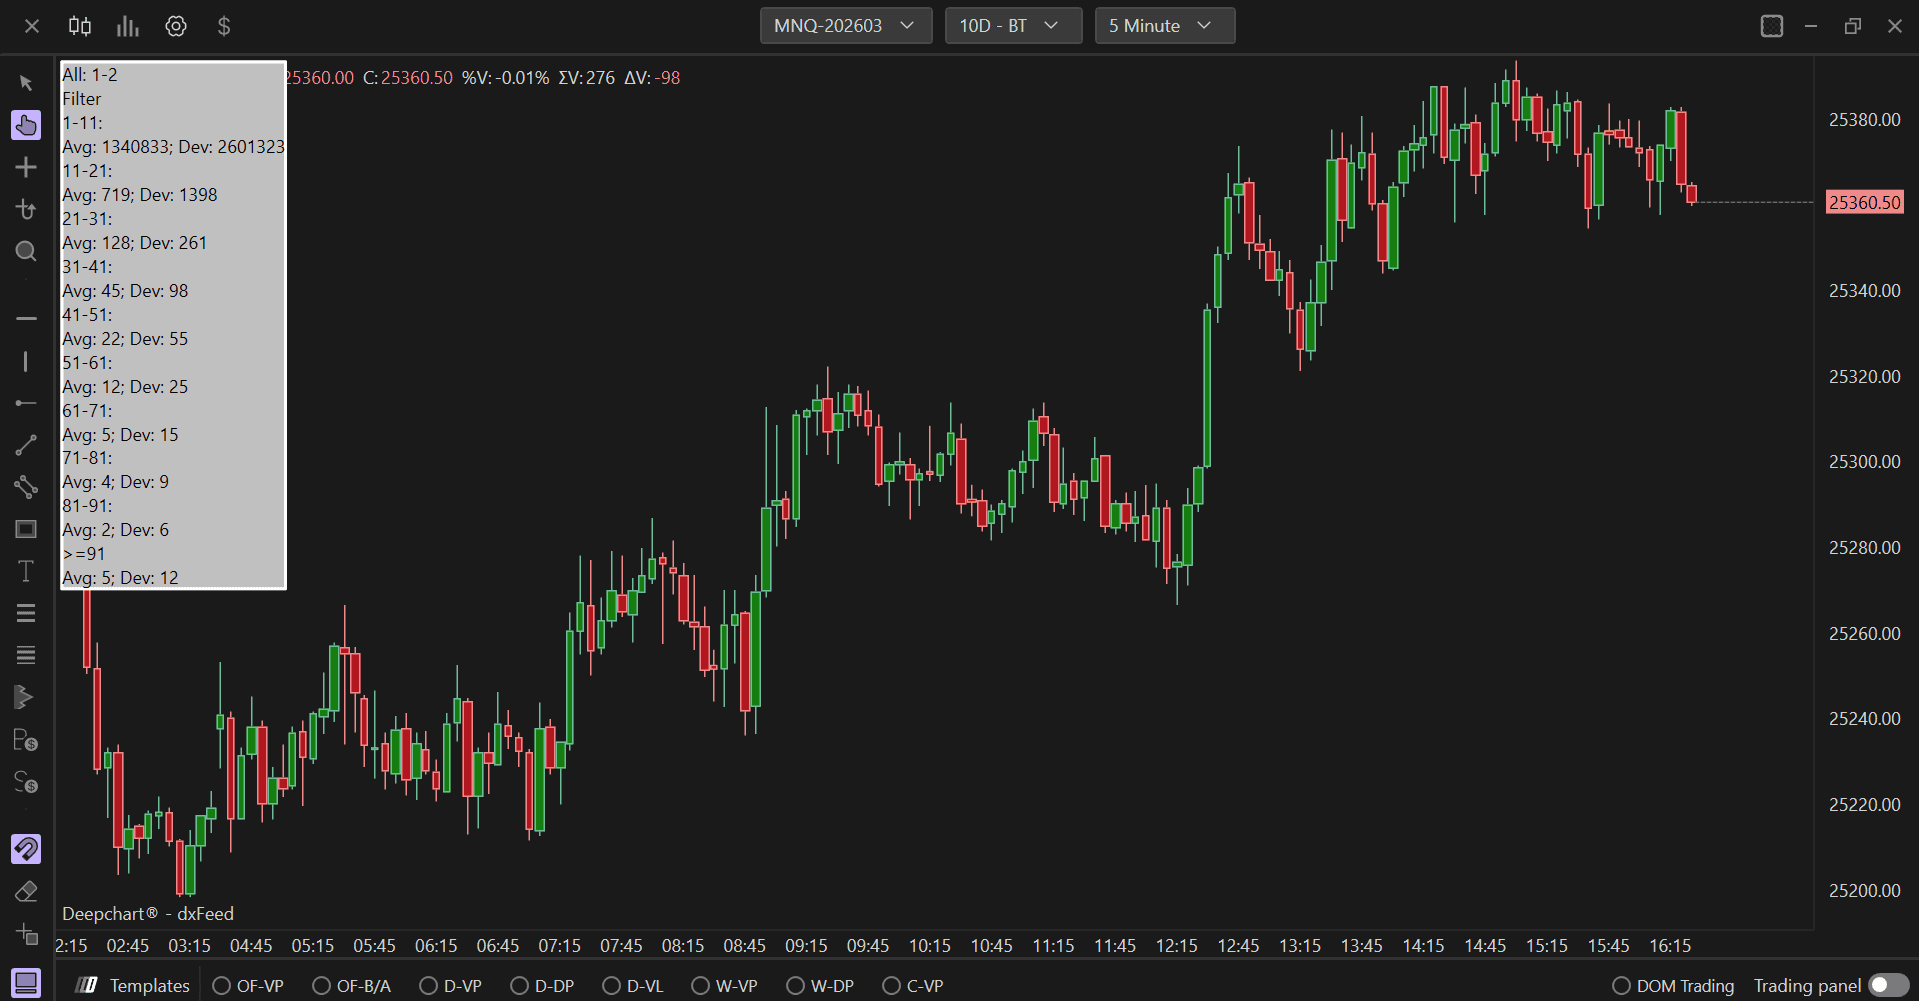
Understanding Statistics Output
The Market Statistics indicator displays results in range groupings, showing:
AVG (Average): The average number of events recorded for each range, showing how many times values in that range occurred during the analysis period.
Dev (Deviation): The maximum observed deviation for the corresponding range, showing the peak frequency observed.
Example: If a range "300-350" shows AVG: 9 and Dev: 17, this means aggregate trades in that size range occur on average 9 times per day, with a maximum of 17 occurrences observed.