Indicators
Updated:
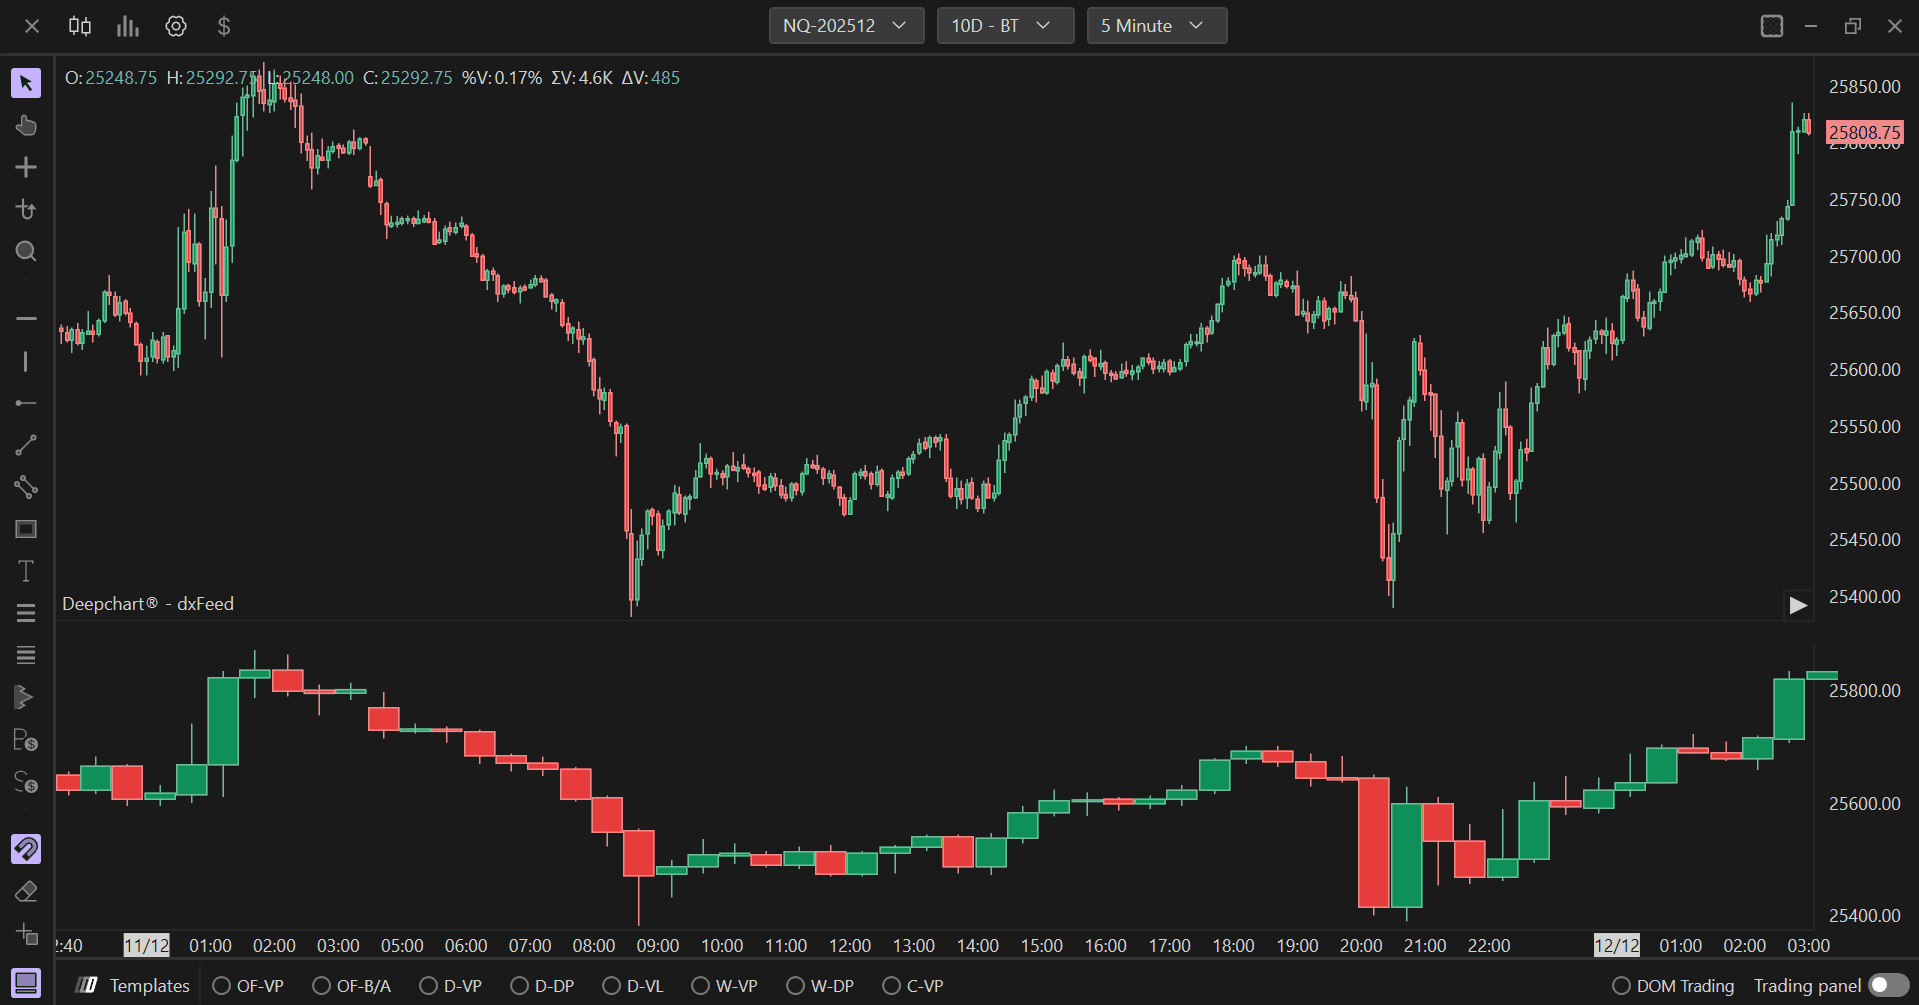
The Deepcharts Overlay Chart indicator allows you to display the chart of another financial instrument on the main chart, allowing you to monitor multiple instruments at the same time. This can be done by creating a secondary chart area or by overlaying the two charts.
Unlike the Overlay Symbol indicator, the Overlay Chart indicator allows for greater customization. In fact, it is possible to set the time frame of the secondary chart, for example displaying a 5-minute chart and a 30-minute chart at the same time.
Using Settings
By clicking on the indicator settings icon, the relevant configuration window will open, within which it will be possible to make various choices regarding the indicator's functionality.
Parameters

General
Select Symbol: Click on Select to choose the symbol you want to overlay
Parameter Type: Defines the chart type. Choose between: Minutes, Days, Weekly, Monthly, Vol Bars, Range, Volume, Trade, Renko, Seconds, Point Figure, and Delta
Param 1: Defines the reference parameter for time-based charts, Range, Volume, Trade, Renko, Delta, as well as the first parameter in Vol bars and Point figure charts
Param 2: Defines the second parameter in the Vol bars and Point figure graphs
Volume/Delta
Delta-based Color: If enabled, the color of the candles will vary depending on the delta of each one
Open/Close Based Border: If enabled, the color of the candlestick border will vary depending on whether the candlestick is bullish or bearish
Delta Input: Defines the database for delta calculation (Volume or Trades)
Color Mode: Defines how to color the bars in case of delta-based color (Fade or Fixed)
Std. Dev. for Coloring: Defines the standard deviation value for the fade mode
Subgraph

By clicking on the Subgraph item at the top you can:
Change Border Color: Set the border color of the candles
Change Filling Color: Set the fill color of the candles
Chart Style: Choose between Line, Candlestick, OHLC, Hidden, and Candlebody charts
Border Width: Define the border width of the candles
Chart Area
If you want to overlay the two charts in the main chart area, select Chart Area 1 at the top of the indicator window.
Important: Remember to enable the Use Secondary Axis option if the price scale of the two instruments is different.