Indicators
Updated:
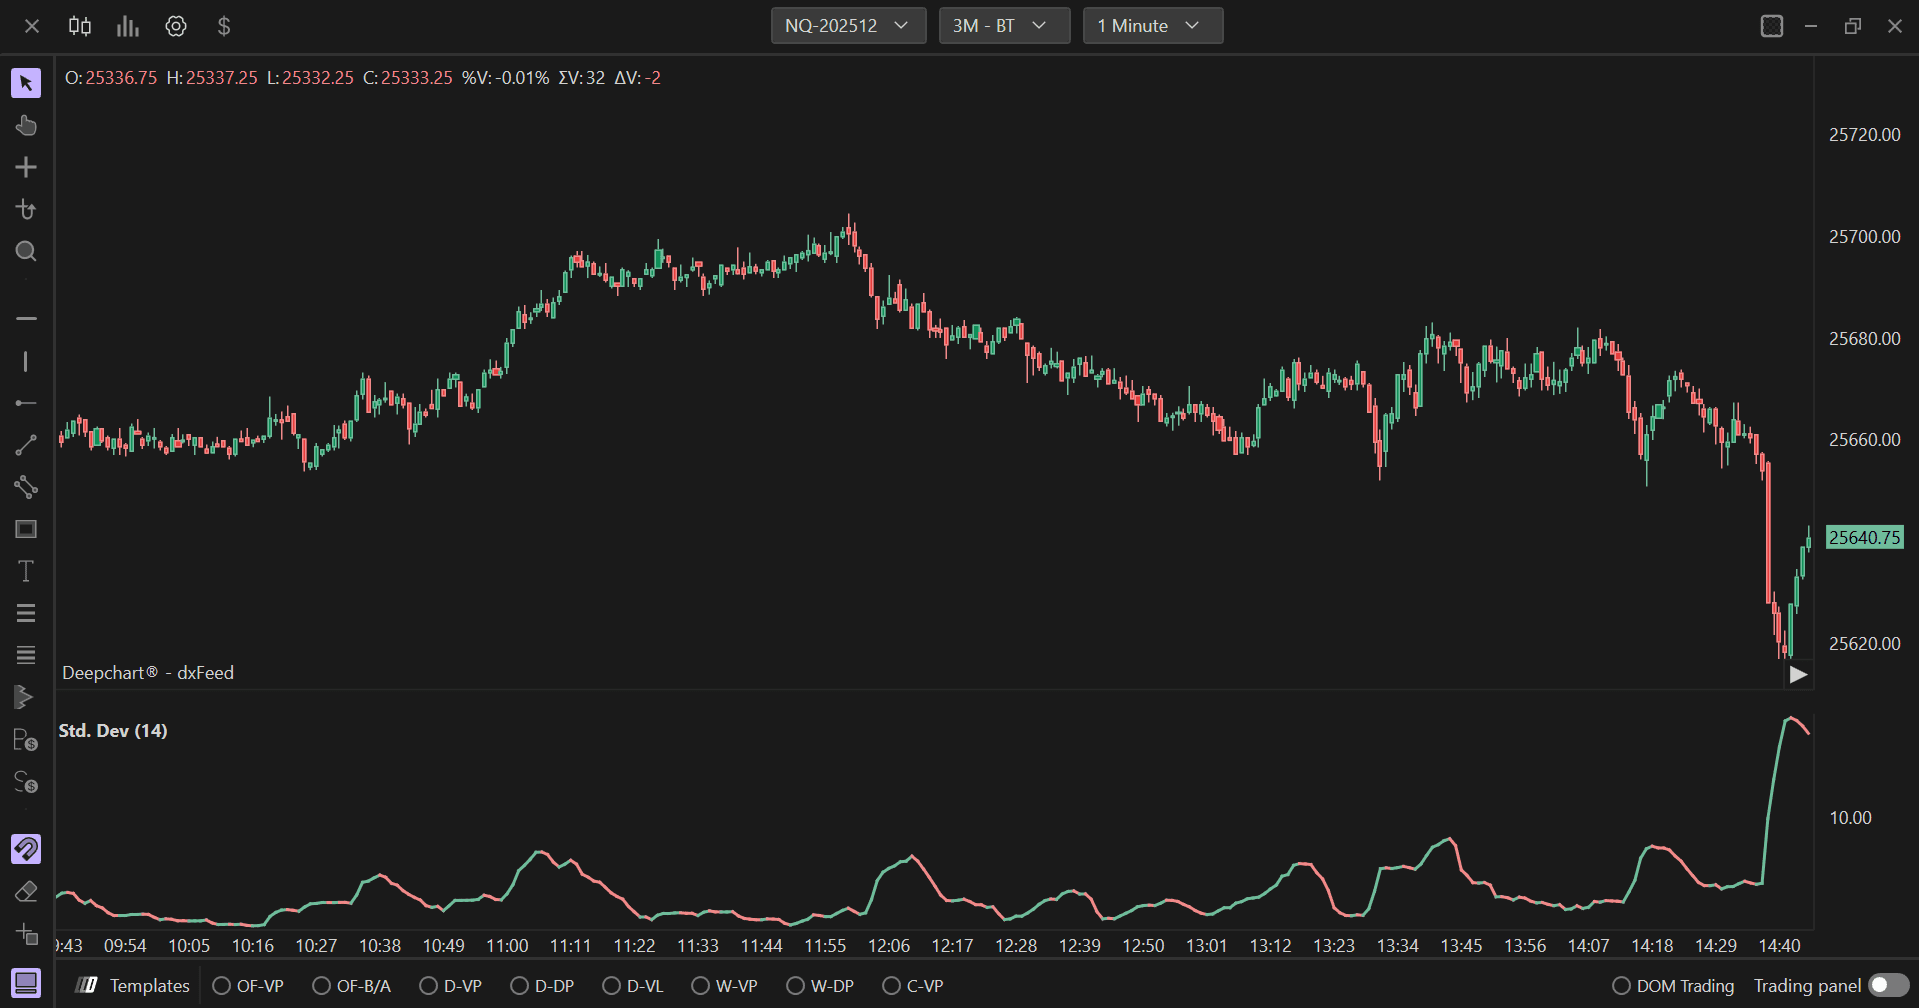
The Standard Deviation indicator measures the volatility of an asset's price relative to its average over a given period. It indicates how far price values deviate from the average itself on average: high values of standard deviation signal higher volatility (prices moving away from the average), while low values indicate lower volatility (prices staying closer to the average).
Using Settings
Clicking on the indicator settings icon will open its configuration window, within which you can make several choices regarding the indicator's functionality.
Parameters

In the Parameters section you can set the indicator periods:
Periods: The number of periods used for the standard deviation calculation (default: 14 periods)
Subgraphs
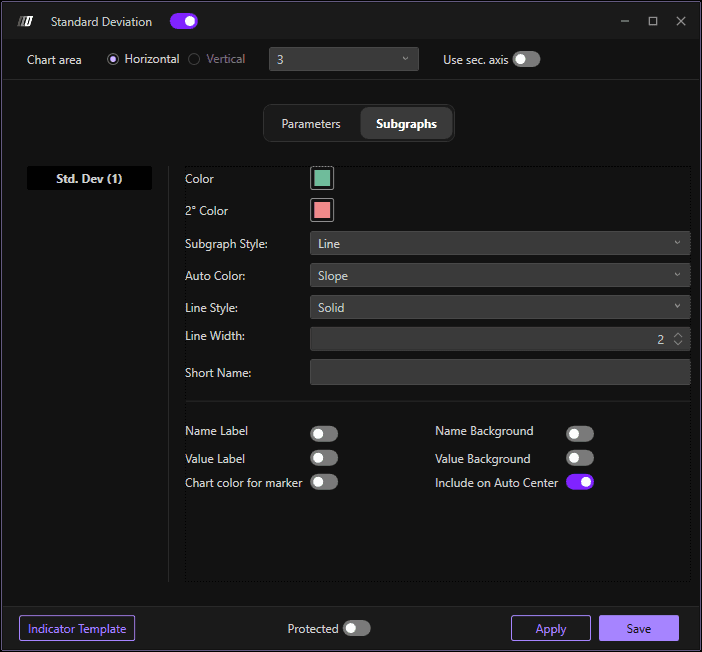
In the Subgraph section you can change the colors and style of the indicator:
Std. Dev Color: Set the color of the standard deviation line
Secondary Color: Set an optional secondary color
Subgraph Style: Choose the display style
Line Style: Define the line style
Line Width: Define the width of the indicator line (default: 02)
Use Secondary Axis: Option to display on a secondary axis