Trading
Updated:
Strategy Reports
The Show Reports module allows in-depth examination of your trading operations.
To generate a performance report:
Click on the Trading menu in DeepChart and select Strategy Report.
Choose the Broker and Account you want to analyze.
Use the scroll wheel at the top-right corner to select the desired date range and symbols.
Click Generate Report to start the analysis.
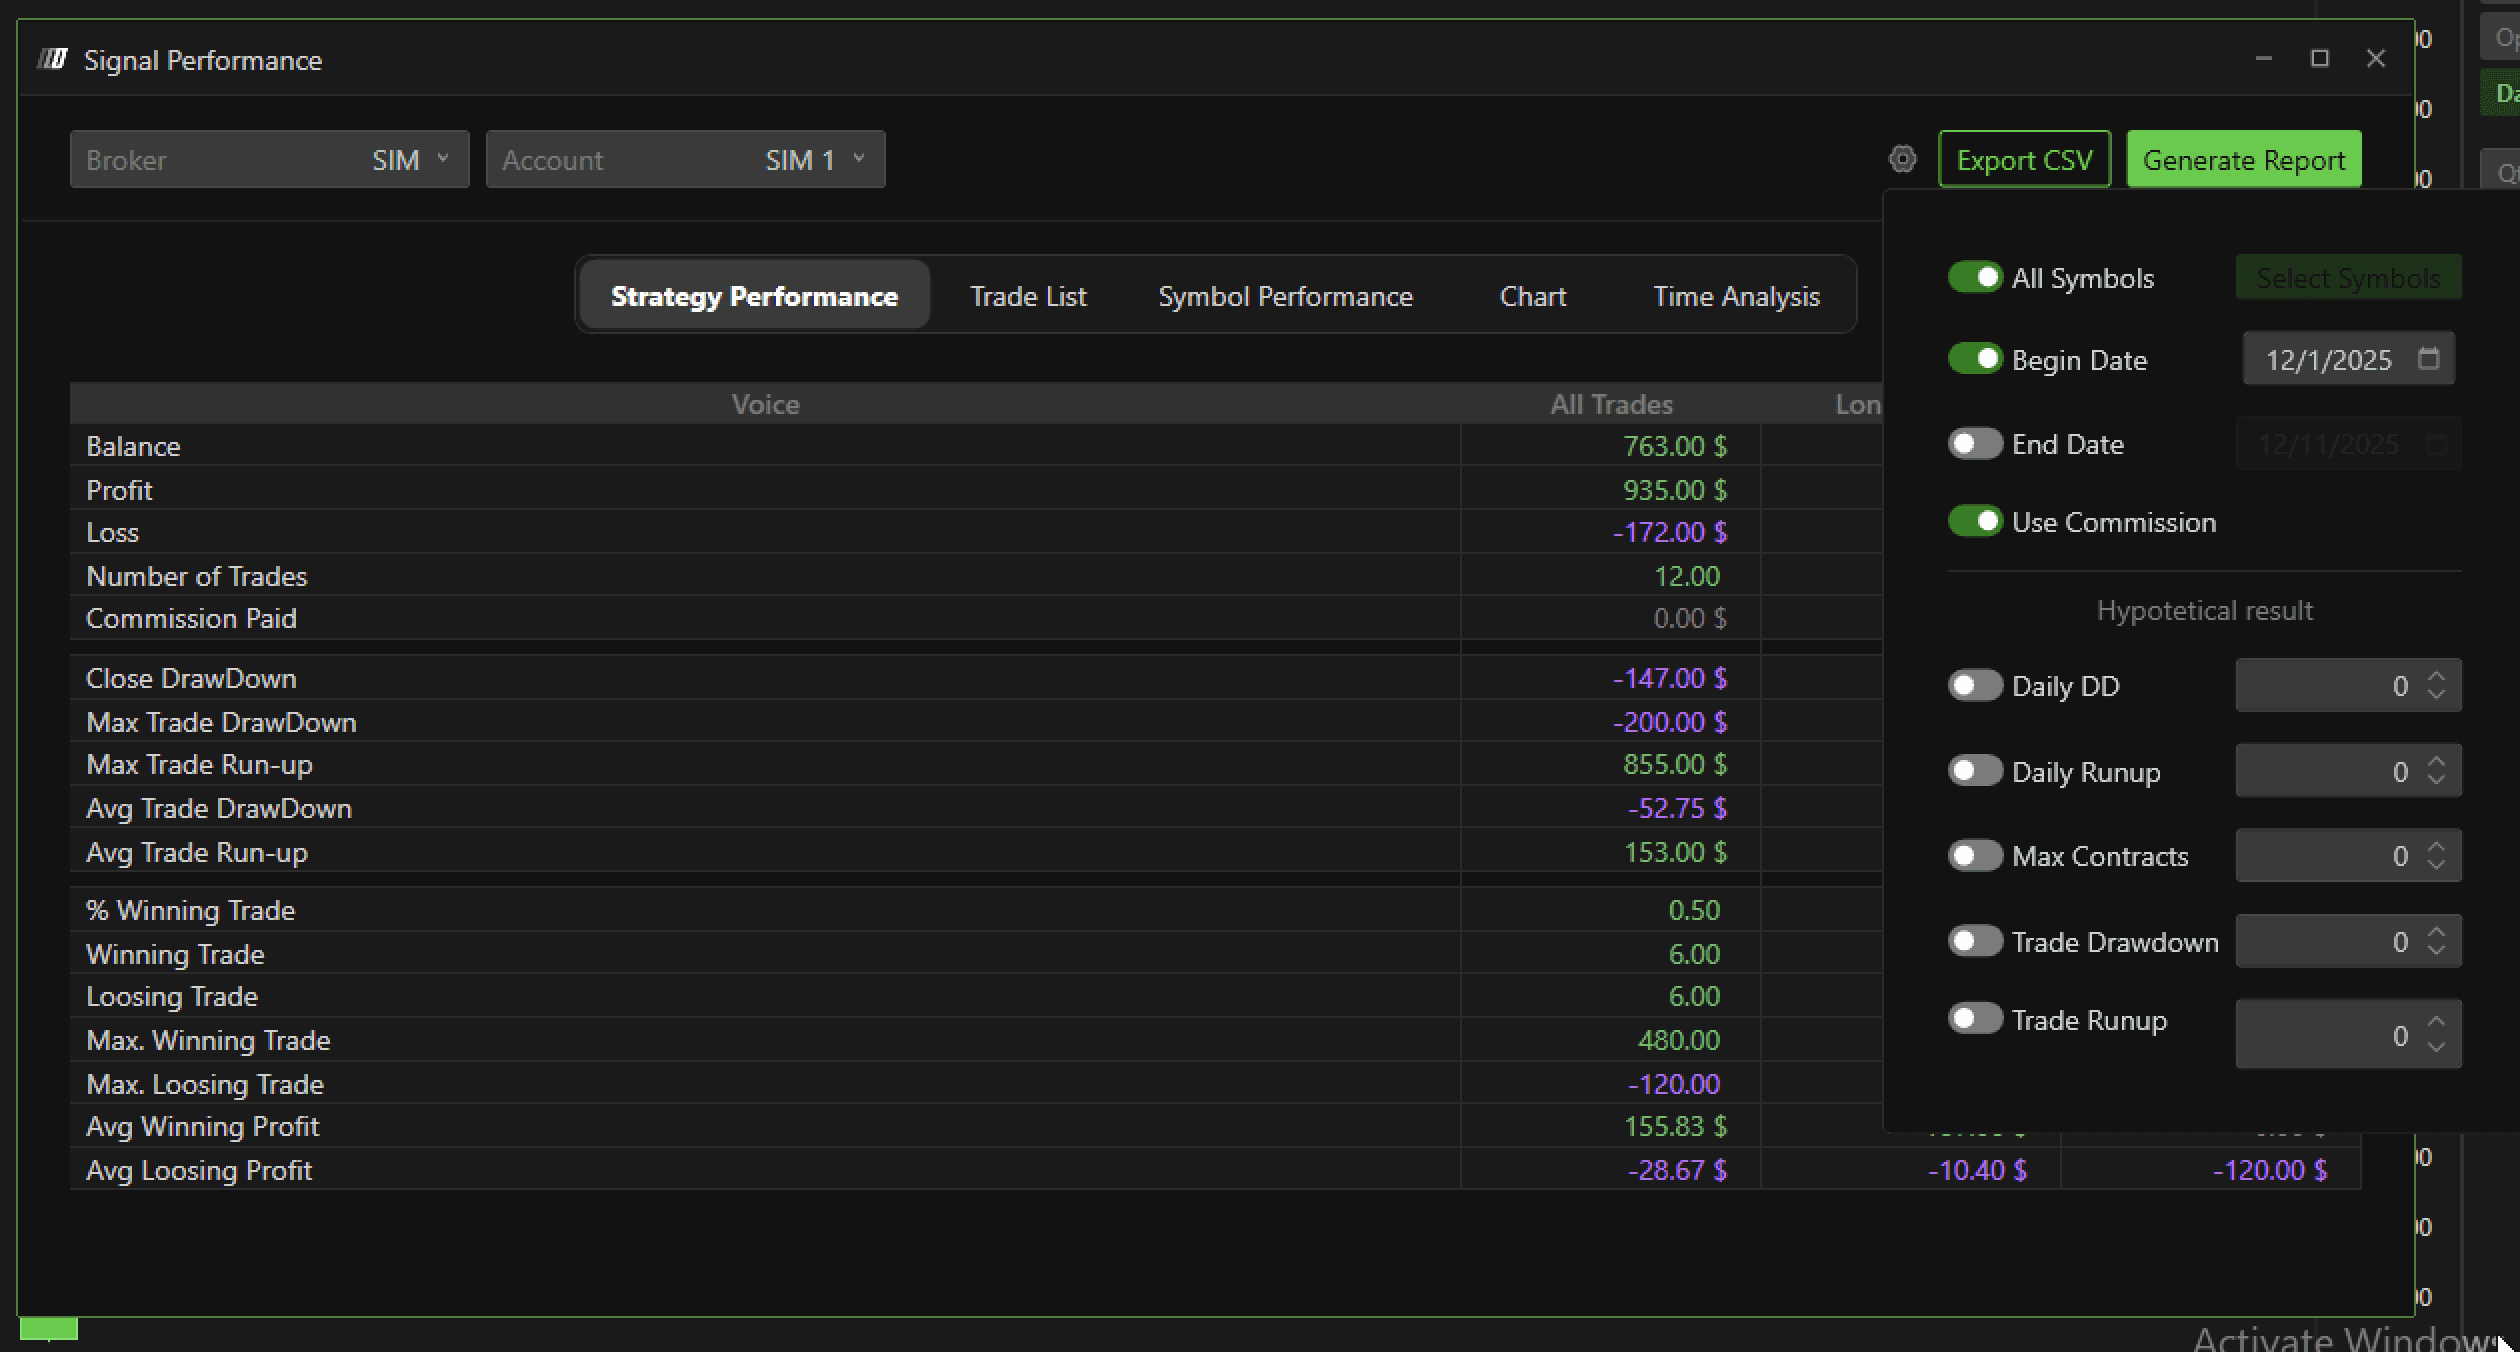
Strategy Performance
This section provides a summary of operations for the selected period:
Balance for the period
Profit made
Losses made
Number of trades executed
Commissions (if enabled)
Additional insights include:
DrawDown and Run-up
Percentage of winning trades
Data is divided into:
Long Executes
Short Executes
All Executes
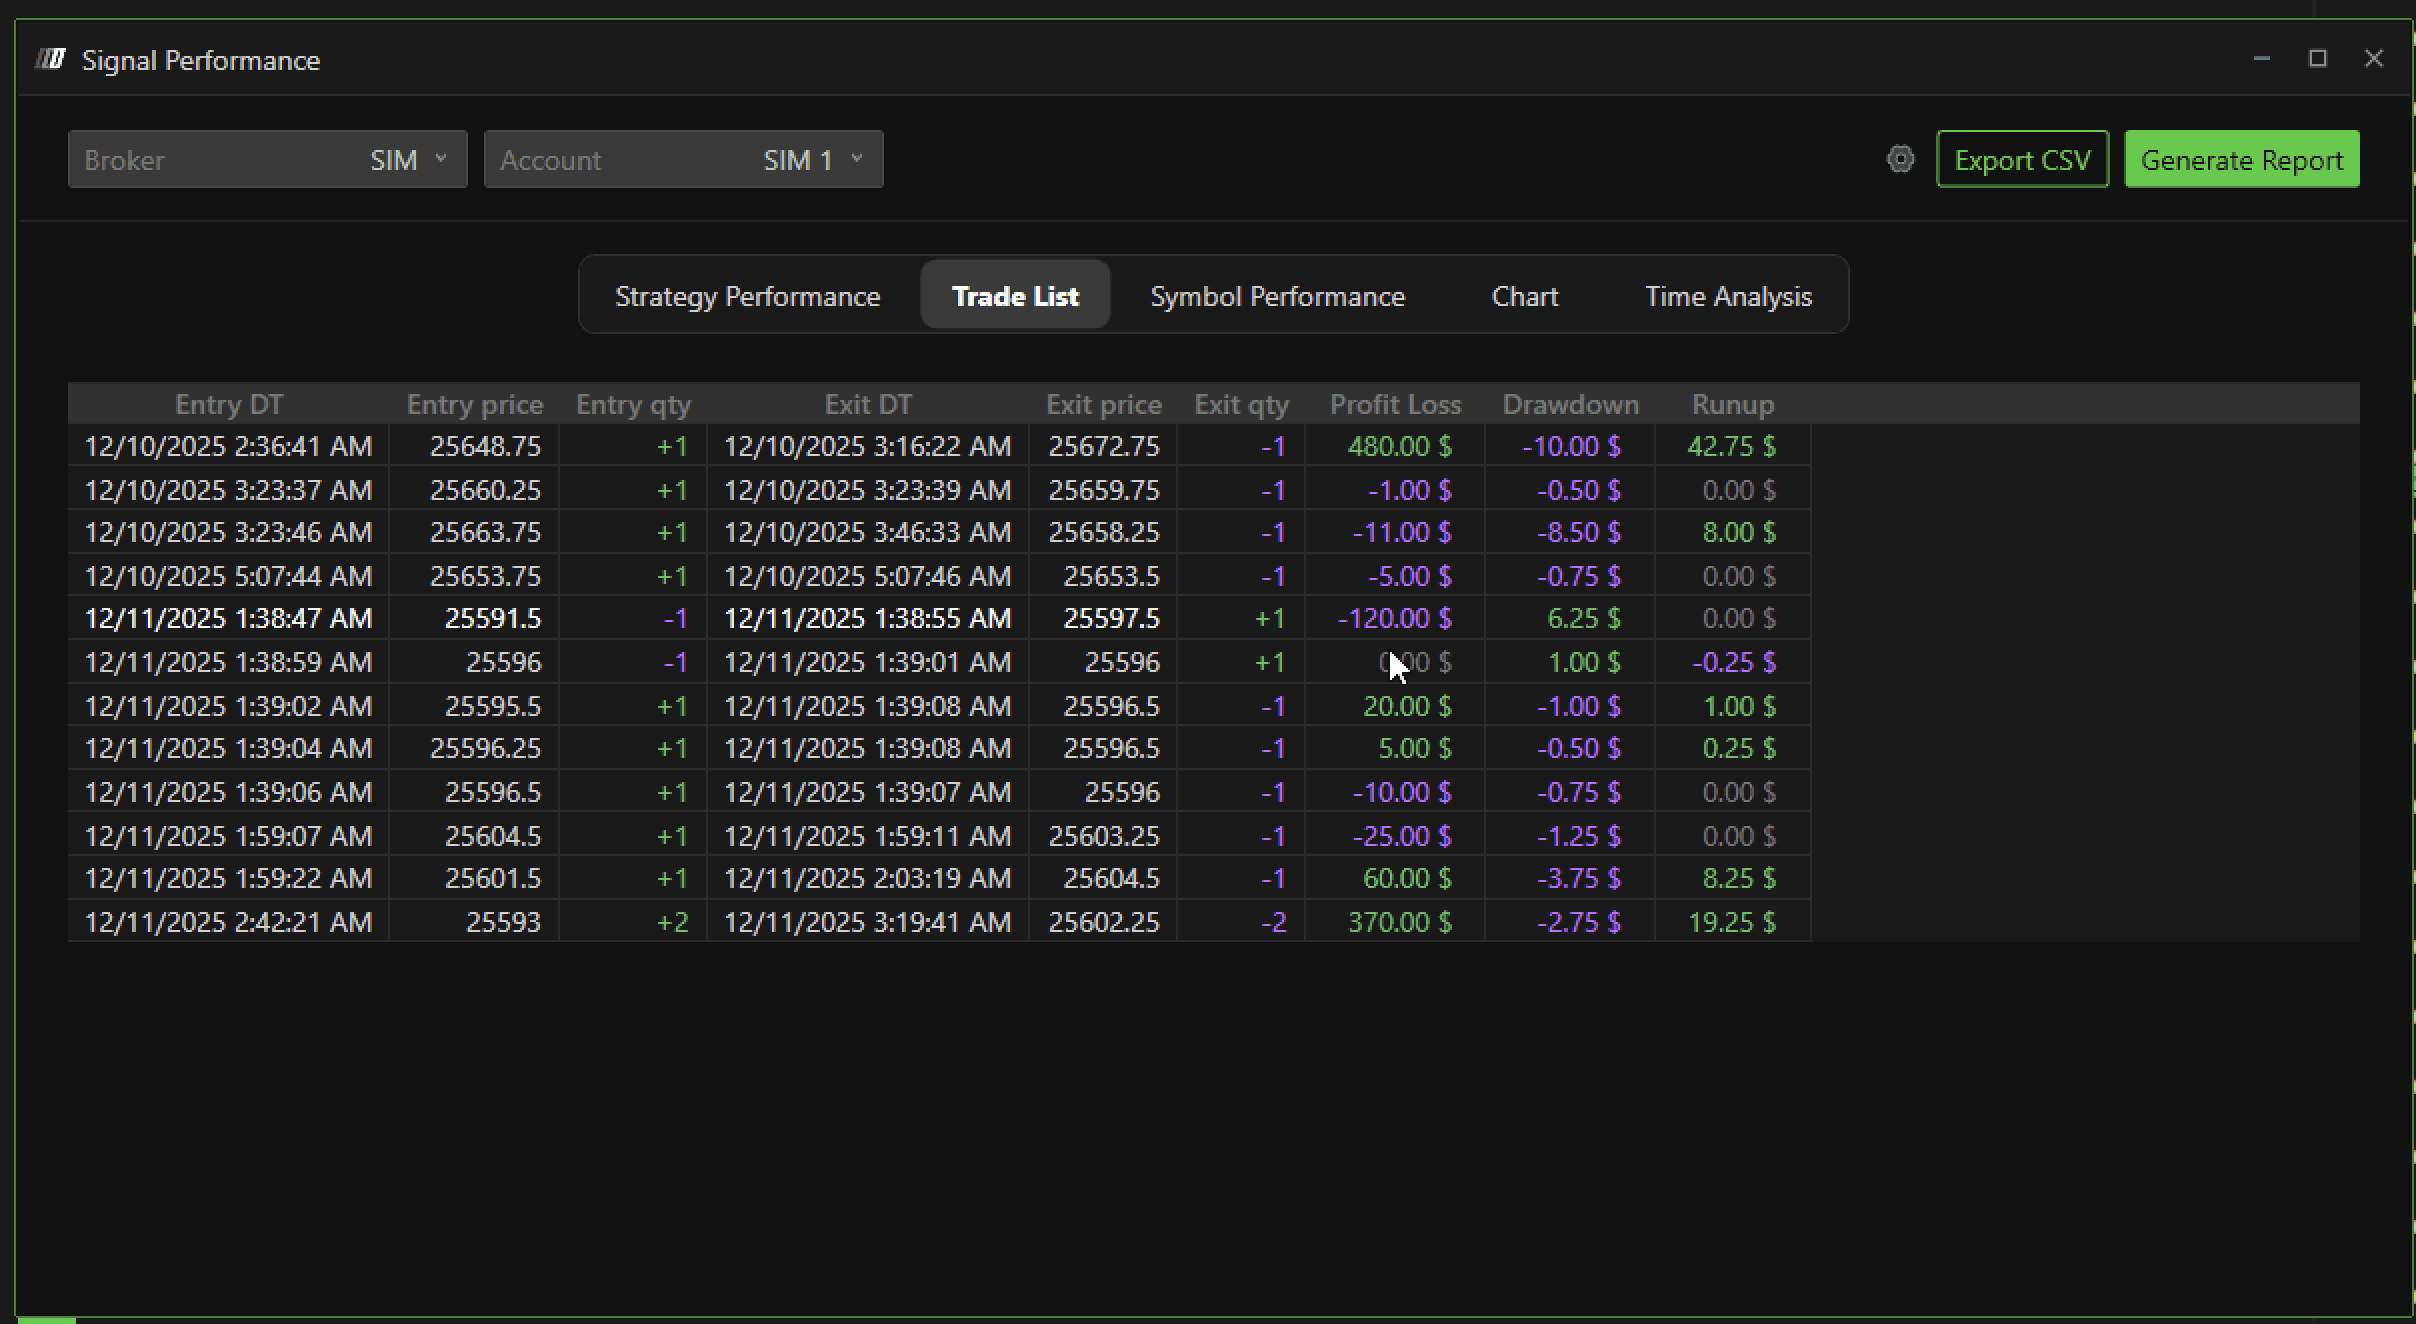
Trade List
Shows a detailed view of each trade, including:
Entry and exit time
Entry and exit price
Quantity traded
Profit, DrawDown, and Run-up per trade
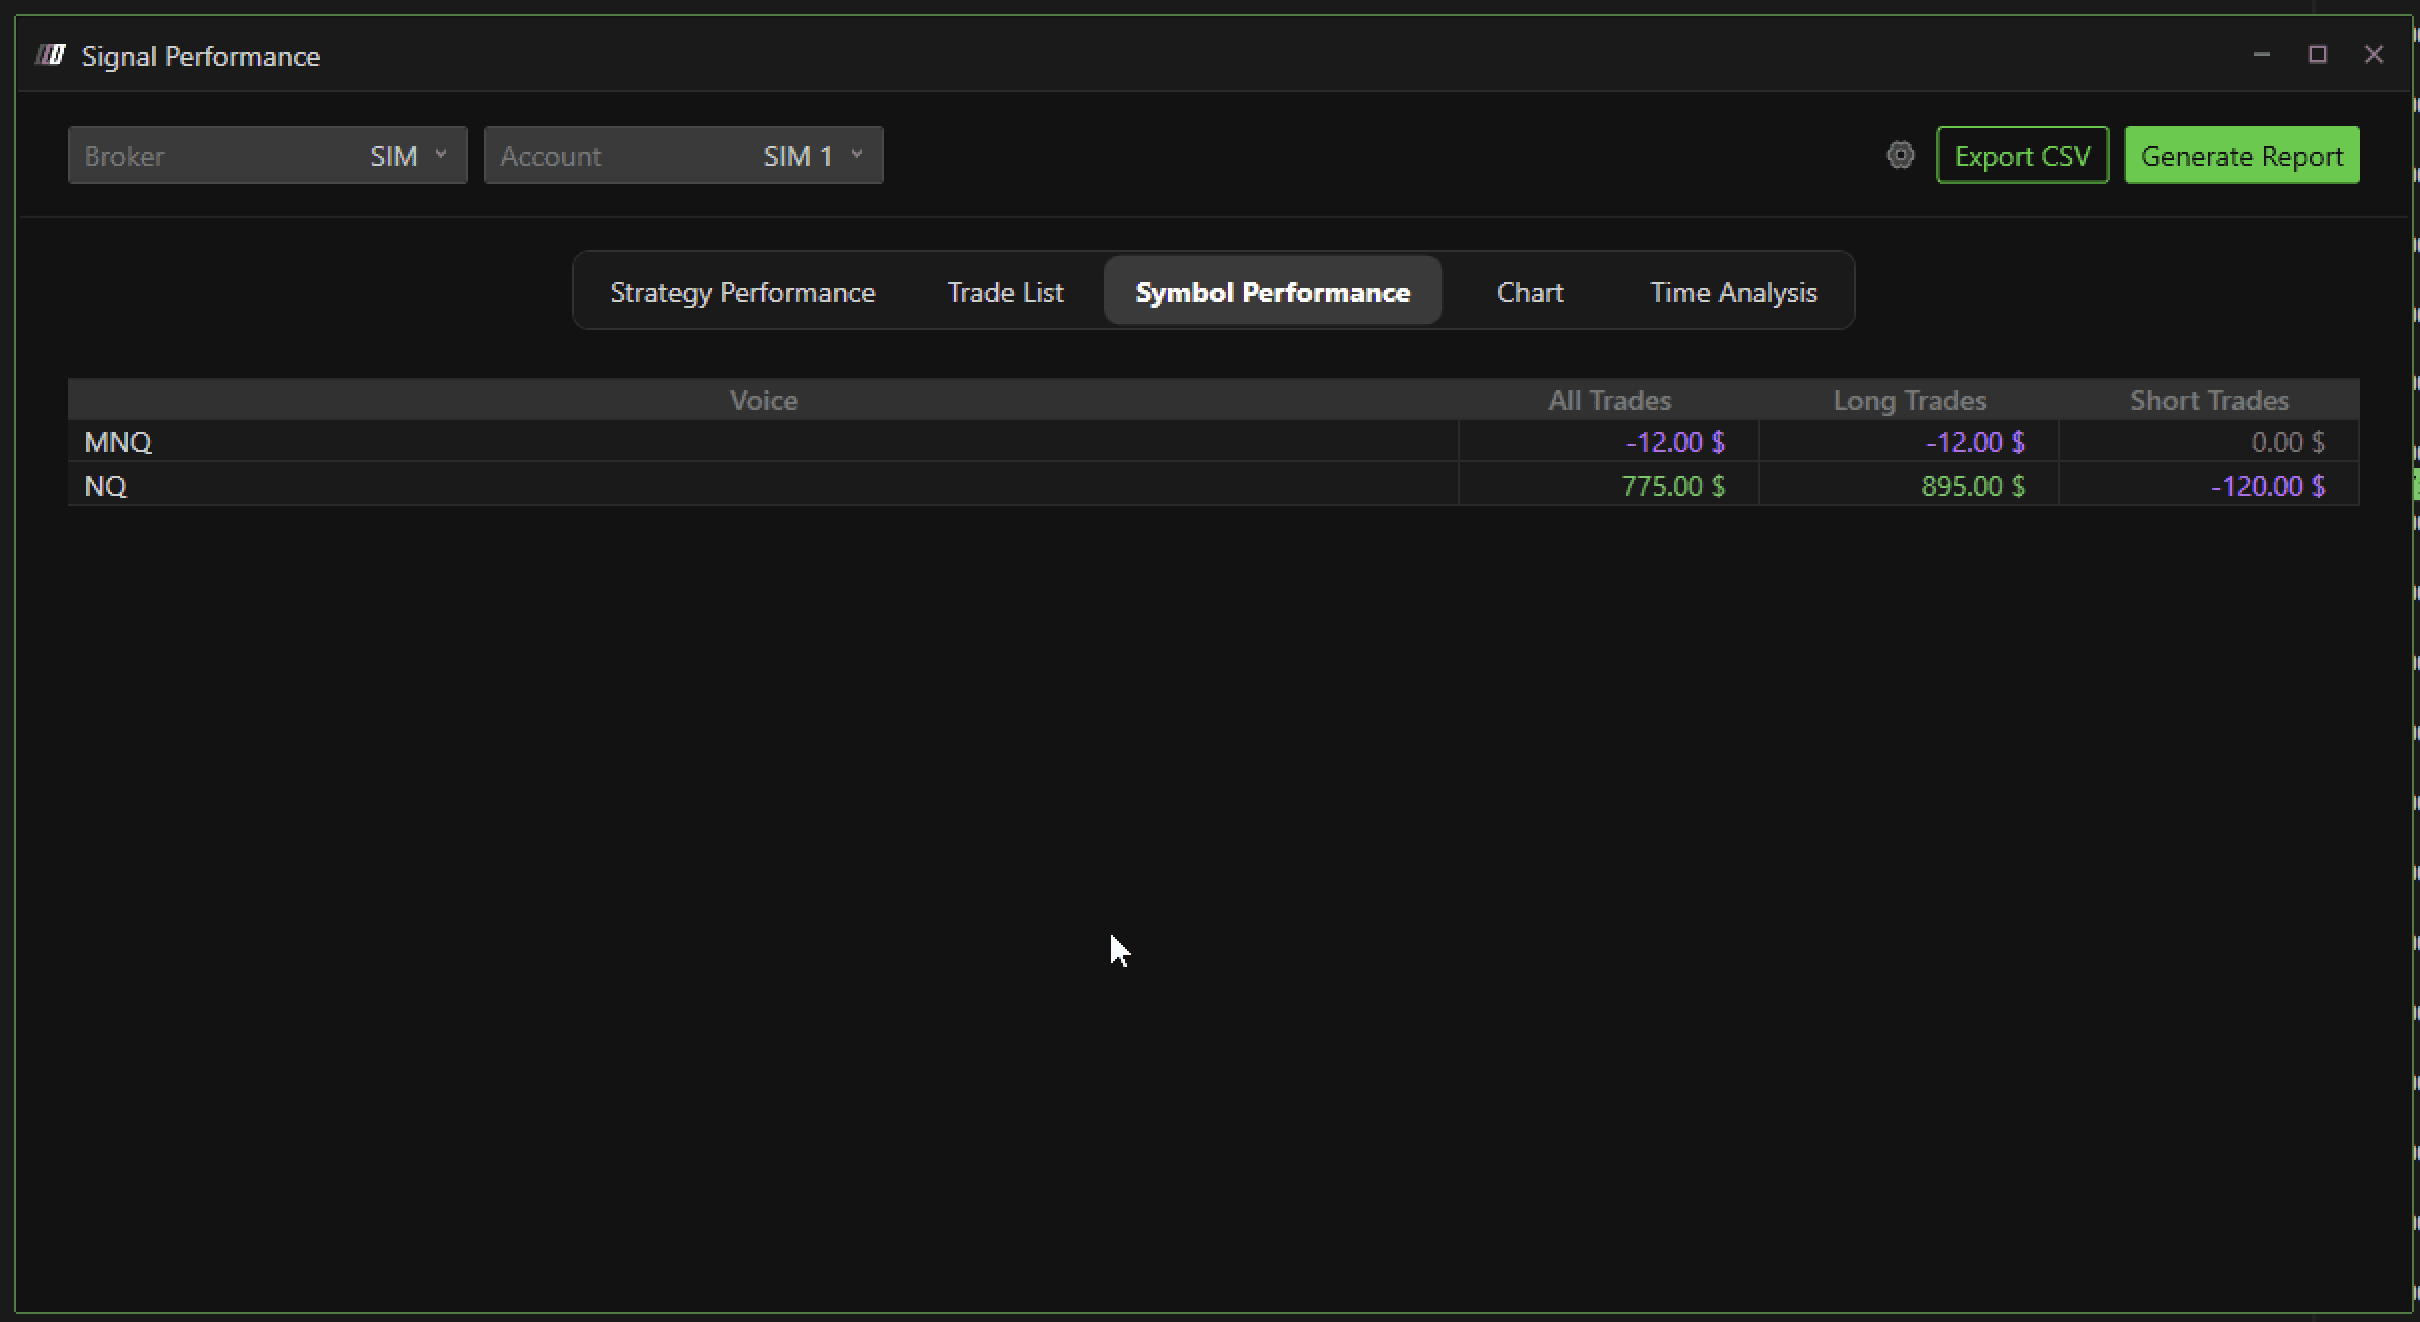
Symbol Performance
Displays the balance per symbol traded during the selected period, helping you identify the most and least profitable instruments.
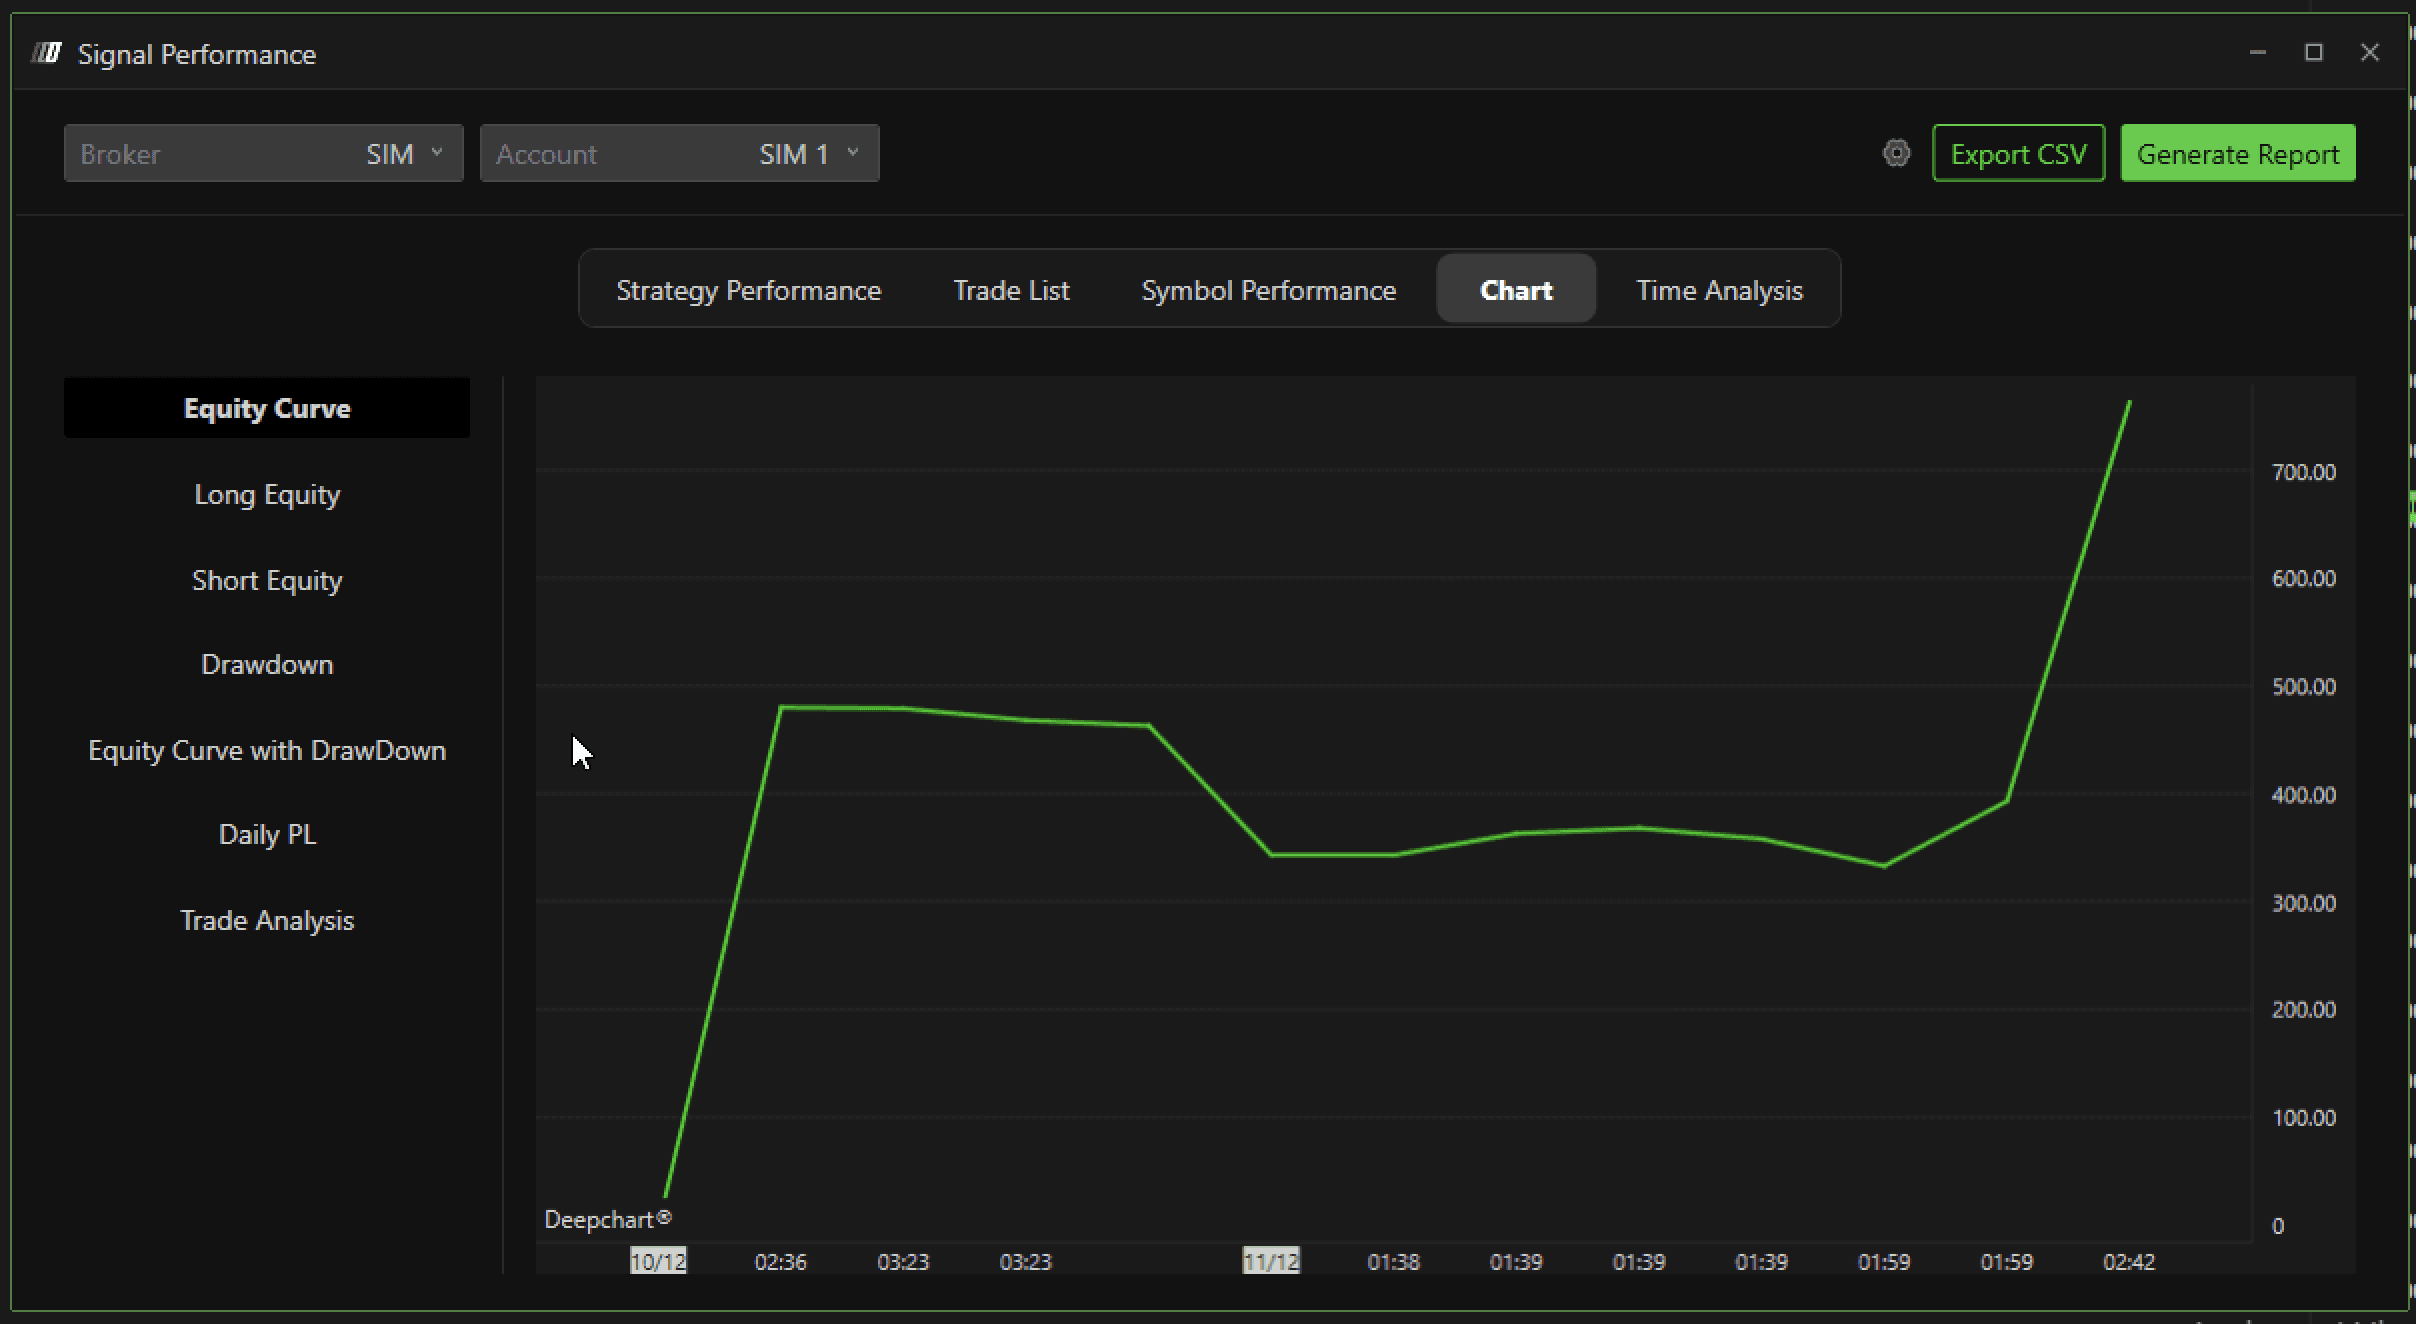
Chart
Provides several visual charts related to trades, allowing you to:
View the equity curve
Analyze drawdown
Examine individual trades
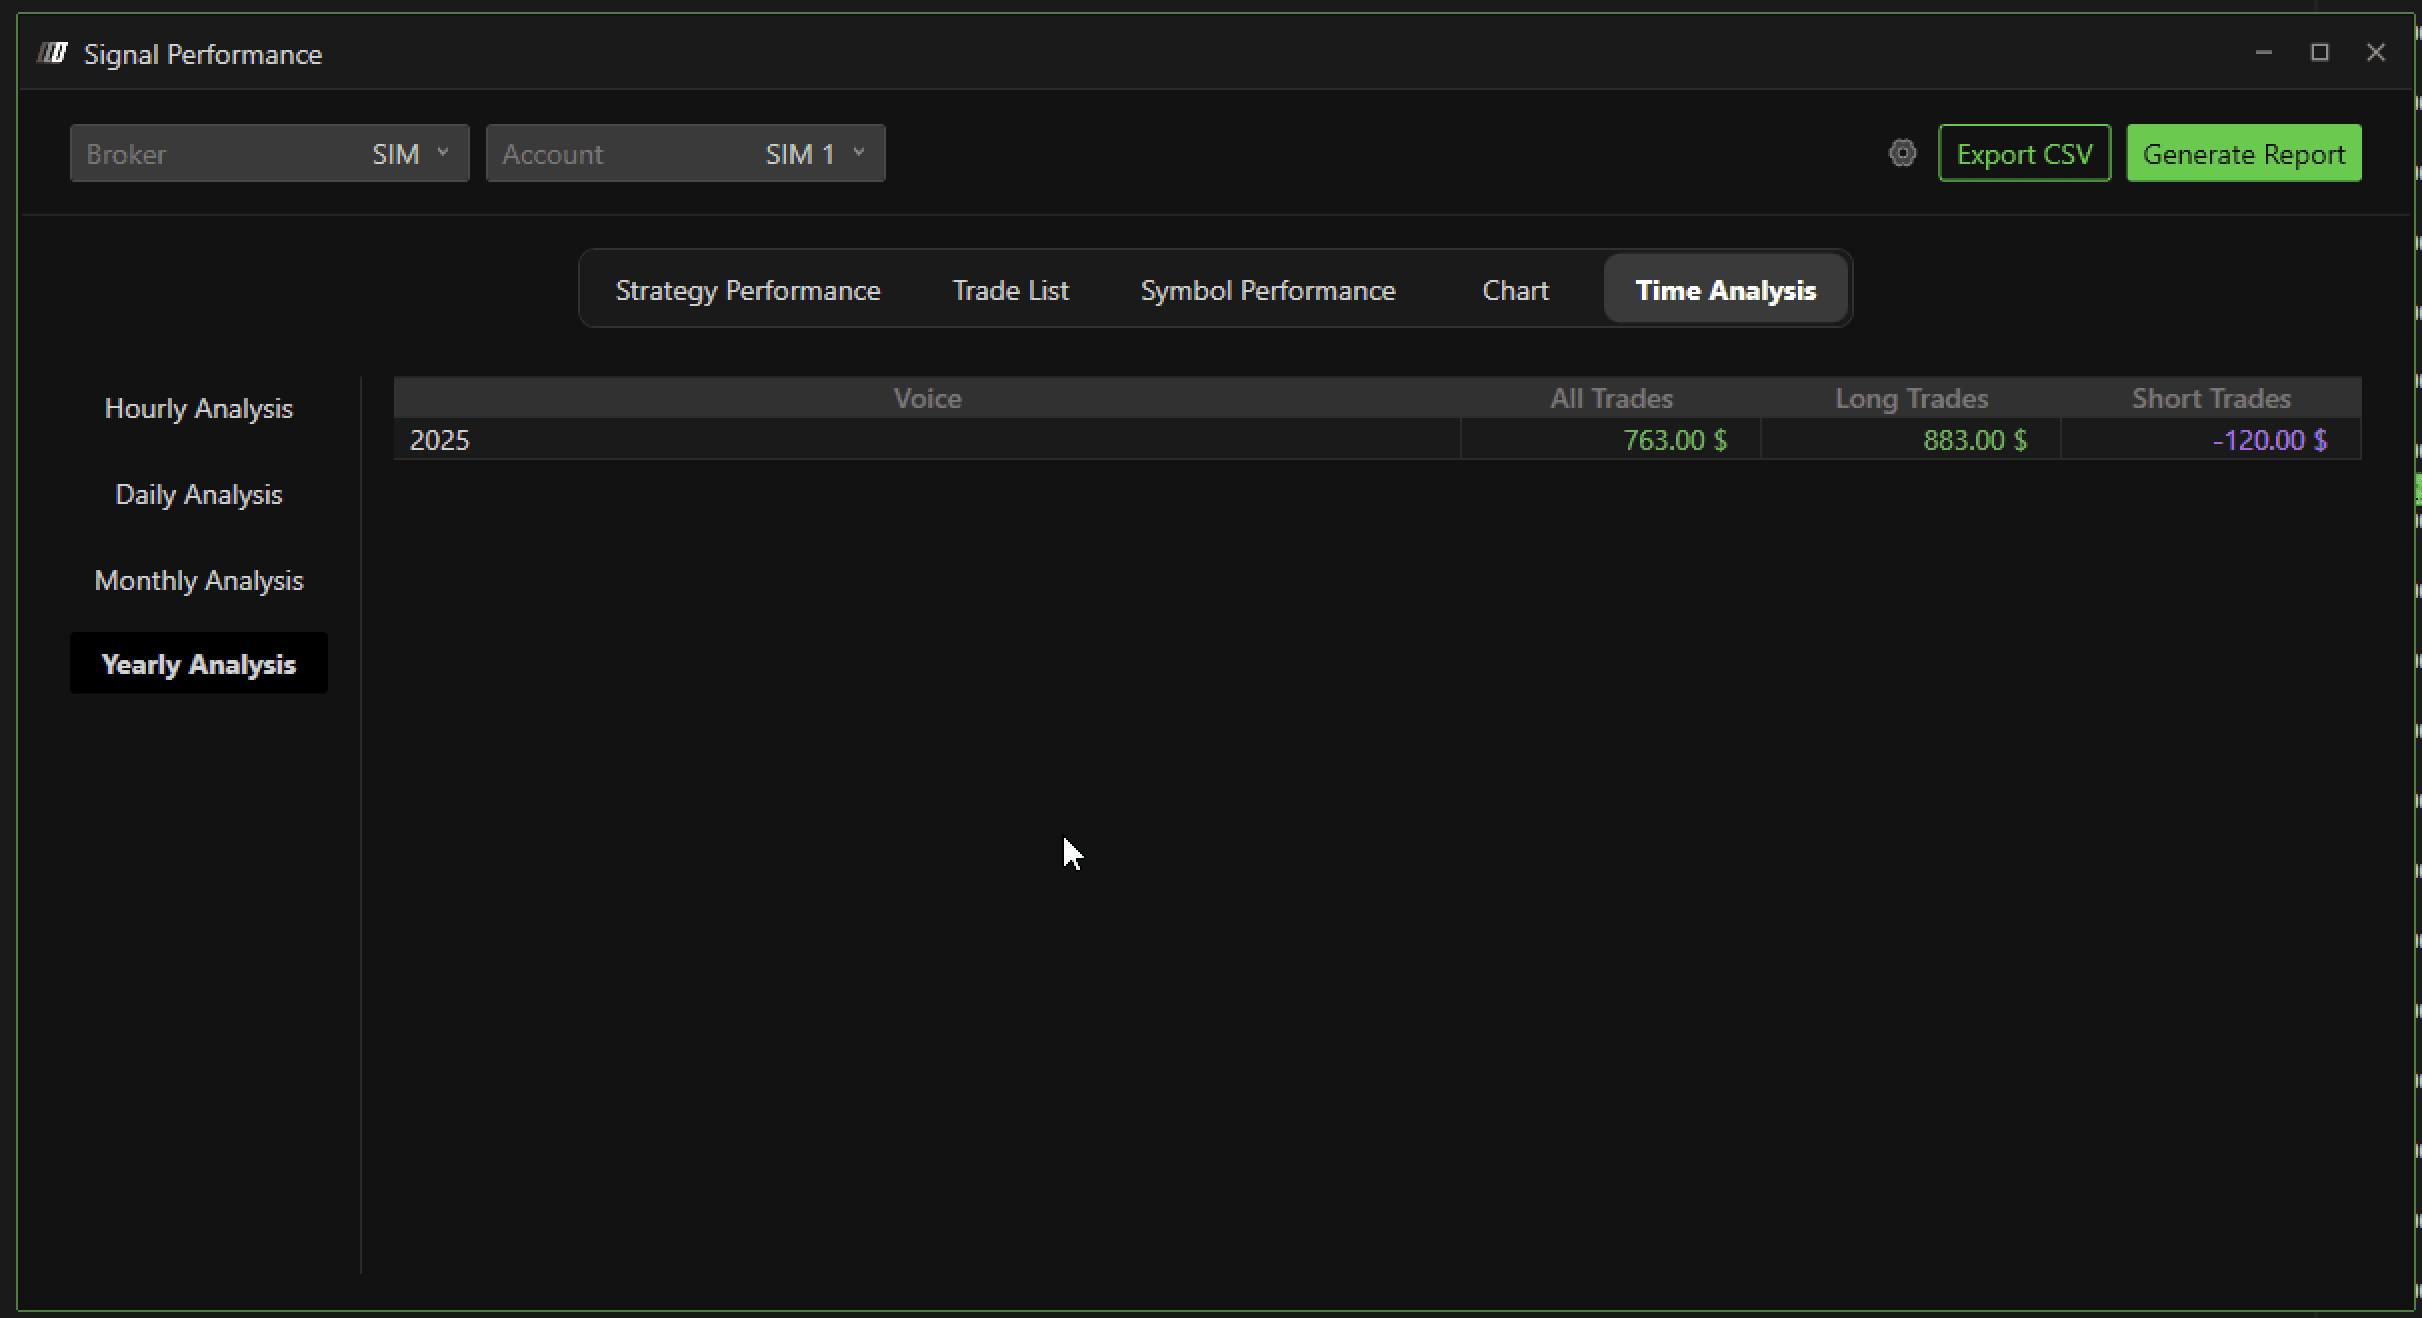
Time Analysis
Shows the profitability by hour of the day, highlighting:
Hours when trading is most profitable
Hours when trading is least favorable
This helps you adjust your trading strategy, such as avoiding trades during low-performing hours.
Additional options:
Analyze daily, monthly, or annual performance