Indicators
Updated:
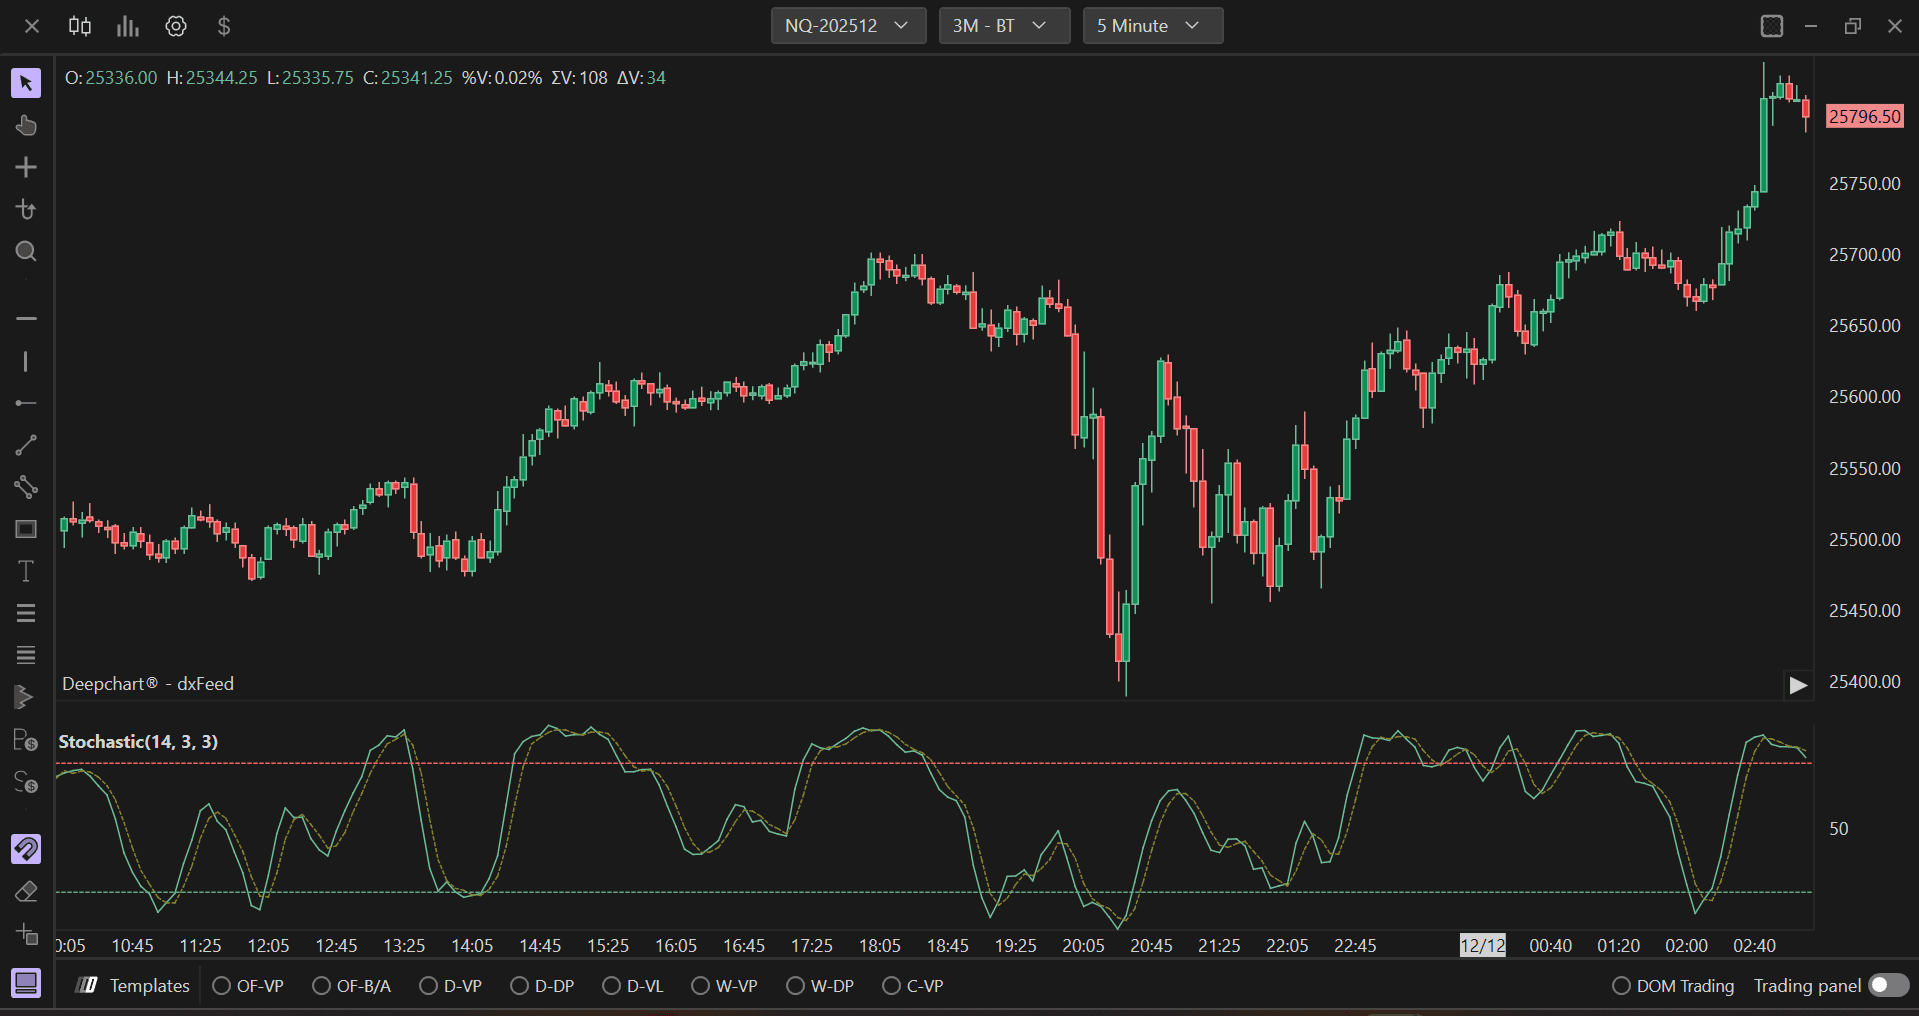
The Stochastic Oscillator is a technical analysis indicator that measures the position of the closing price of an asset relative to its price range over a specific period. It is used to identify overbought and oversold conditions, providing signals of possible trend reversals or confirmations of existing trends.
The stochastic oscillator is a momentum indicator, developed by George Lane, that compares the current closing price with the highs and lows of a given number of periods. It is measured in percent. The stochastic oscillator is represented by two lines:
K Line: The main line of the indicator
D Line: A moving average of the K line
Using Settings
Clicking on the indicator settings icon will open its configuration window, within which you will be able to make several choices regarding the functionality of the indicator itself.
Parameters
In the Parameters section you can configure the stochastic calculation:
General

Set the periods of K and D lines:
K Period: The number of periods for the K line calculation (default: 14)
D Period: The number of periods for the D line moving average (default: 3)
Smoothing Length: Additional smoothing applied to K line (default: 3)
Level Settings
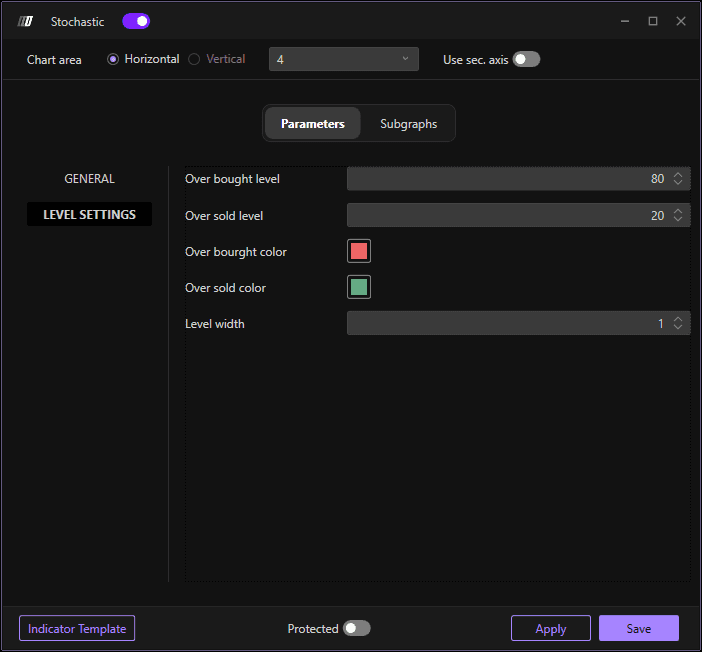
Configure the overbought and oversold thresholds:
Overbought Level: Level indicating overbought condition (default: 80)
Oversold Level: Level indicating oversold condition (default: 20)
Overbought Color: Color for the overbought threshold line
Oversold Color: Color for the oversold threshold line
Level Width: Define the width of the threshold lines
Subgraphs

In the Subgraph section you can change the colors and style of K and D lines:
K Line Color: Set the color of the K line
D Line Color: Set the color of the D line
Secondary Color: Set an optional secondary color
Subgraph Style: Choose the display style
Line Style: Define the line style
Line Width: Define the width of the indicator lines
Use Secondary Axis: Option to display on a secondary axis