Indicators
Updated:
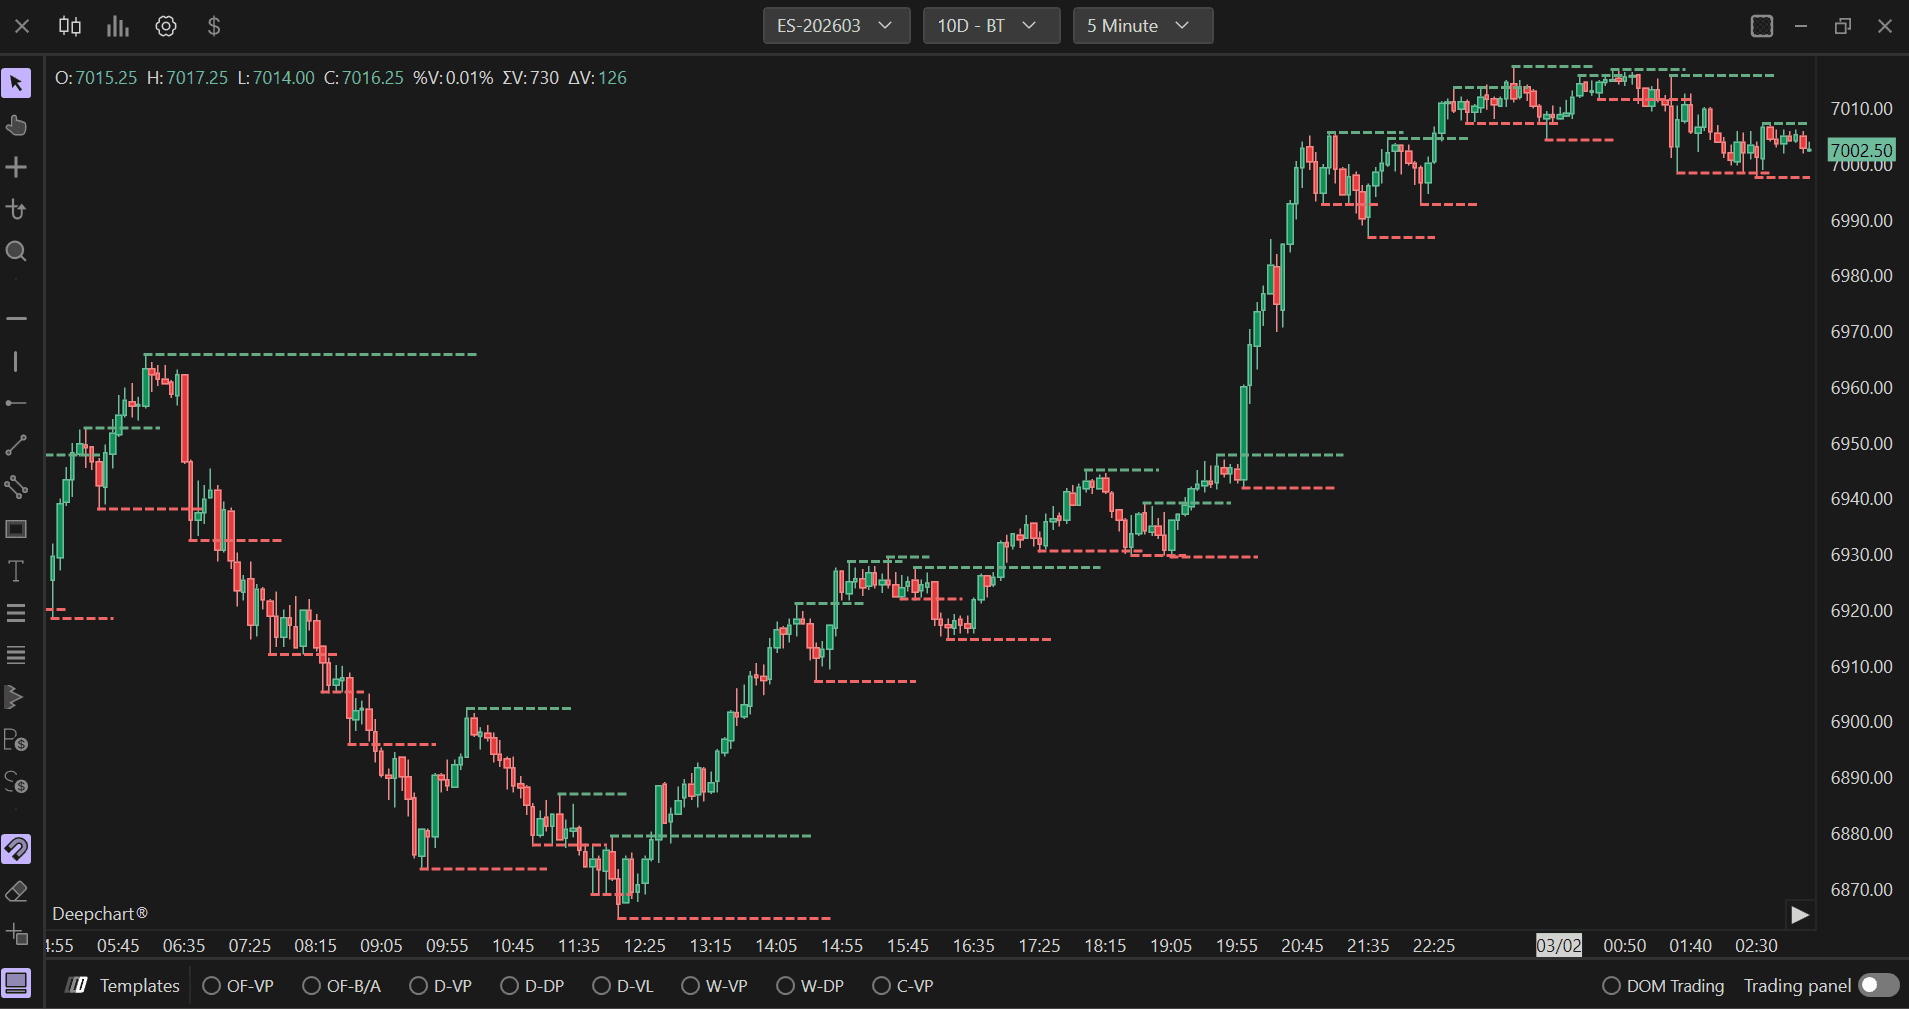
The Swing Points indicator identifies and marks significant swing highs and swing lows on the chart based on customizable lookback periods. It draws horizontal lines at these key price levels, helping traders identify support and resistance zones, potential reversal points, and important price structure in the market.
Settings of Use
Clicking on the indicator's settings icon will open its configuration window, within which it will be possible to make several choices regarding the functionality of the indicator itself.
General Parameters

Left Bars
Defines the number of bars to the left of a potential swing point that must have lower highs (for swing high) or higher lows (for swing low). The default value is 2. This parameter ensures that the identified swing point is a legitimate local extreme by requiring a certain number of bars before it to confirm the pattern. Increasing this value makes the indicator more selective, identifying only more significant swings.
Right Bars
Defines the number of bars to the right of a potential swing point that must have lower highs (for swing high) or higher lows (for swing low). The default value is 2. This parameter confirms that the swing point is valid by requiring price action after the extreme to validate the swing. Higher values mean the indicator will wait longer for confirmation, identifying more reliable but delayed swing points.
Filter Swing
When enabled, this option applies additional filtering criteria to the swing points. This can help reduce noise and false signals by eliminating minor swings that don't meet specific quality thresholds, focusing only on the most significant swing points in the price structure.
Plot Settings

Line Width
Adjusts the thickness of the horizontal lines drawn at swing points. The default value is 2. Increasing this value makes the swing point lines more prominent and easier to see on the chart, while decreasing it creates thinner, more subtle lines.
Line Style
Defines the style of the swing point lines. The default is "Dash" for dashed lines, which helps differentiate swing point levels from other chart elements. Other options may include solid, dotted, or other line patterns.
High Color
Sets the color for lines marking swing high points. This color is used to draw horizontal lines at identified swing highs, typically representing resistance levels or potential reversal zones where price has made a local peak.
Low Color
Sets the color for lines marking swing low points. This color is used to draw horizontal lines at identified swing lows, typically representing support levels or potential reversal zones where price has made a local trough.
Text Tick Offset
Defines the distance in ticks between the swing point line and any text labels that may be displayed. The default value is 1. This parameter helps position text annotations (such as price levels or labels) so they don't overlap directly with the horizontal lines, improving readability.
Text Size
Adjusts the size of any text labels displayed at swing points. The default value is 11.00. Larger text sizes make labels easier to read, especially on higher resolution screens or when working with multiple timeframes, while smaller sizes reduce visual clutter.
High Text Color
Sets the color for text labels associated with swing high points. This allows you to match or differentiate the text color from the high line color, providing clear visual identification of swing high levels and their associated information.
Low Text Color
Sets the color for text labels associated with swing low points. This allows you to match or differentiate the text color from the low line color, providing clear visual identification of swing low levels and their associated information.