Indicators
Updated:
The Absorption indicator identifies price areas where the market shows a strong ability to absorb buy or sell orders. This suggests the presence of significant liquidity that is slowing or temporarily halting price movement. While absorption does not always lead to a reversal, it provides valuable information about where liquidity is concentrated and how the market may react at those levels.
What is Absorption?
Imagine that at a given price level there are numerous sell orders. If several large buy orders are executed and the price still remains unchanged at that level, this could indicate absorption — sellers are absorbing the buying pressure without allowing price to rise.

Think of it like a sponge. The sell side is soaking up all the buying pressure coming in, preventing price from moving higher. The more buying that gets absorbed without price moving, the stronger the presence of sellers at that level.
It is important to note that absorption does not always lock price in place. In some cases, after initial absorption, price may continue in its original direction. By combining the Absorption indicator with DOM and Time & Sales analysis, you can better understand the participation of traders and their potential influence on price at those levels.
DeepDom's Absorption indicator highlights these situations directly on the chart, making them easy to spot in real time.
How to Set Up the Absorption Indicator
Right-click on the chart and select Indicators.
Search for the desired indicator and add it to your workspace by clicking the "+" button.
Open the indicator's settings panel, customize the parameters according to your preferences, and confirm the changes by clicking Save.

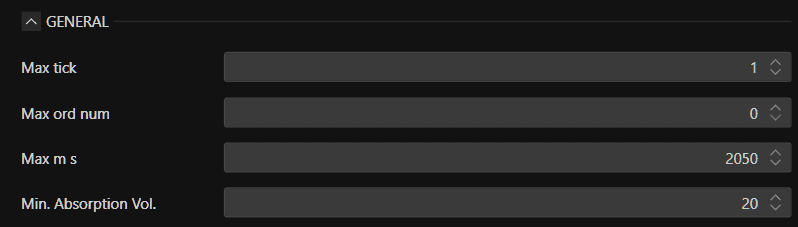
General Settings
1. Max Tick Sets the maximum number of ticks for which an absorption area is considered valid. If price moves beyond this number of ticks, the area will no longer be treated as an active absorption zone.
In simple terms — if price moves too far away from where the absorption was detected, the event is no longer considered relevant and the indicator stops marking it.
Examples -
Max Tick - 1
Max Tick - 15
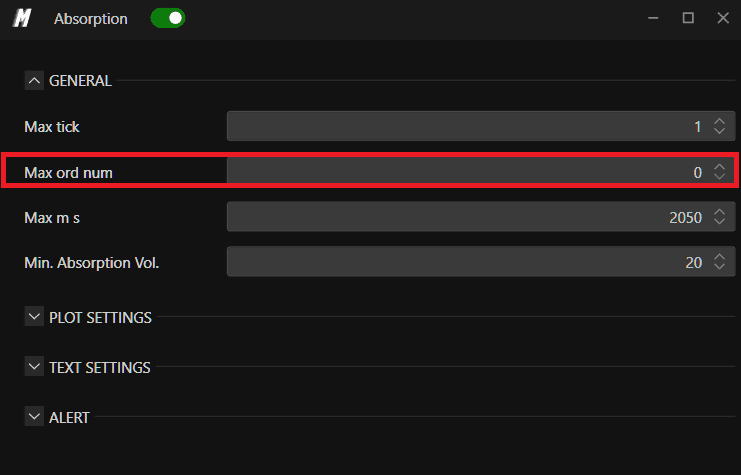
2. Max Orders Number Sets the maximum number of orders used in the absorption calculation. This determines the weight of the trader or traders involved in the market response at that level.
This helps you focus on absorption events that involve a realistic number of orders — filtering out situations where an abnormally high number of small orders might trigger a false reading.
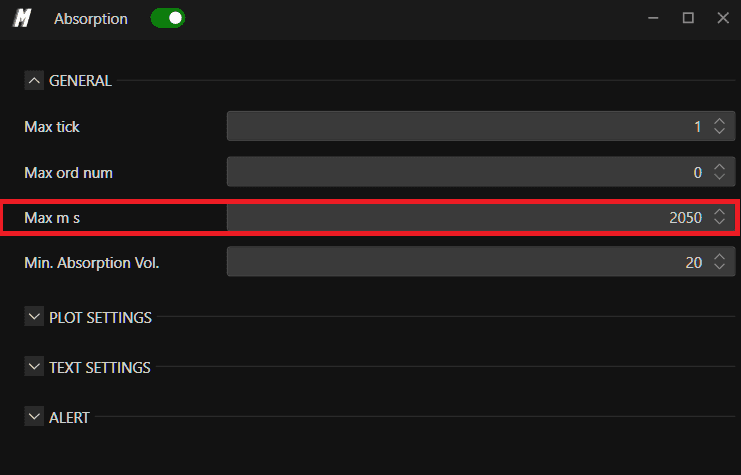
3. Max MS Sets the maximum duration in milliseconds for an absorption event to be detected. The faster the absorption occurs in the market, the more likely it represents a significant response at that price level.
In simple terms — if the absorption happens very quickly, it is more likely to be a deliberate, meaningful action by a large participant rather than random market noise.
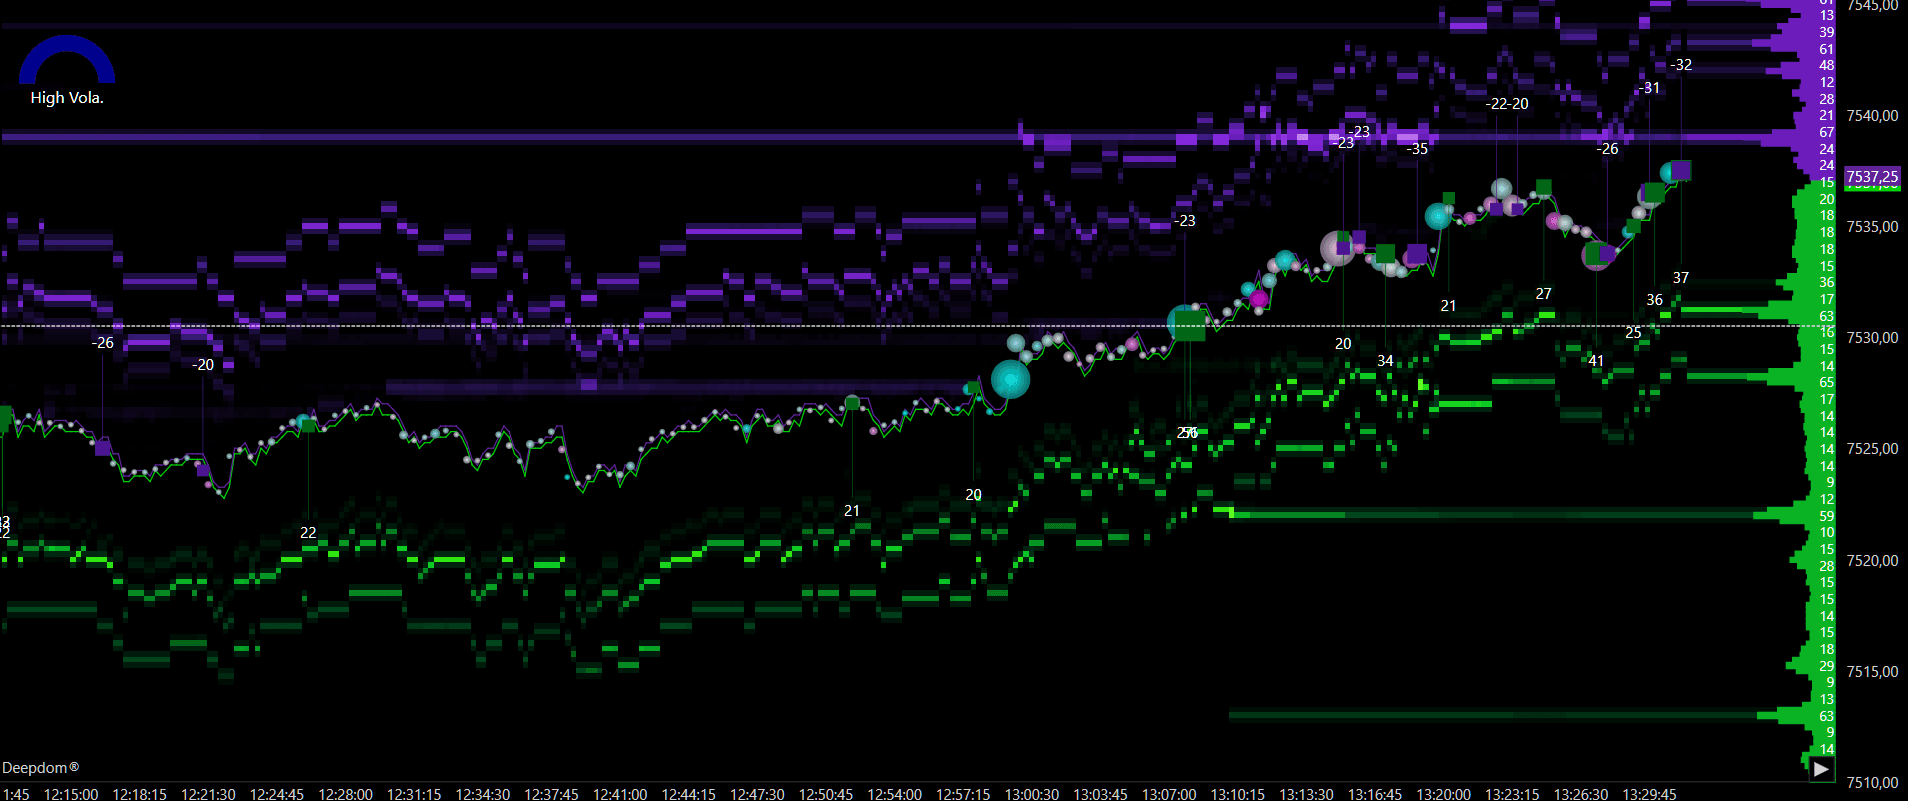
Examples -
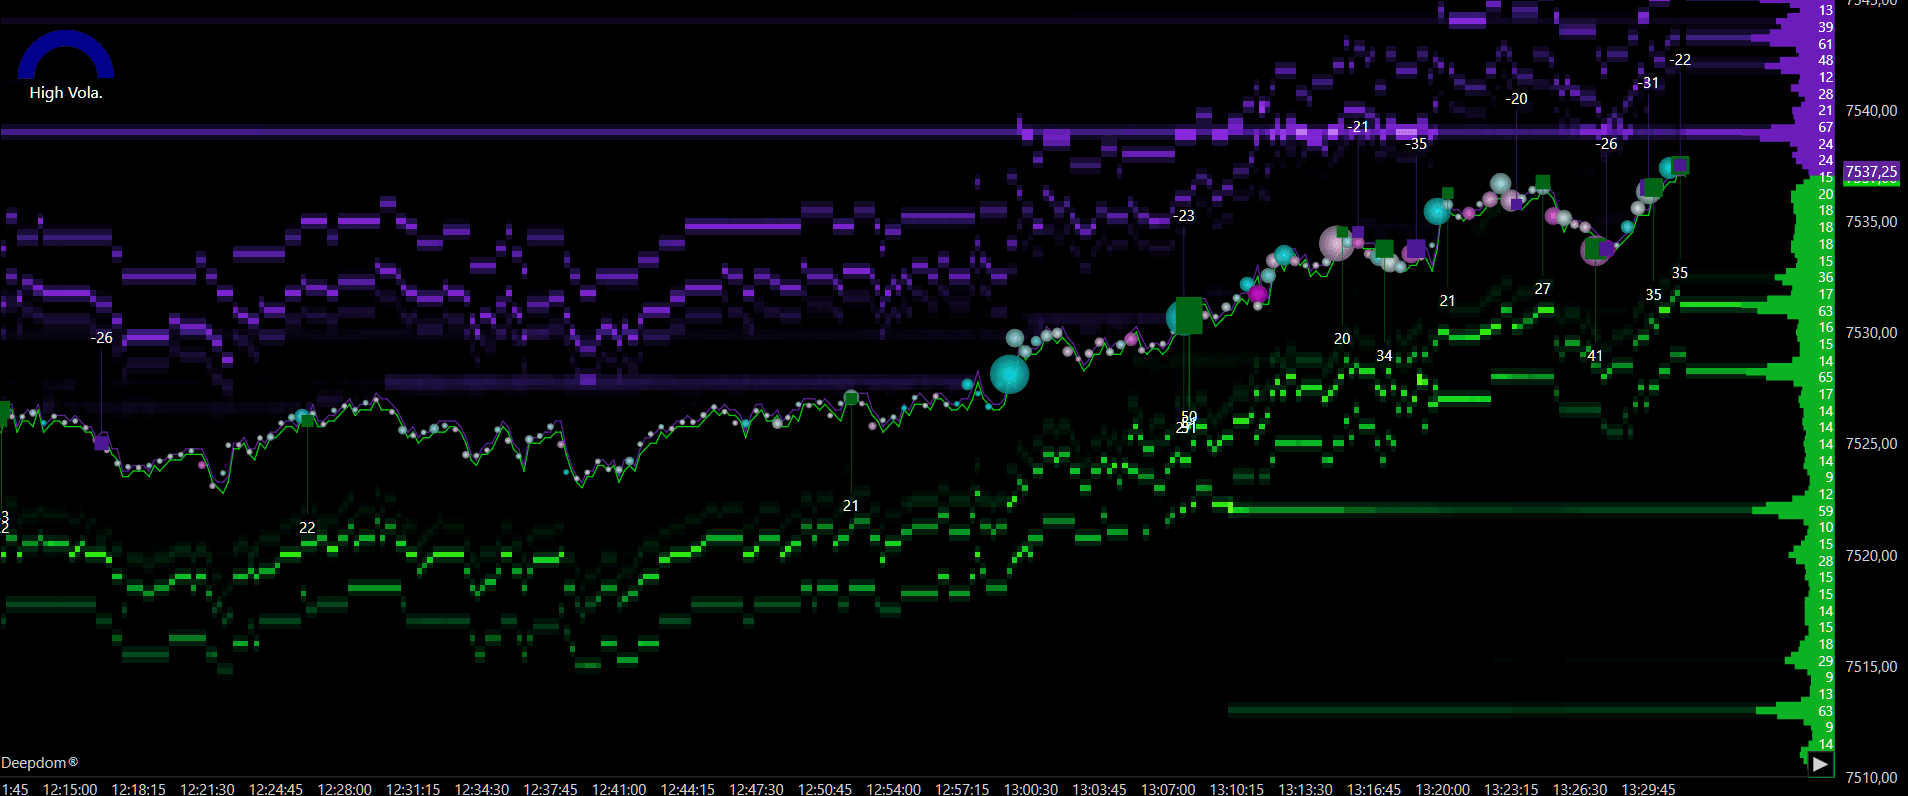
Max MS - 2050

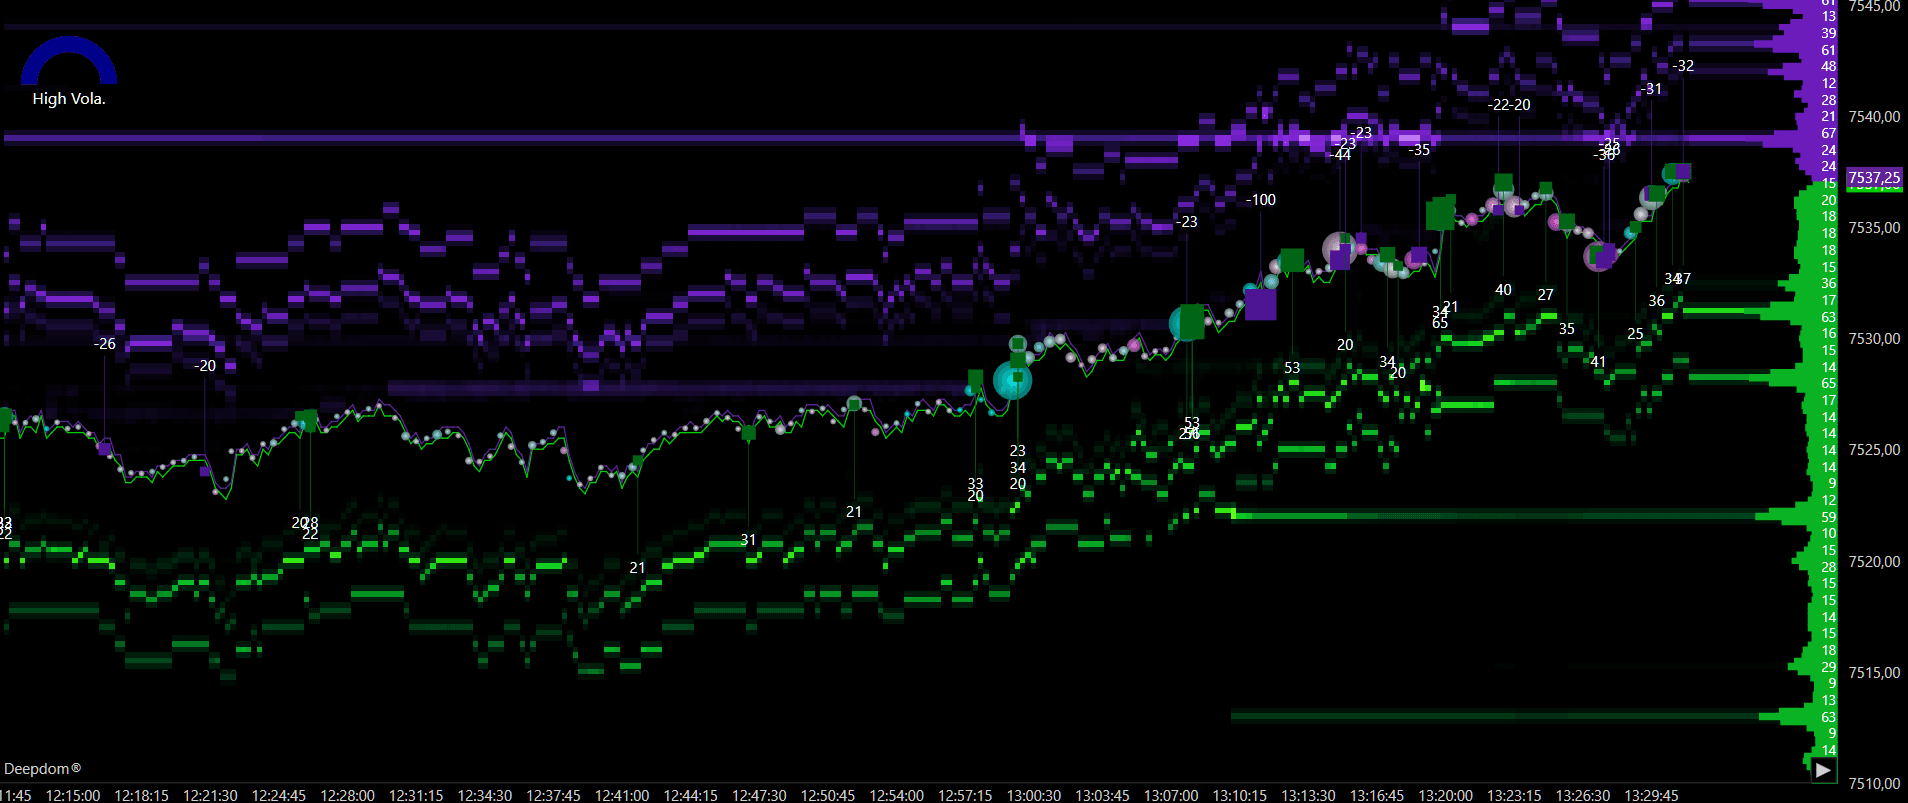
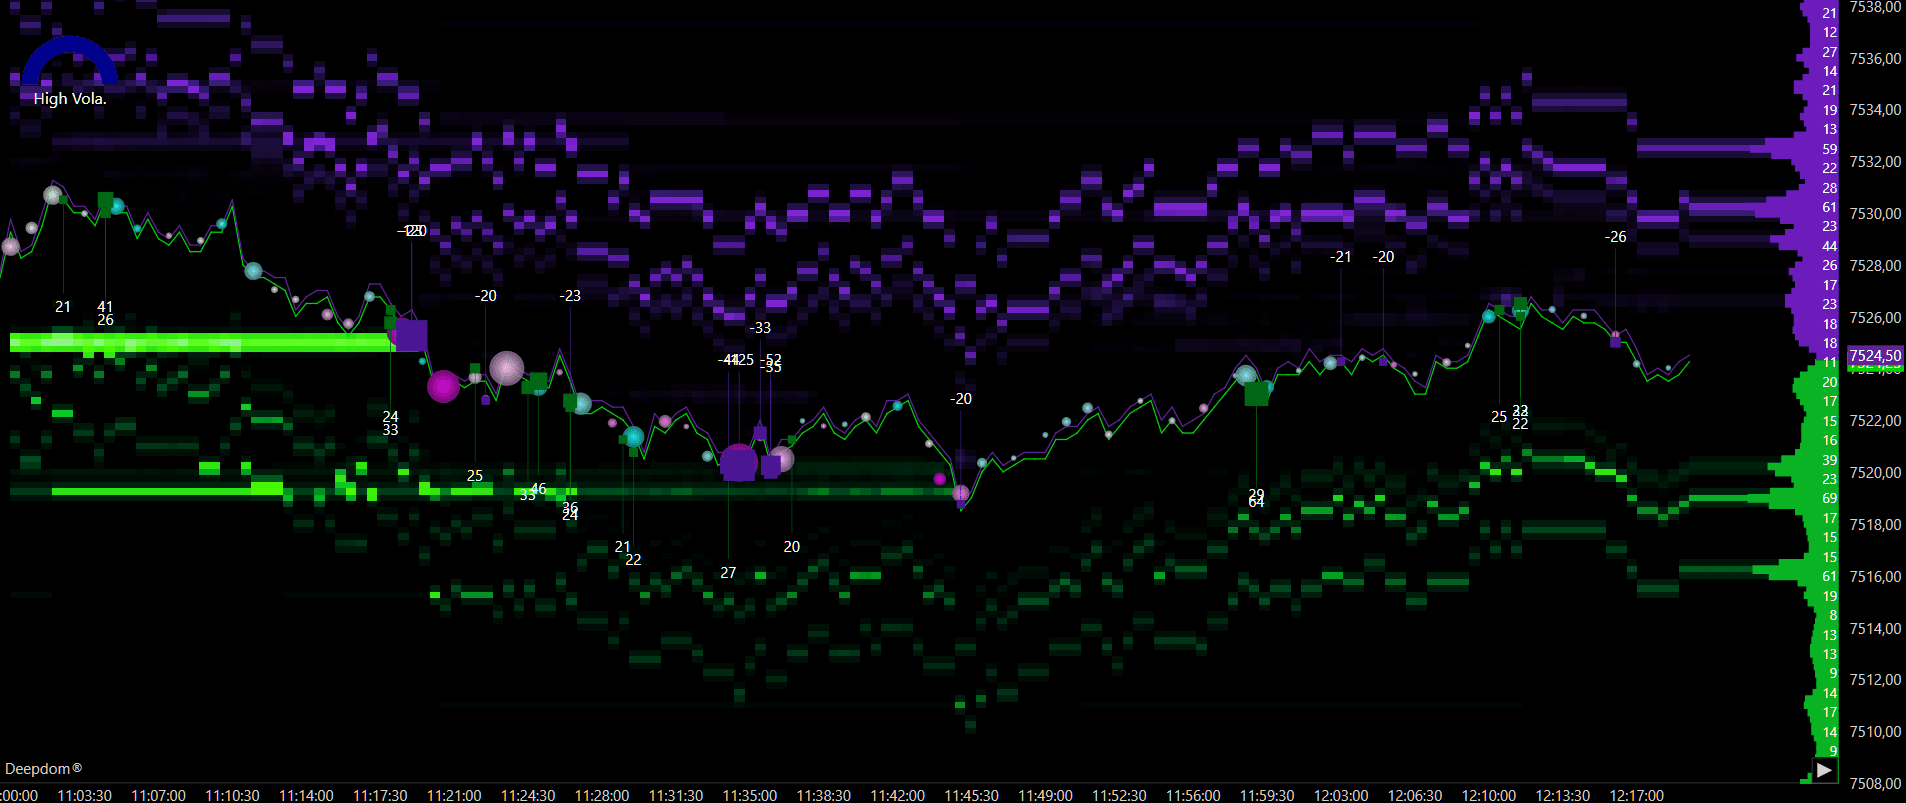
Max MS - 10
As you can see, some of the orders have been filtered out when we added a filter of Max MS - 10
4. Min. Absorption Vol. Sets the minimum volume required for an area to qualify as absorbed. This filters out minor absorptions and focuses only on those that meet a meaningful volume threshold. Setting a lower value can also be useful for high-frequency scalpers looking for small absorption signals based on just a few ticks of response.

Examples -
Min. Absorption Vol. - 20
Min. Absorption Vol. - 50
As you can see, some of the orders have been filtered out when we added a filter of Min. Absorption Vol. - 50
Plot Settings
1. Display Mode Defines how absorption is represented on the chart. You can choose between Square, Diamond and Text

Text — displays absorption as a text label at the relevant price level
Diamond — displays absorption as a diamond shape marker
Square — displays absorption as a square shape marker

2. Ask Color Sets the color used to highlight absorption on the Ask side — where buying pressure is being absorbed by sellers.

3. Bid Color Sets the color used to highlight absorption on the Bid side — where selling pressure is being absorbed by buyers.

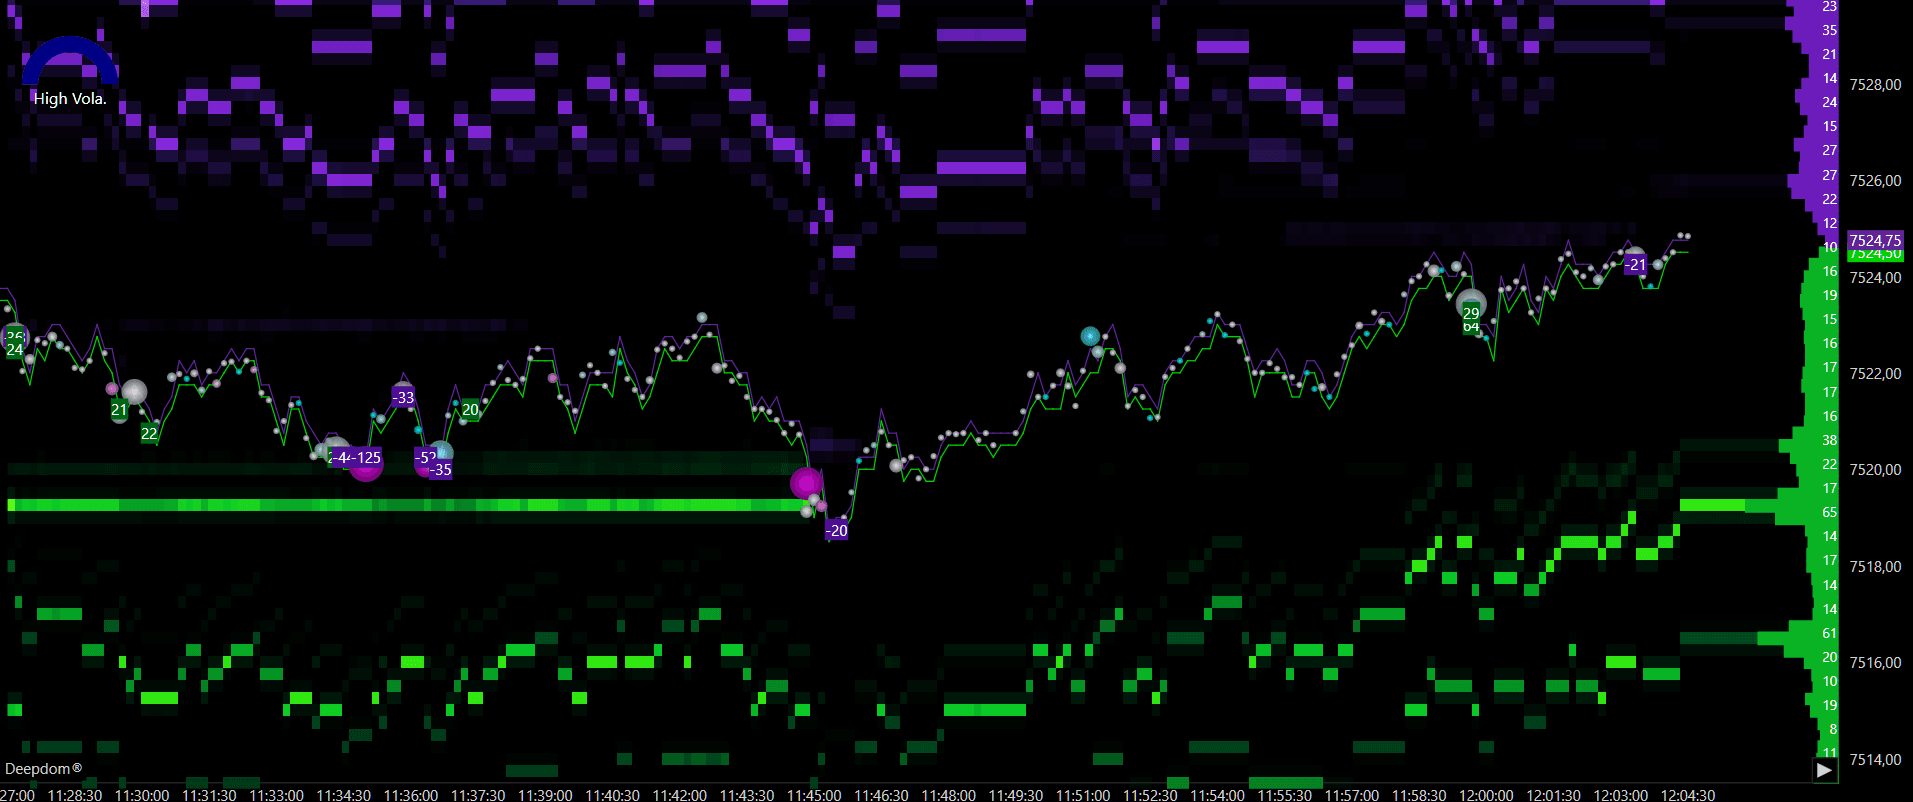
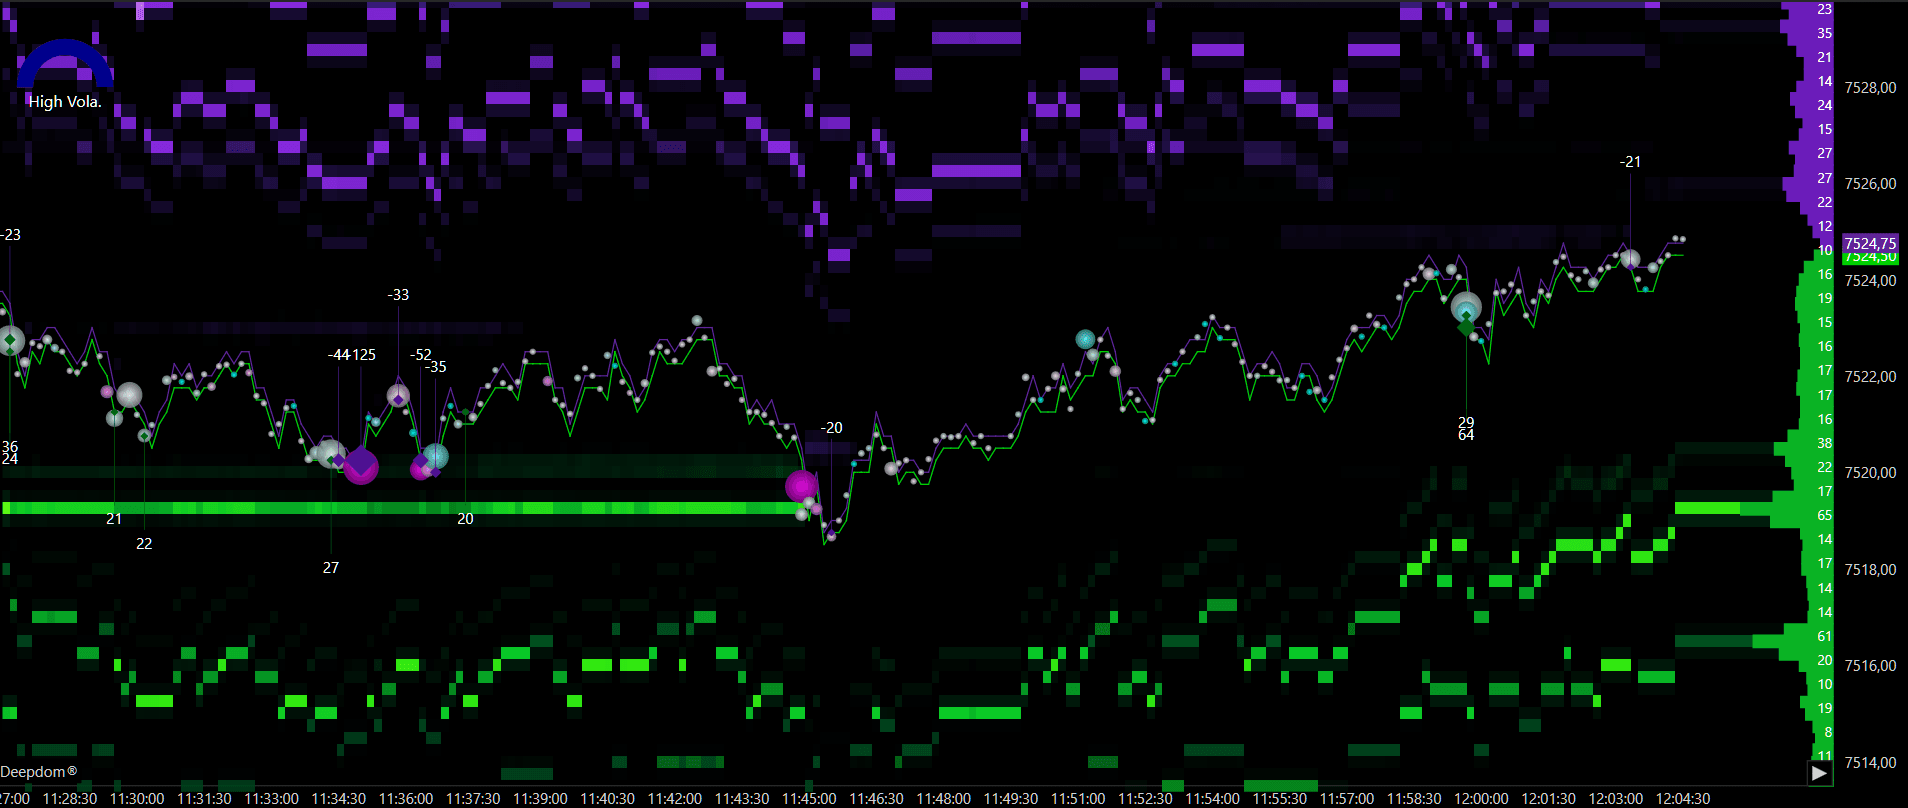
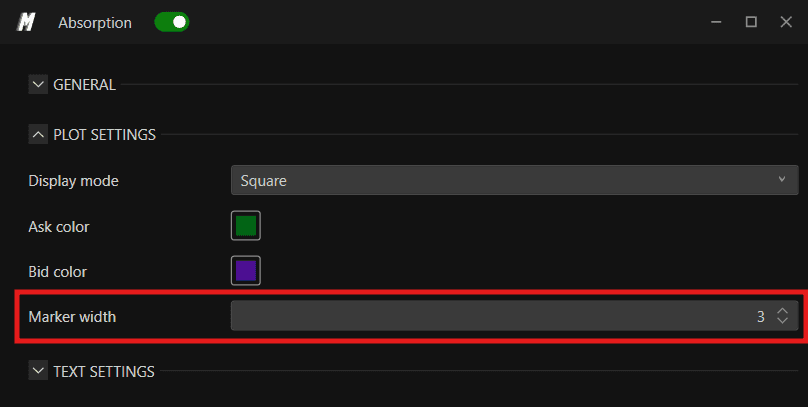
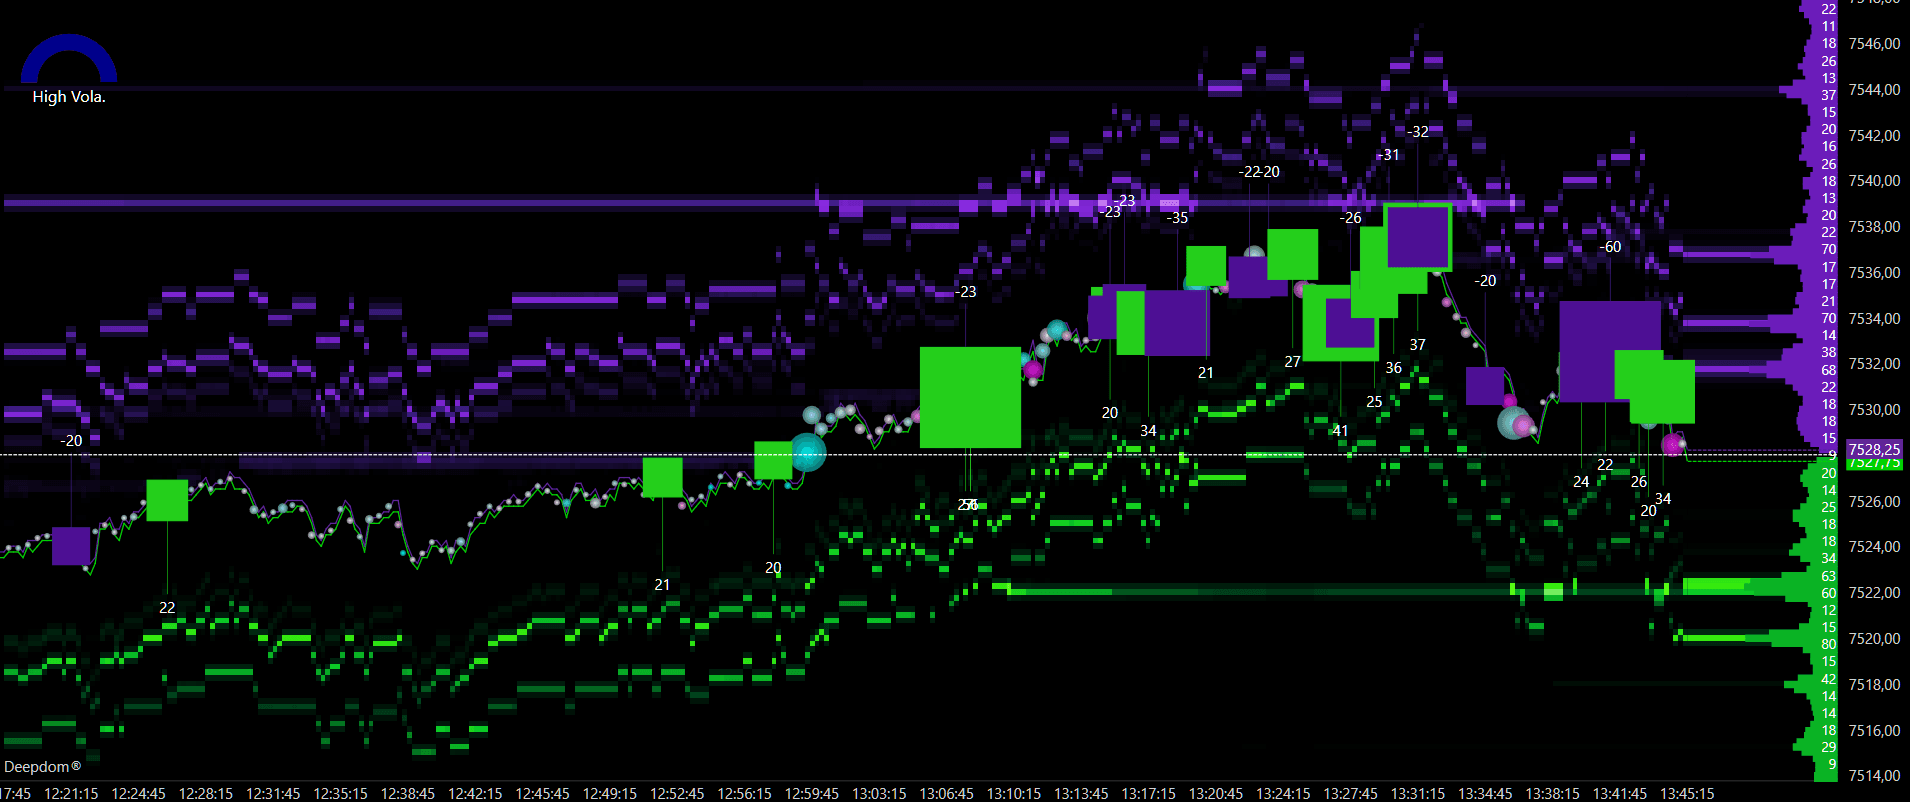
4. Marker Width increases the size of the marker which displays the absorption, it works only when the Display Mode is set to Square or Diamond
Examples -
Marker Width - 3

Marker Width - 10
As you can see, when the value of Marker Width is set to 10, the size of the square is increased
Text Settings

1. Enable Text Enables or disables the text label associated with each absorption event on the chart.
2. Text Color Sets the color of the displayed text.
3. Text Size Adjusts the size of the text label for readability.
Plot Settings
You have also the possibility to set alerts for Absorption signals

Conclusion
The Absorption indicator is a powerful tool for identifying where significant liquidity is present in the market. Used alongside DOM and Time & Sales, it gives you a more complete picture of market participation at key price levels — helping you make more informed decisions about potential entries, exits, and areas of interest.
Still Having Trouble?
Our support team is available 24/7 and ready to help you with any issue you encounter.
When reaching out, please include:
A screenshot of the issue
A brief description of what you were trying to do
Support Ticket (Fastest Response) Visit www.deepcharts.com and create a support ticket directly on our website.
Email Support Reach us at support@deepcharts.com — please note that email responses may take a little longer than a support ticket.