Indicators
Updated:
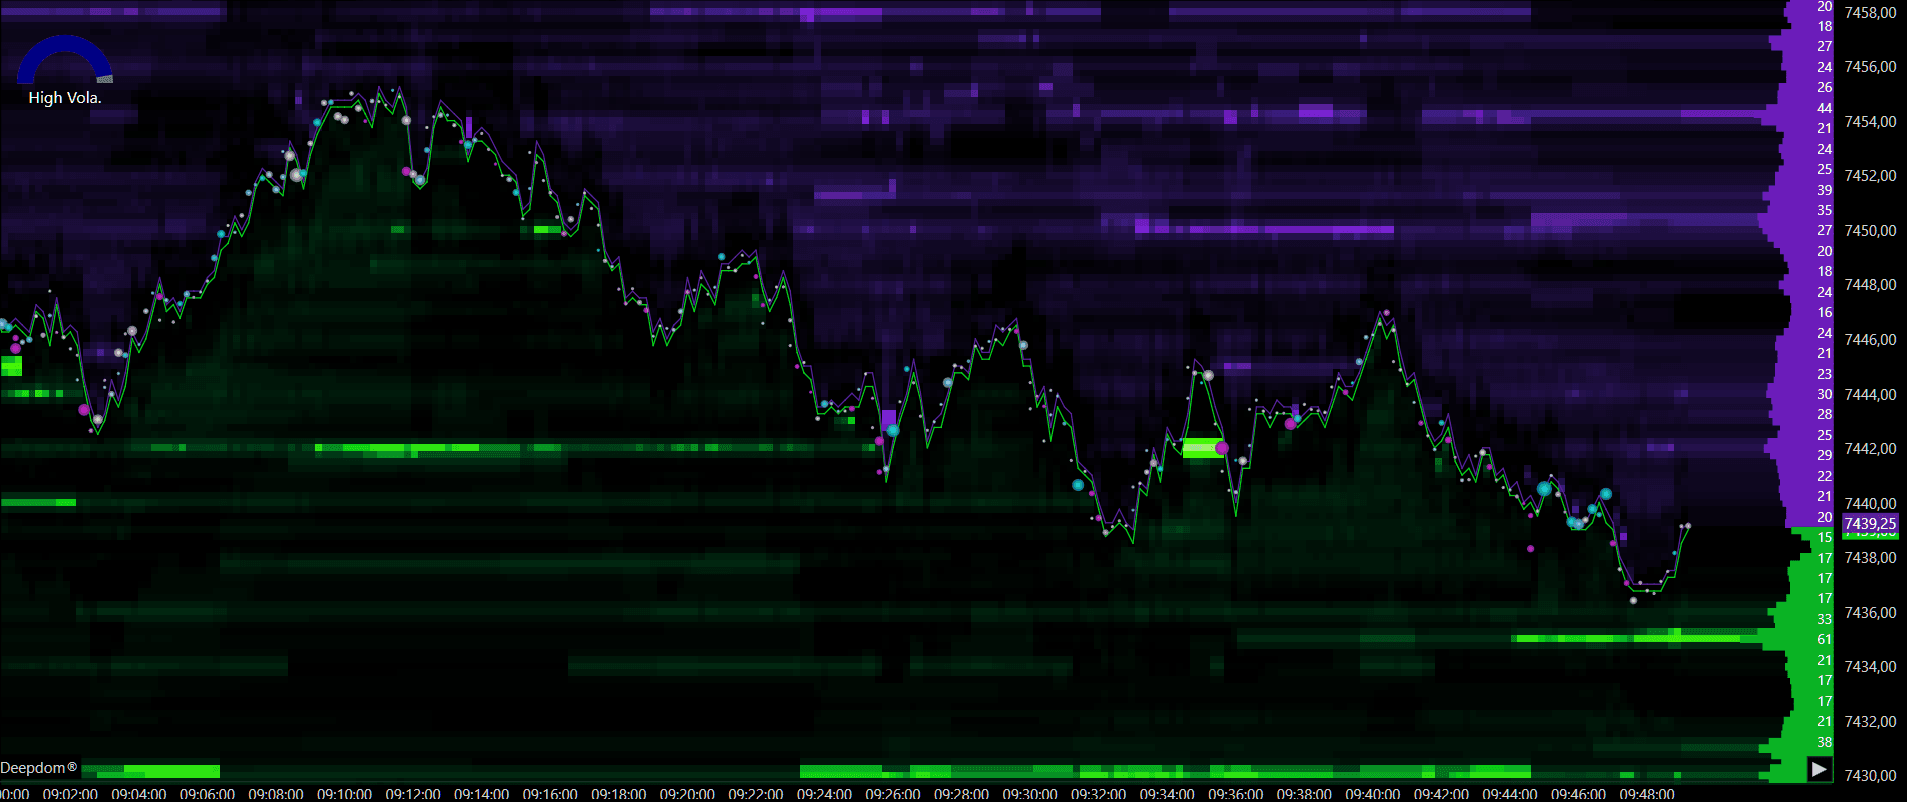
The Stop Run indicator shows you on the chart when a large number of stop orders have been triggered in the market. This helps you understand why price suddenly moved fast — and whether that move was real buying or selling, or just a wave of stop orders getting swept out all at once.

What is a Stop Run?
First, let's understand what a stop order is.
When a trader buys or sells in the market, they usually set a price level where their trade will automatically close if things go wrong. This is called a stop order. For example, a trader buys NQ at 26,800 and sets a stop at 26,750 — meaning if price drops to 26,750, the trade closes automatically to avoid a bigger loss.
Now here is the important part. Most traders place their stop orders at the same obvious price levels — just below a support level or just above a resistance level. This means hundreds or thousands of stop orders are all sitting at the same price at the same time.
Large players in the market — like big banks and institutions — know exactly where these stop orders are sitting. They push price into those areas on purpose. The moment price hits that level, all those stop orders trigger at the same time — creating a huge rush of orders that pushes price even further in that direction. That is a Stop Run.
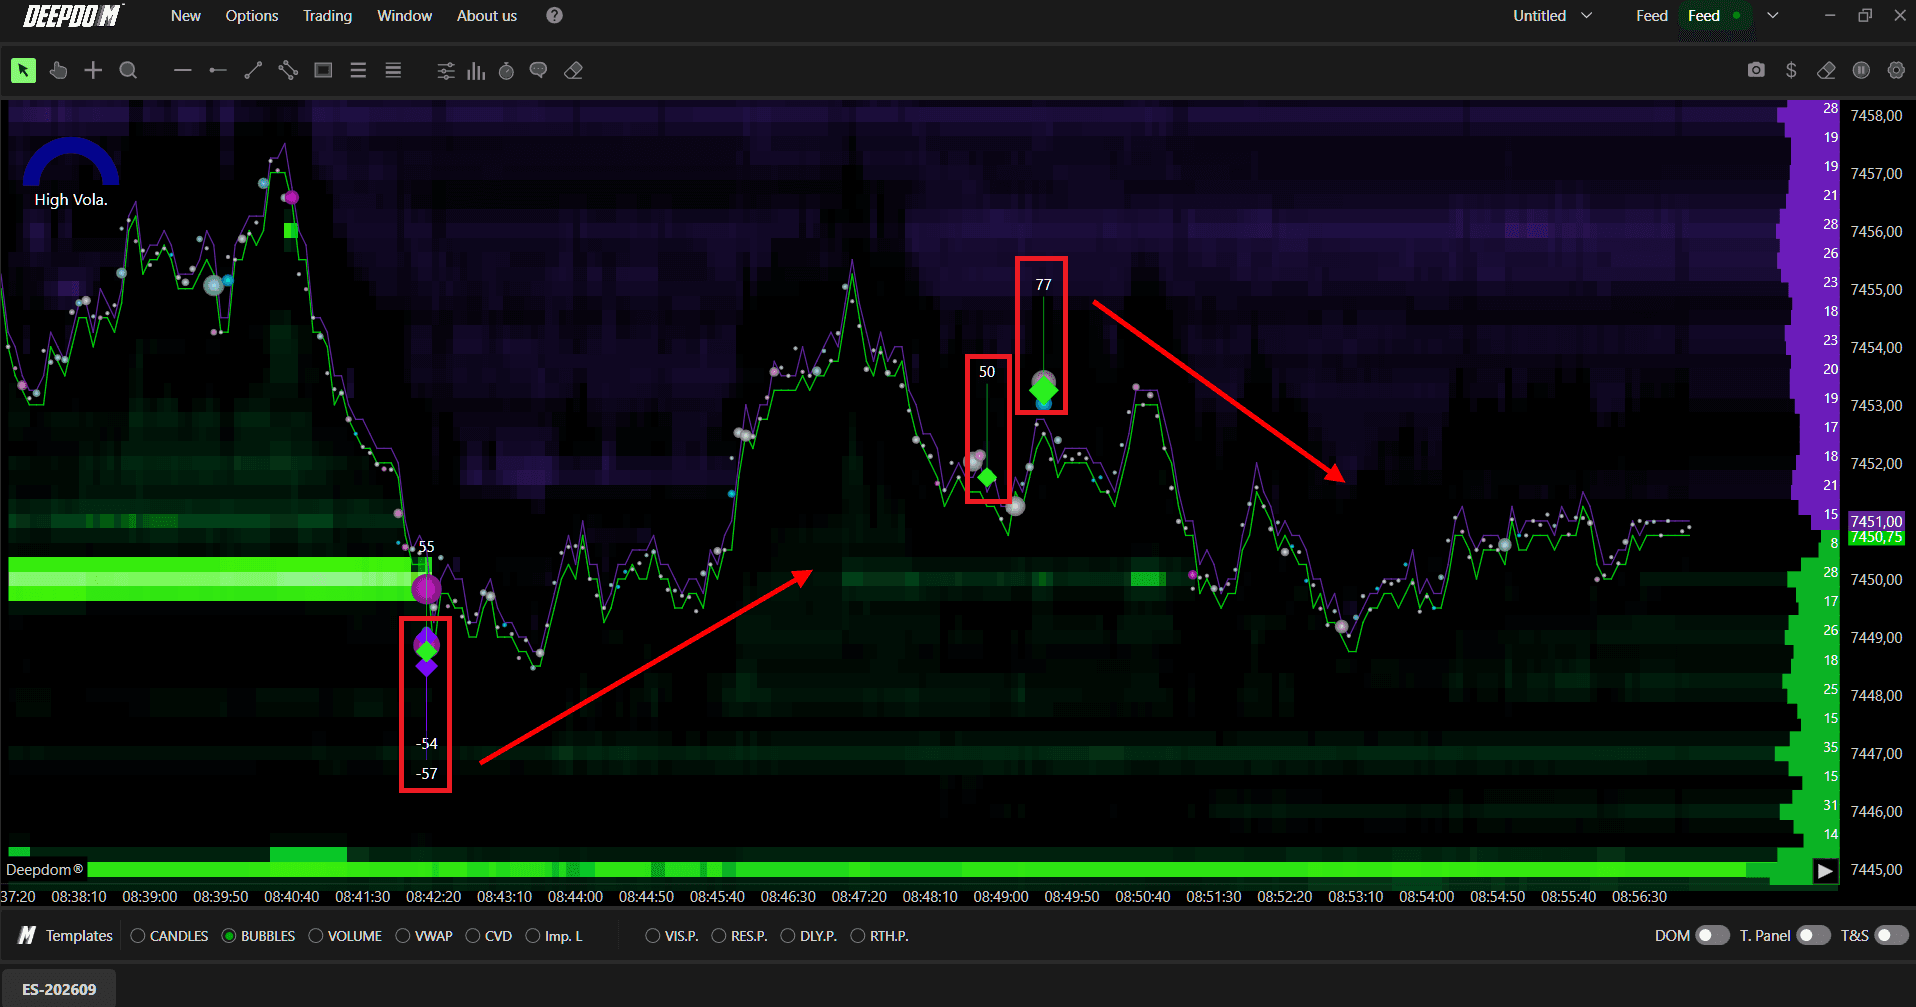
After the Stop Run is done and all the stops are triggered, price very often reverses back in the opposite direction — because the move was not driven by real buyers or sellers, it was just stop orders getting triggered.
When Does a Stop Run Occur?
Stop Runs happen most often at price levels that are very obvious on the chart — like the previous day's high or low, or a level where price has bounced multiple times before. These are the spots where most traders place their stops, which makes them the perfect target for large players.
For example — if NQ has been holding support at 26,700 for several days, most traders who are long will have their stop orders placed just below 26,700. A large player pushing price just below that level will trigger all of those stops at once, creating a fast move lower — before price often recovers back above the level shortly after.
Stop Runs also happen a lot during big news events like CPI reports or Federal Reserve announcements. During these moments there are fewer orders in the market, which makes it easier to push price through stop clusters quickly.
What to Look For During a Stop Run
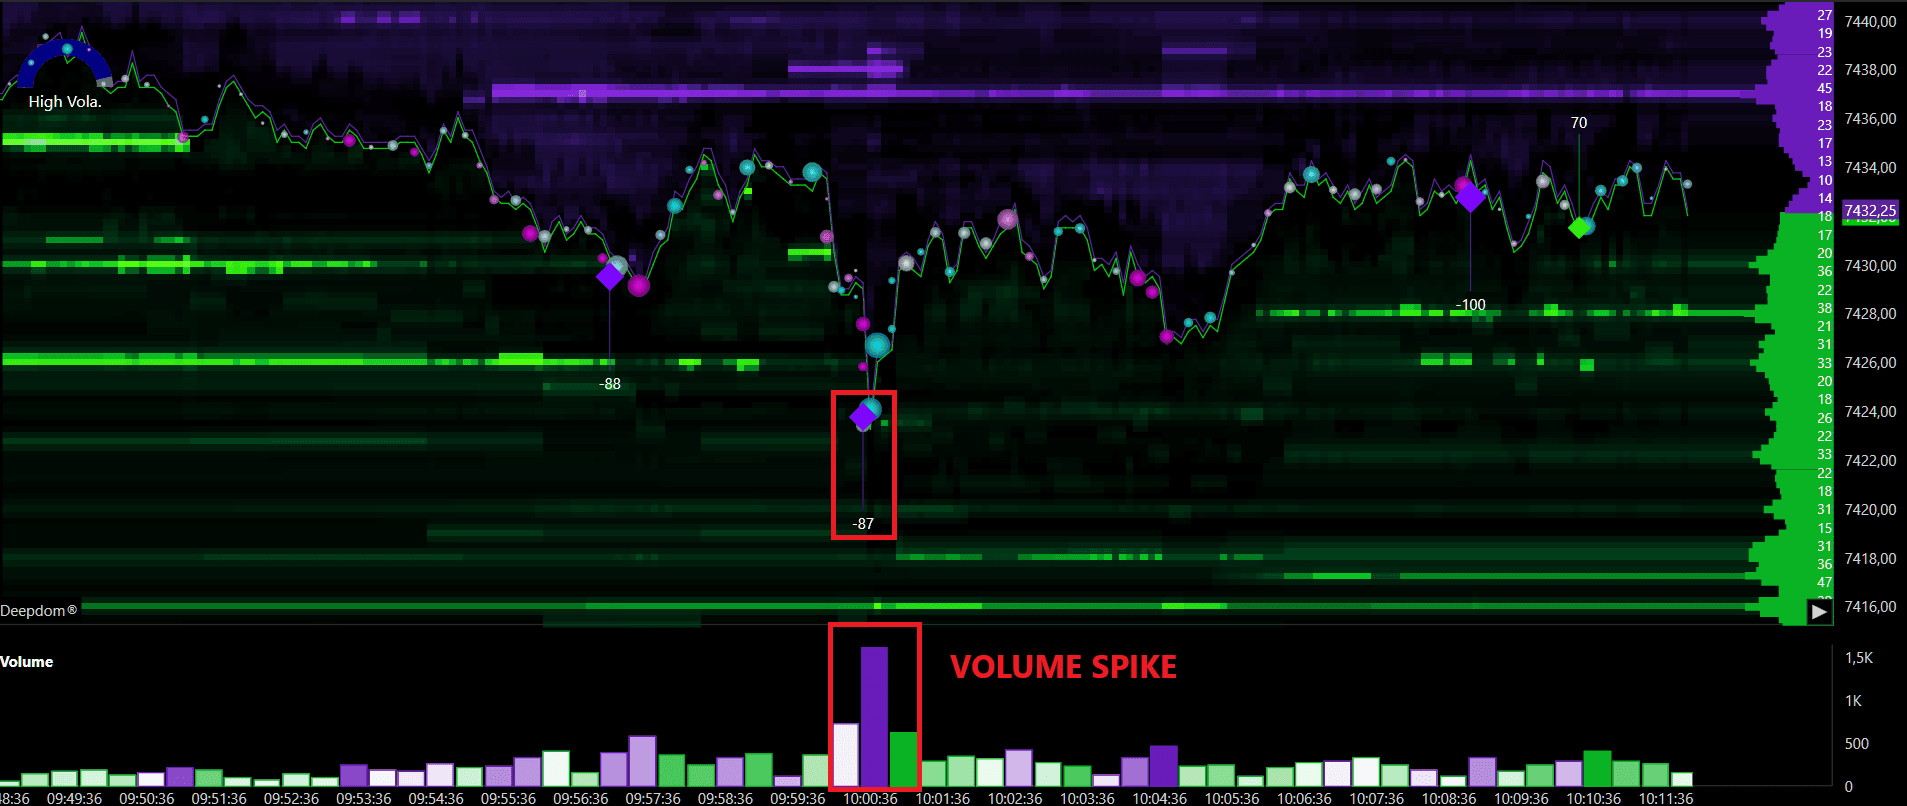
Sudden volume spike — when a lot of stop orders trigger at the same time, you will see a big jump in volume on the chart. If volume suddenly spikes much higher than normal with no obvious news reason, a Stop Run is likely what happened
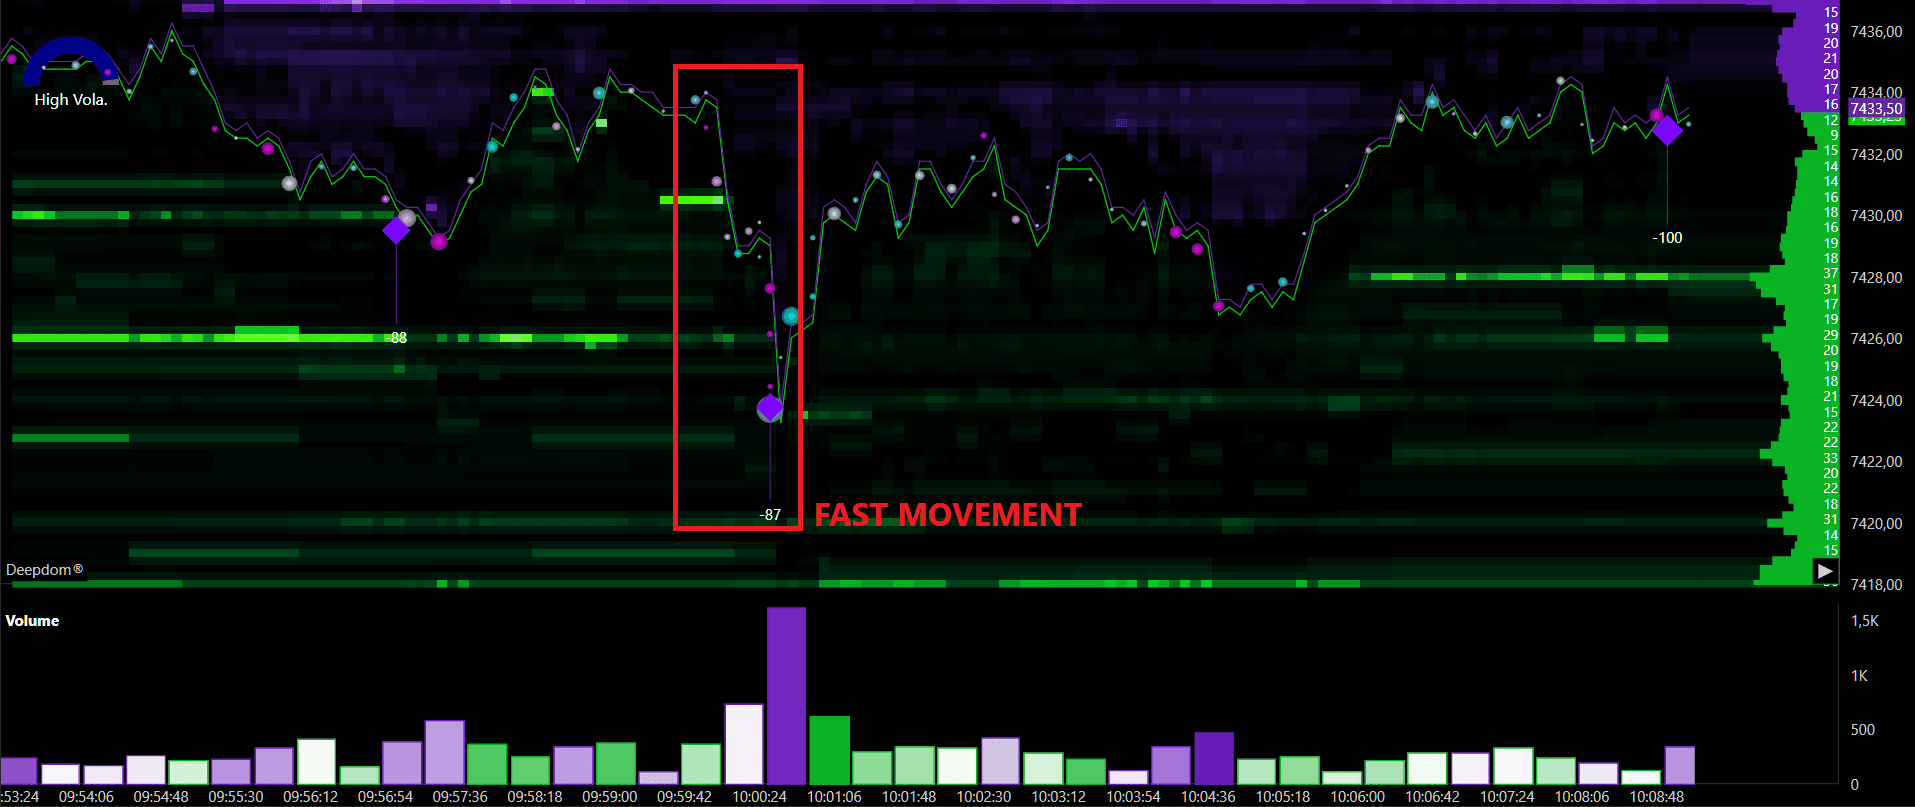
Fast price movement — price moves through a level very quickly during a Stop Run — much faster than a normal move. A trader watching the chart will notice it almost looks like price jumped rather than moved
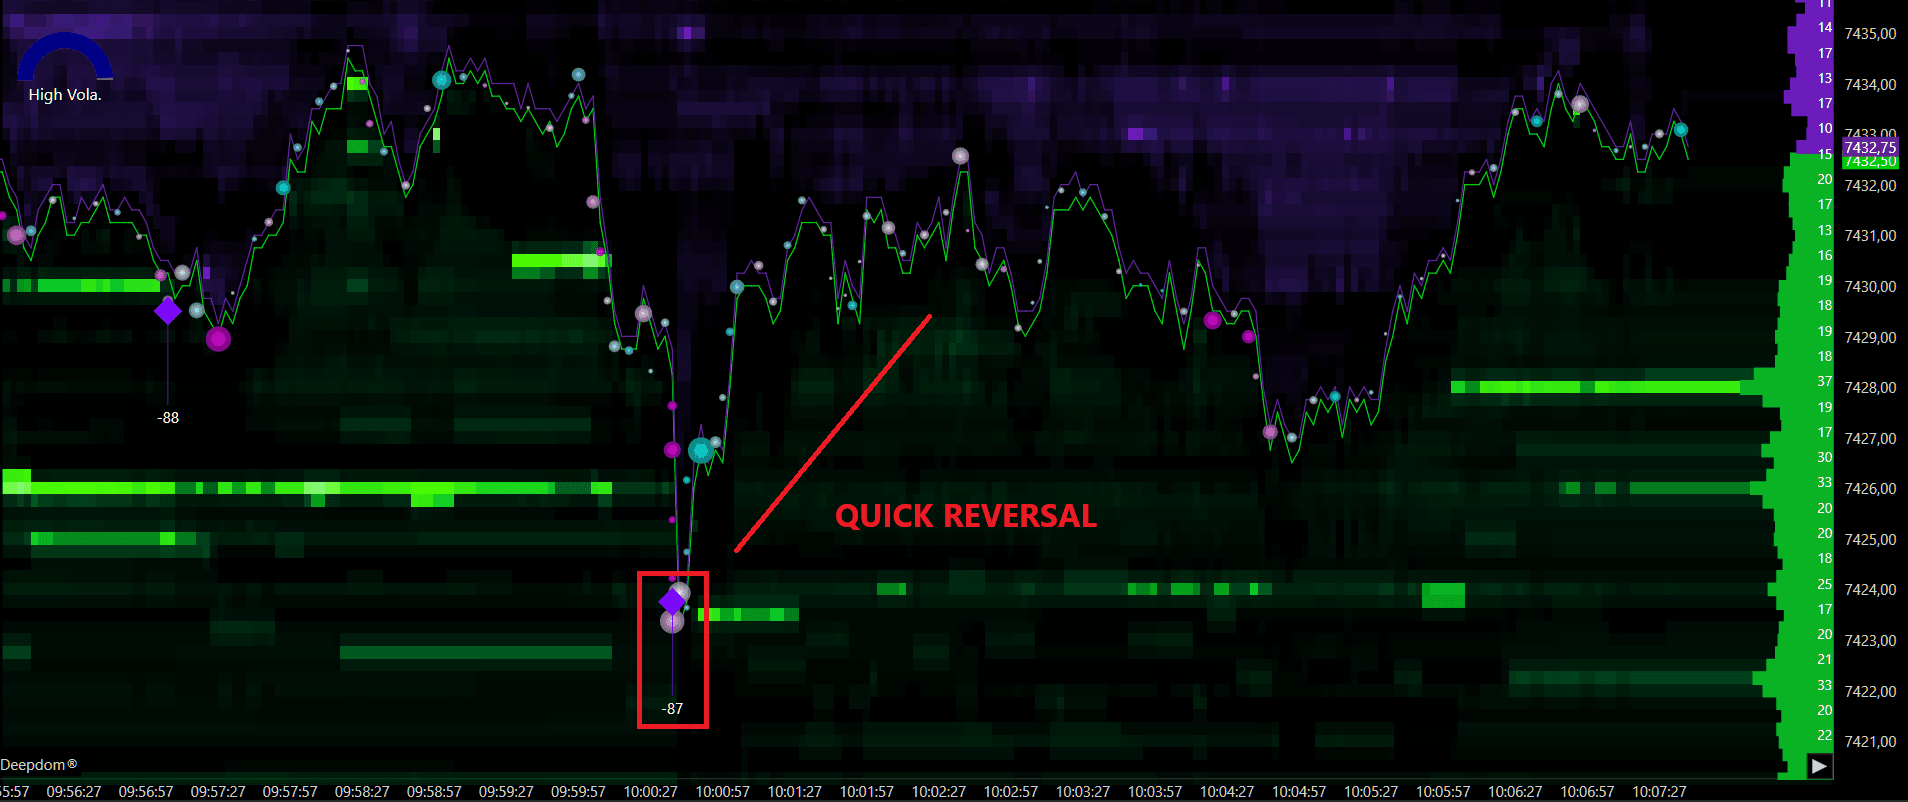
Quick reversal after the move — after a Stop Run, price very often snaps back in the opposite direction almost immediately. A trader who saw the fast move and entered in that direction will suddenly find themselves on the wrong side of the market
Order book and Footprint signals — a trader watching the DOM will notice certain price levels suddenly emptying out as the stop orders get hit. In the Footprint chart, very large aggressive orders appearing all at once in a short time are another confirmation that a Stop Run just happened
Why It Matters
Understanding Stop Runs gives you two important advantages as a trader.
The first is opportunity. Imagine a trader sees price break below support at 26,700, the Stop Run indicator shows 1,500 contracts triggered, volume spikes sharply, and then price immediately starts recovering back above 26,700. That is a strong sign the break was a Stop Run — not a real breakdown. The trader can now look to buy as price recovers, with a clear and logical level to place their stop loss below.
The second is protection. Without knowing about Stop Runs, a trader who sees a fast aggressive break of support might sell, expecting price to keep going lower — only to get stopped out seconds later when price reverses sharply back up. Recognizing a Stop Run tells you to wait and not react to the move. In trading, avoiding bad trades is just as valuable as finding good ones.
How to Set Up the Stop Run Indicator
Click the Indicators icon on the chart
Find Stop Run in the list and click + to add it
Click the settings icon on the indicator to open its configuration window
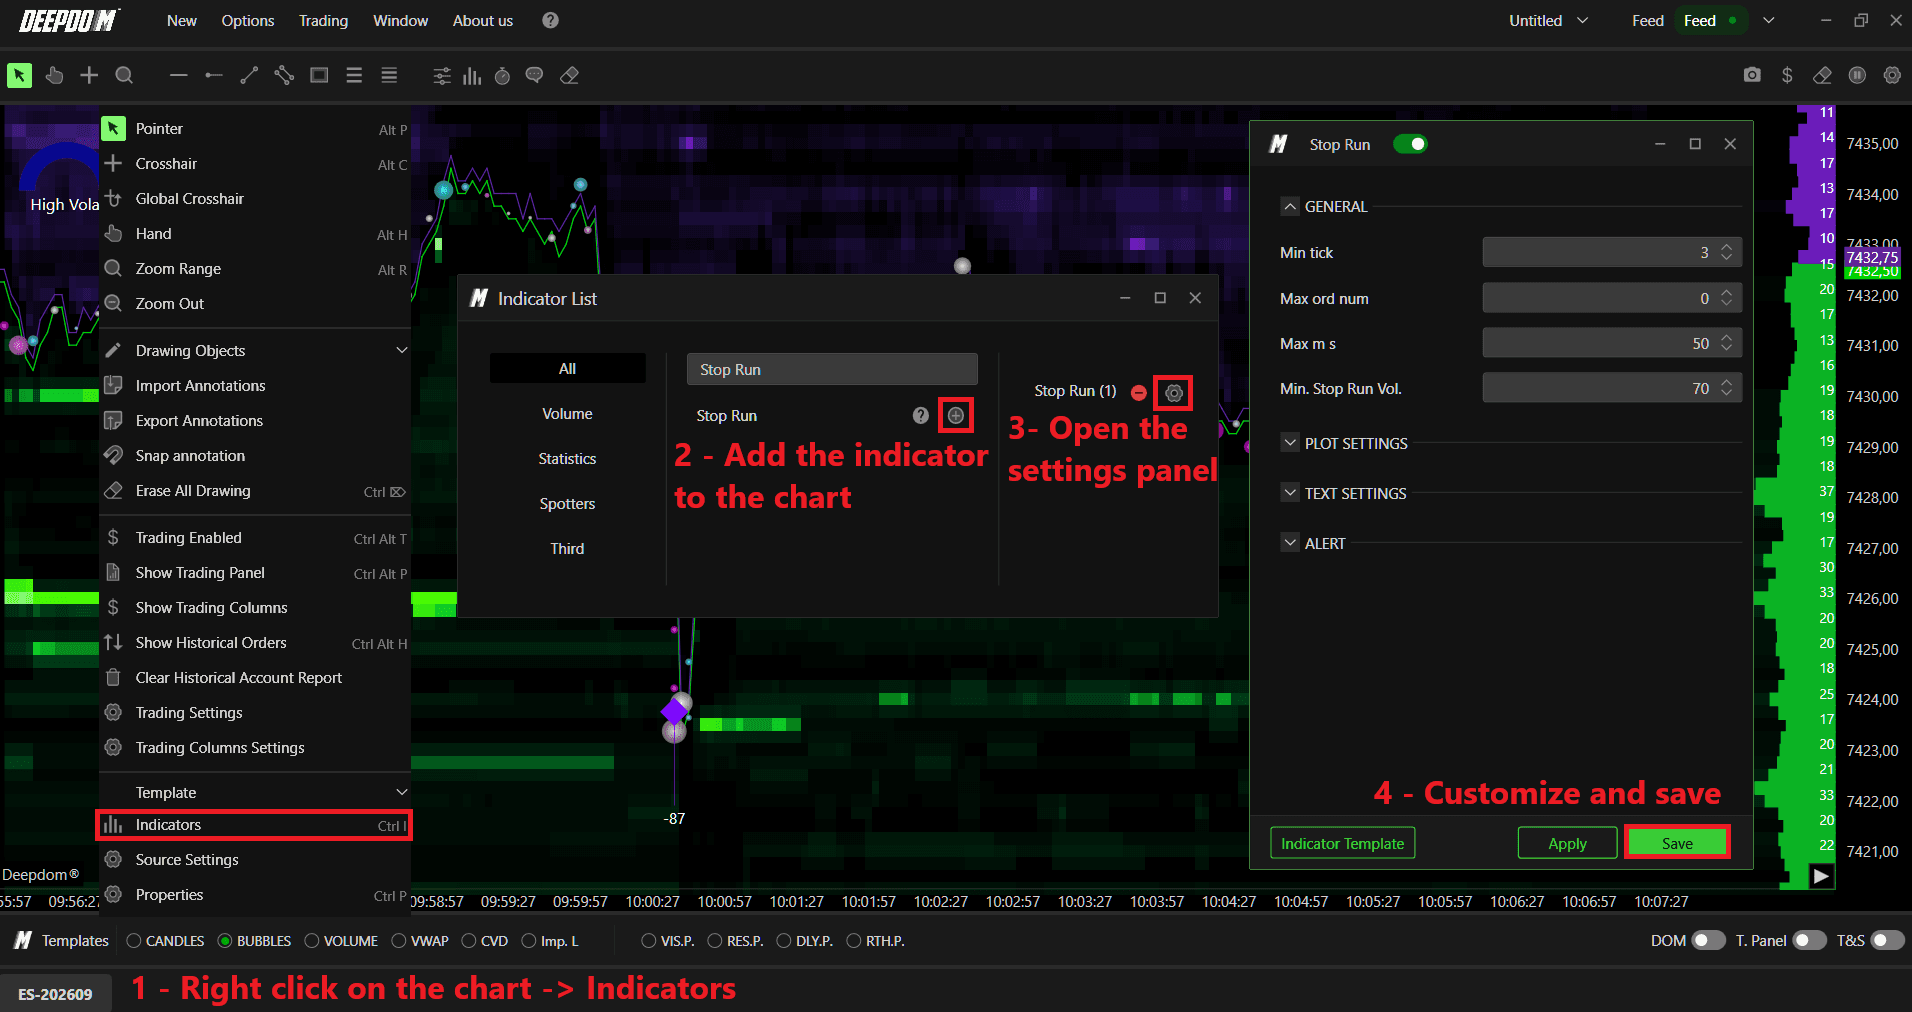
General Settings
Minimum Tick A tick is the smallest price movement possible in a market. This setting tells the indicator the minimum number of ticks price must move — as a result of stop orders triggering — before it marks the event as a Stop Run.
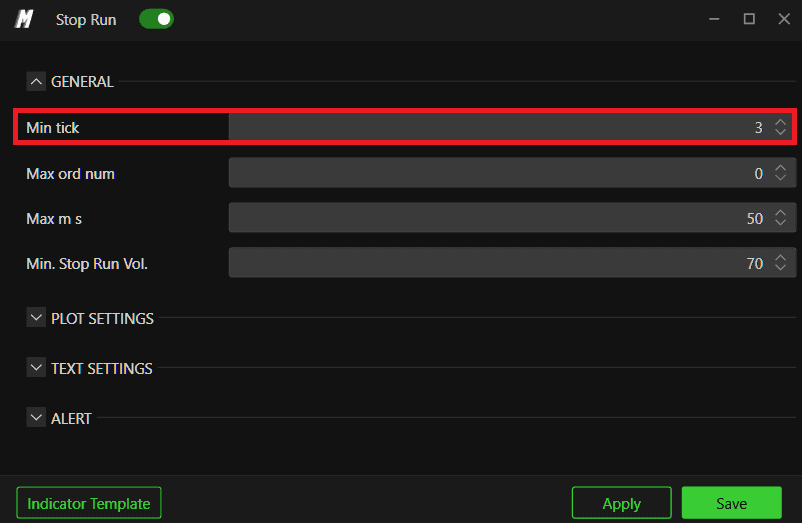
If you set this too low, the indicator will flag every small price move as a Stop Run, making the chart very noisy and hard to read. Setting it at the right level means only moves that are big enough to actually matter get flagged — keeping your chart clean and useful.
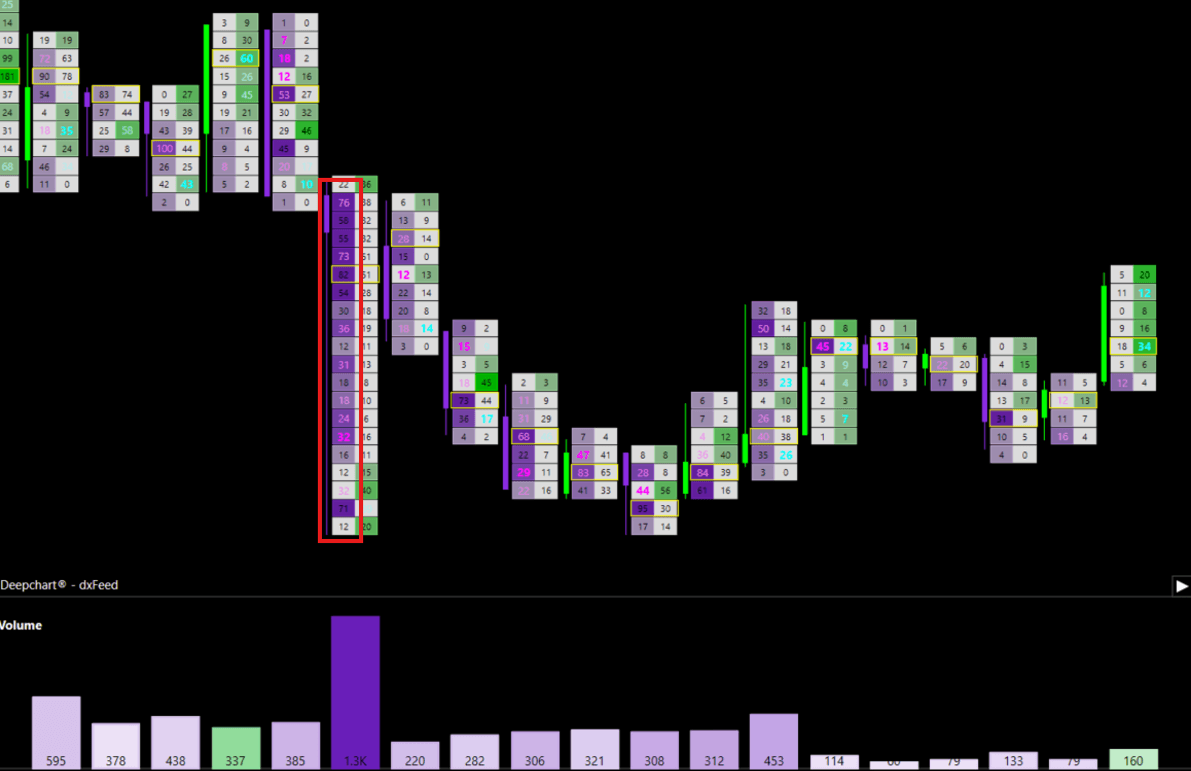
Examples -
Min Tick - 3

Min Tick - 10
As you can see, in this case every order have been filtered out when we added a filter of Min Tick - 10
Maximum Ord Num This limits the maximum number of orders the indicator looks at during a Stop Run. During extremely busy market moments — like right after a major news release — there can be so many orders flying around that almost everything looks like a Stop Run. This setting stops the indicator from over-reacting during those unusual moments and keeps it focused on normal, realistic market conditions.
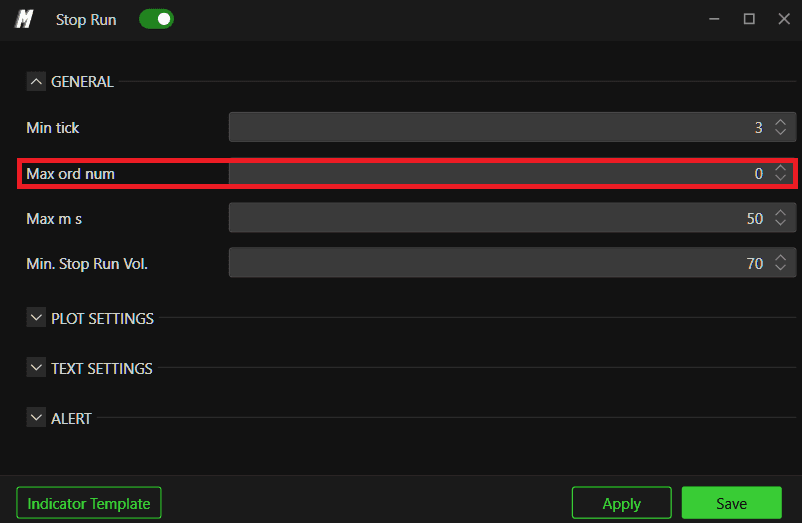
Max MS MS stands for milliseconds. One millisecond is one thousandth of a second. This setting defines how fast the stop orders need to trigger to count as one Stop Run event.

Examples -
Max MS - 50

Max MS - 5
As you can see, some of the orders have been filtered out when we added a filter of Max MS - 5
A real Stop Run happens almost instantly — all those stop orders fire within a tiny fraction of a second. If orders come in slowly over a longer period, that is just normal market activity. This setting makes sure the indicator only flags events where everything happened fast enough to be a genuine Stop Run.
Min. Stop Run Vol This sets the minimum volume needed for something to qualify as a Stop Run. A small number of stops triggering is not going to move the market in any significant way. This setting filters out those small, unimportant events and only shows you the ones that are large enough to actually impact price — the ones worth paying attention to.

Examples -
Min. Stop Run Vol. - 20

Min. Stop Run Vol. - 80
As you can see, some of the orders have been filtered out when we added a filter of Min. Stop Run Vol. - 80

Plot Settings
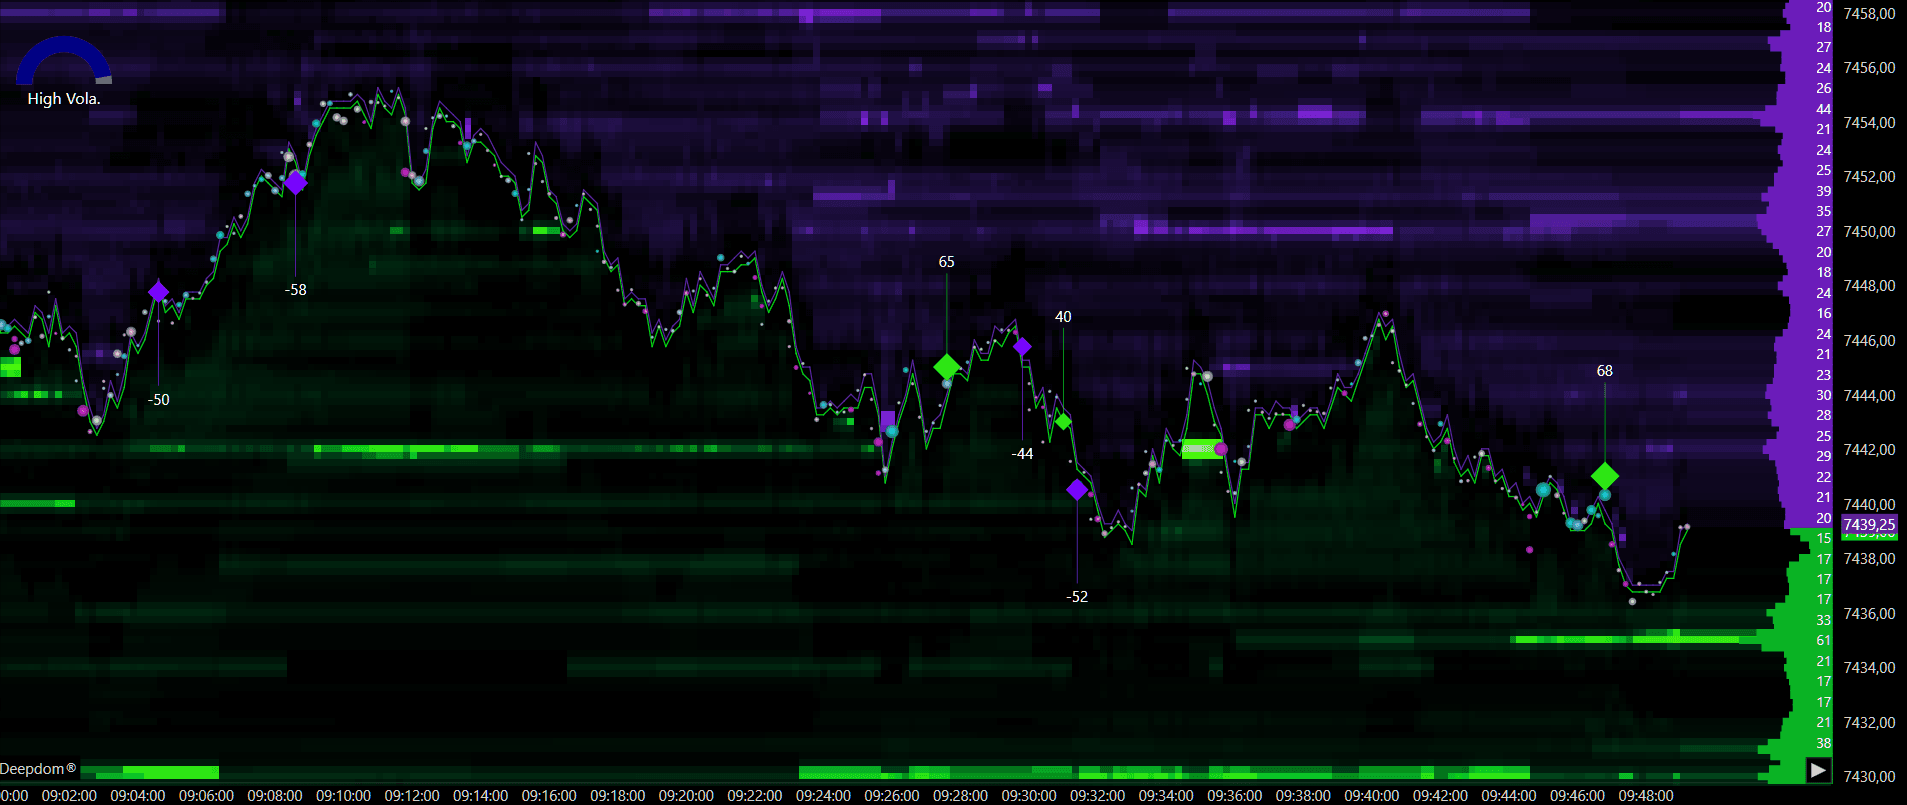
Display Mode This controls how the Stop Run marker looks on your chart. You have three options:
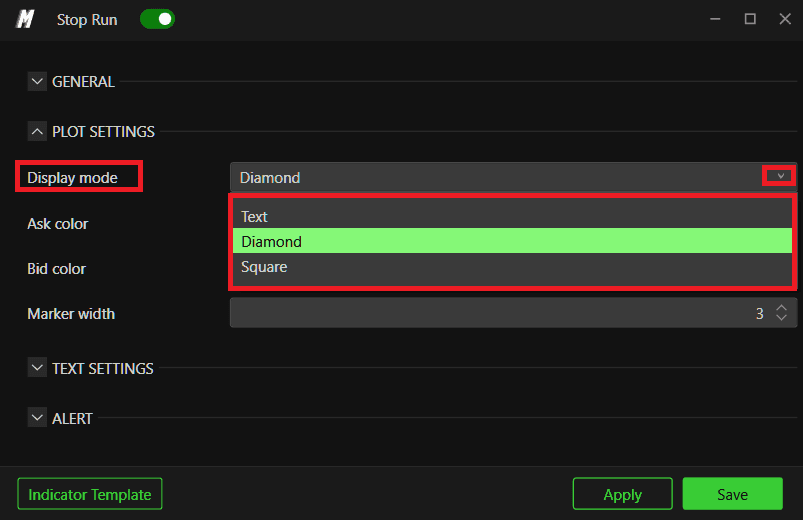
Text — displays a colored box showing the number of stop orders triggered

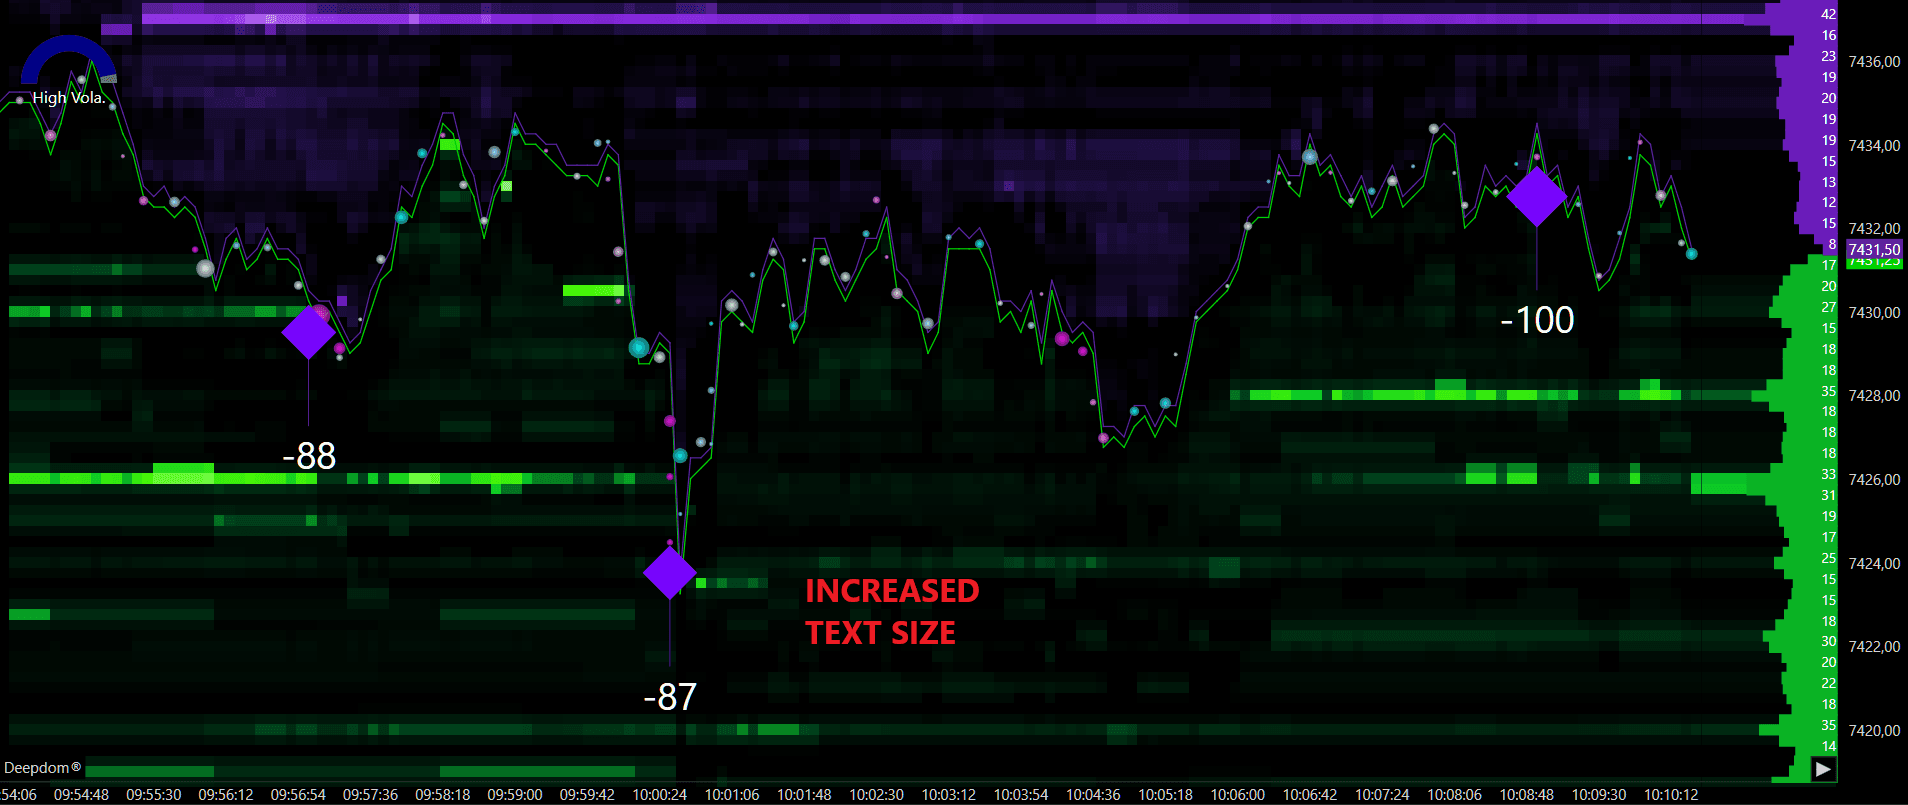
Diamond — marks the Stop Run with a diamond-shaped icon, with the number of contracts shown above or below it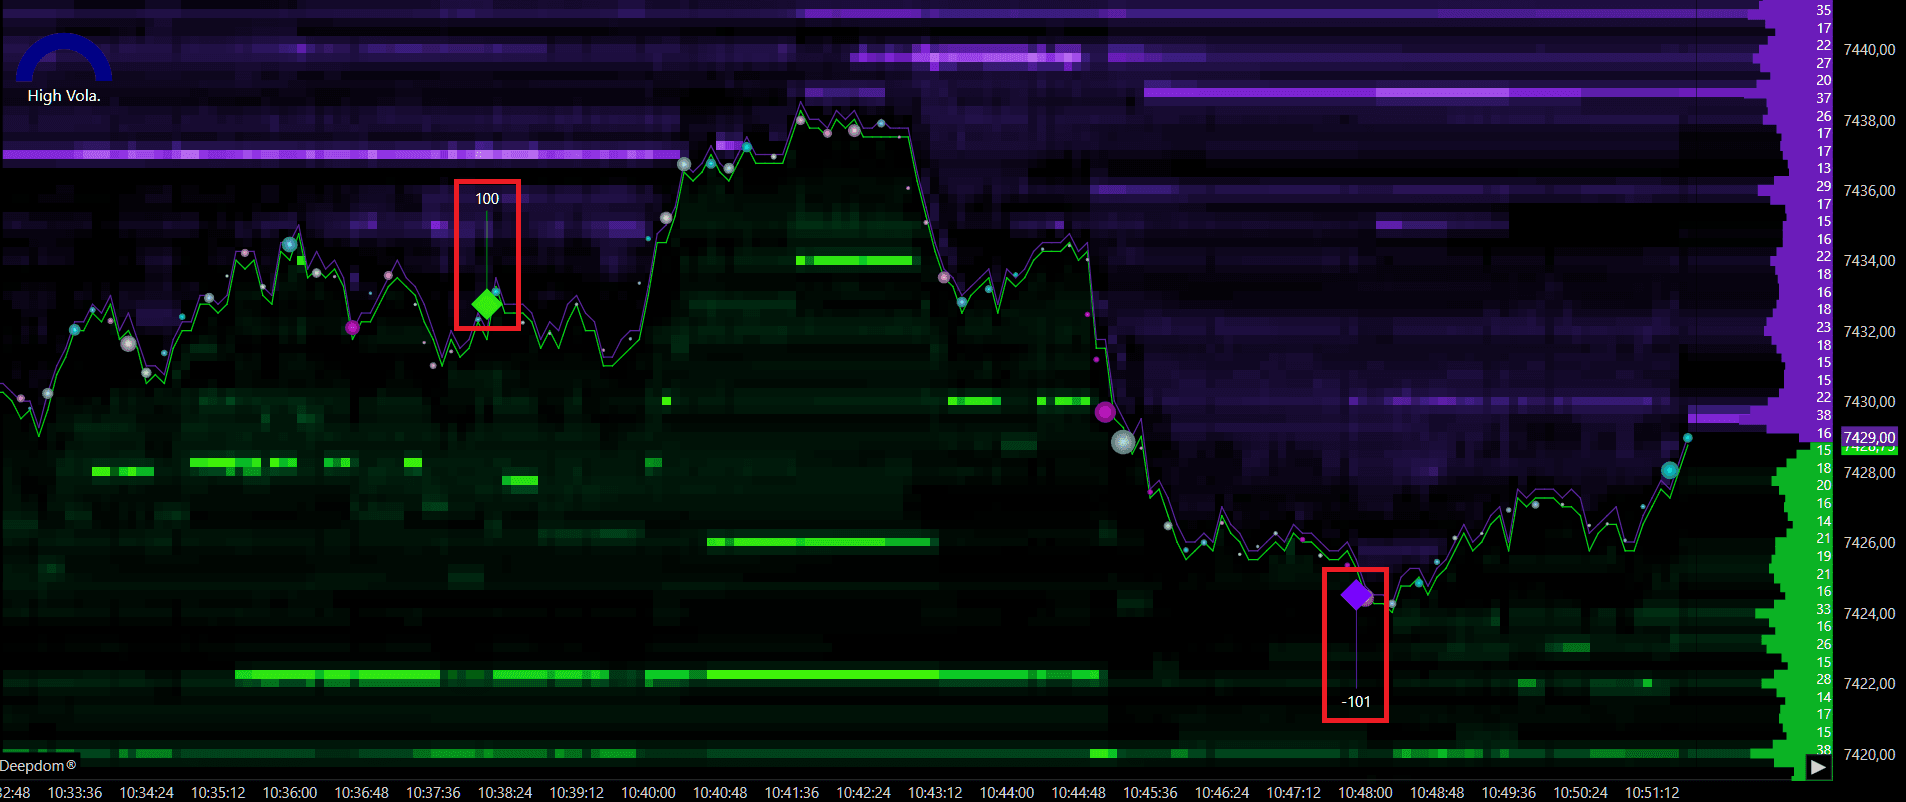
Square — marks the Stop Run with a square-shaped icon, with the number of contracts shown above or below it
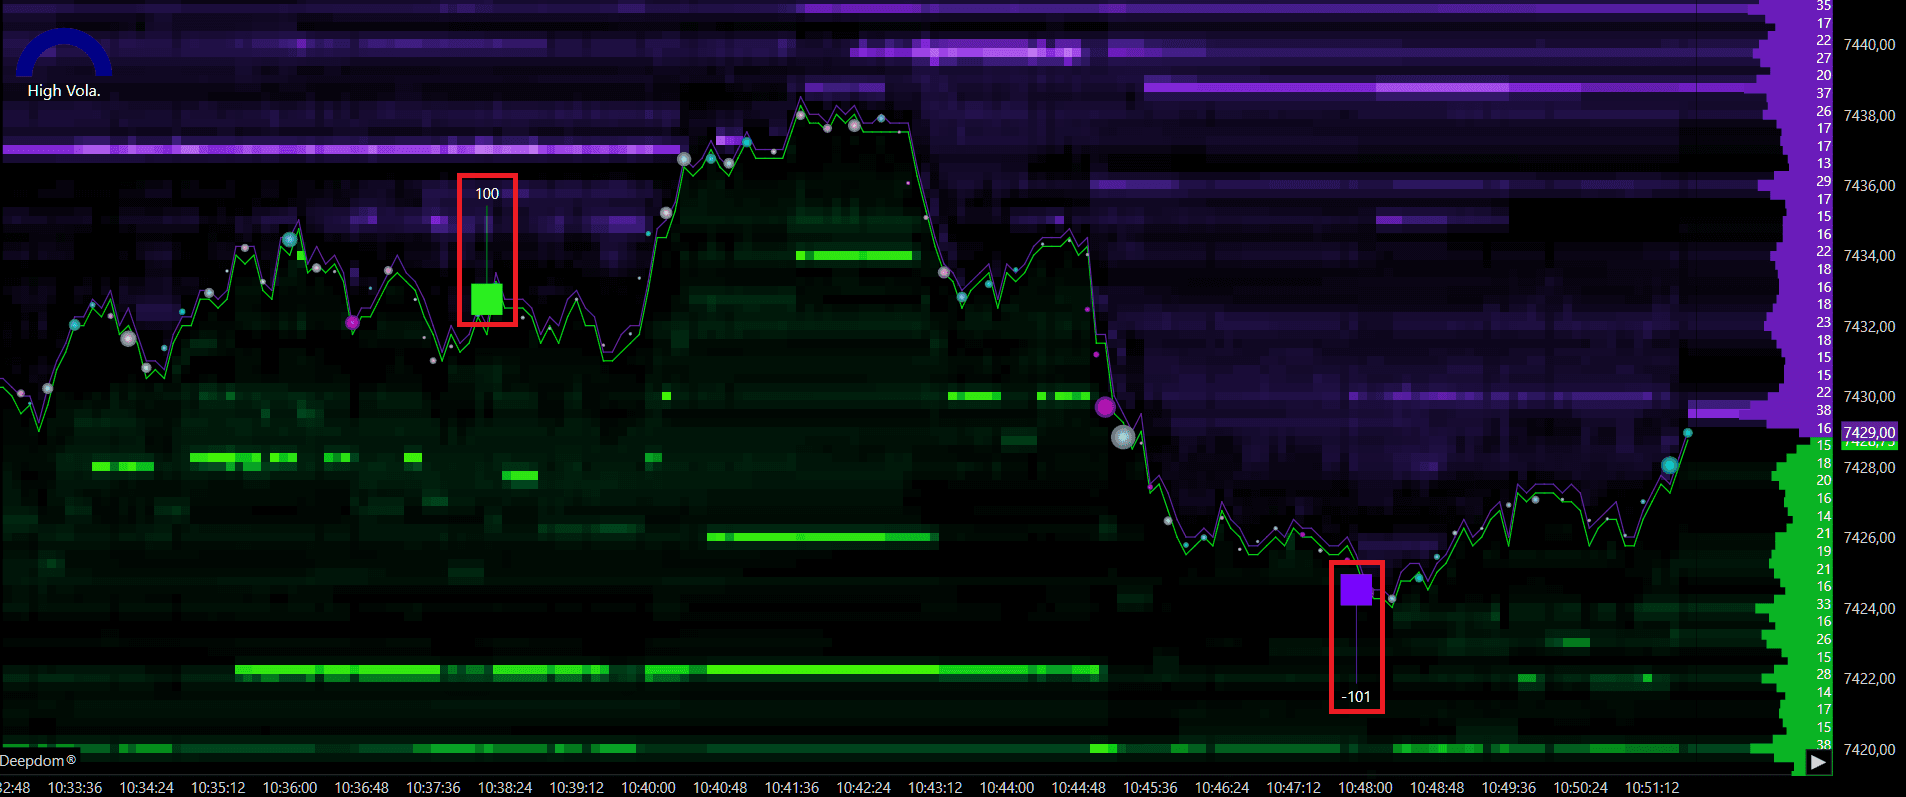
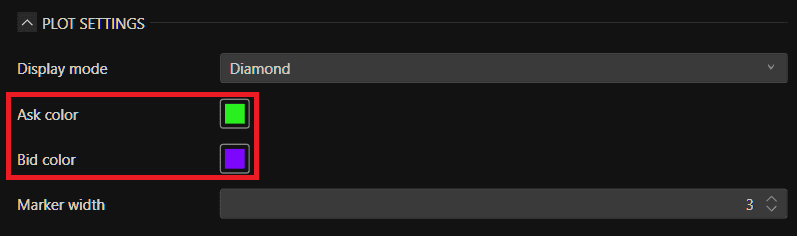
Ask Color / Bid Color Sets the color used to display Stop Runs on the Ask/ Bid side of the market.
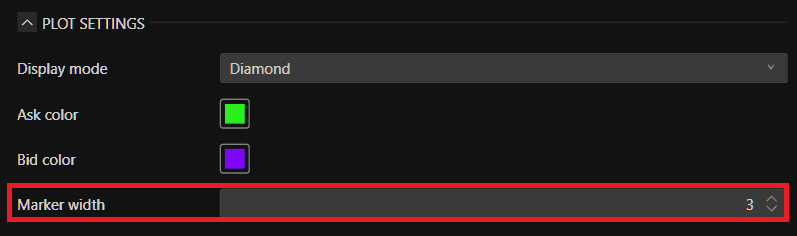
Marker Width Sets the thickness of the line used to mark the Stop Run on the chart.

Text Settings
Enable Text Toggles the text labels on or off on the chart.

Text Color Sets the color of the text displayed in the labels.

Text Size Sets the size of the text displayed in the labels.

Alerts
There is also a section dedicated to sound alerts for the signals generated by the indicator

Conclusion
The Stop Run indicator helps you understand one of the most common things that happens in the market every single day. Large players trigger stop orders to create fast moves and capture liquidity — and price very often reverses right after. By learning to spot these events and combining them with volume, DOM, and other tools in DeepDom, you get a much clearer picture of what is really driving price and where the market is likely to go next.
Still Having Trouble?
Our support team is available 24/7 and ready to help you with any issue you encounter.
When reaching out, please include:
A screenshot of the issue
A brief description of what you were trying to do
Support Ticket (Fastest Response) Visit www.deepcharts.com and create a support ticket directly on our website.
Email Support Reach us at support@deepcharts.com — please note that email responses may take a little longer than a support ticket.