Indicators
Updated:
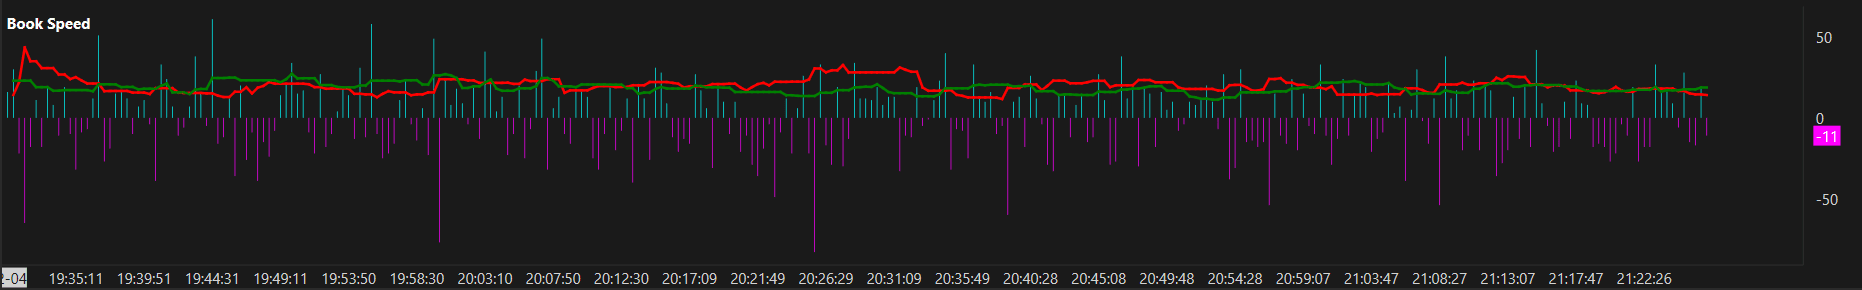
The Book Speed indicator displays histograms at the bottom of the chart showing how many book levels are consumed every n seconds. This allows you to visualize the pace at which liquidity is being absorbed on both the Bid and Ask side, and compare it with price movement to identify potential divergences between order flow and price direction.
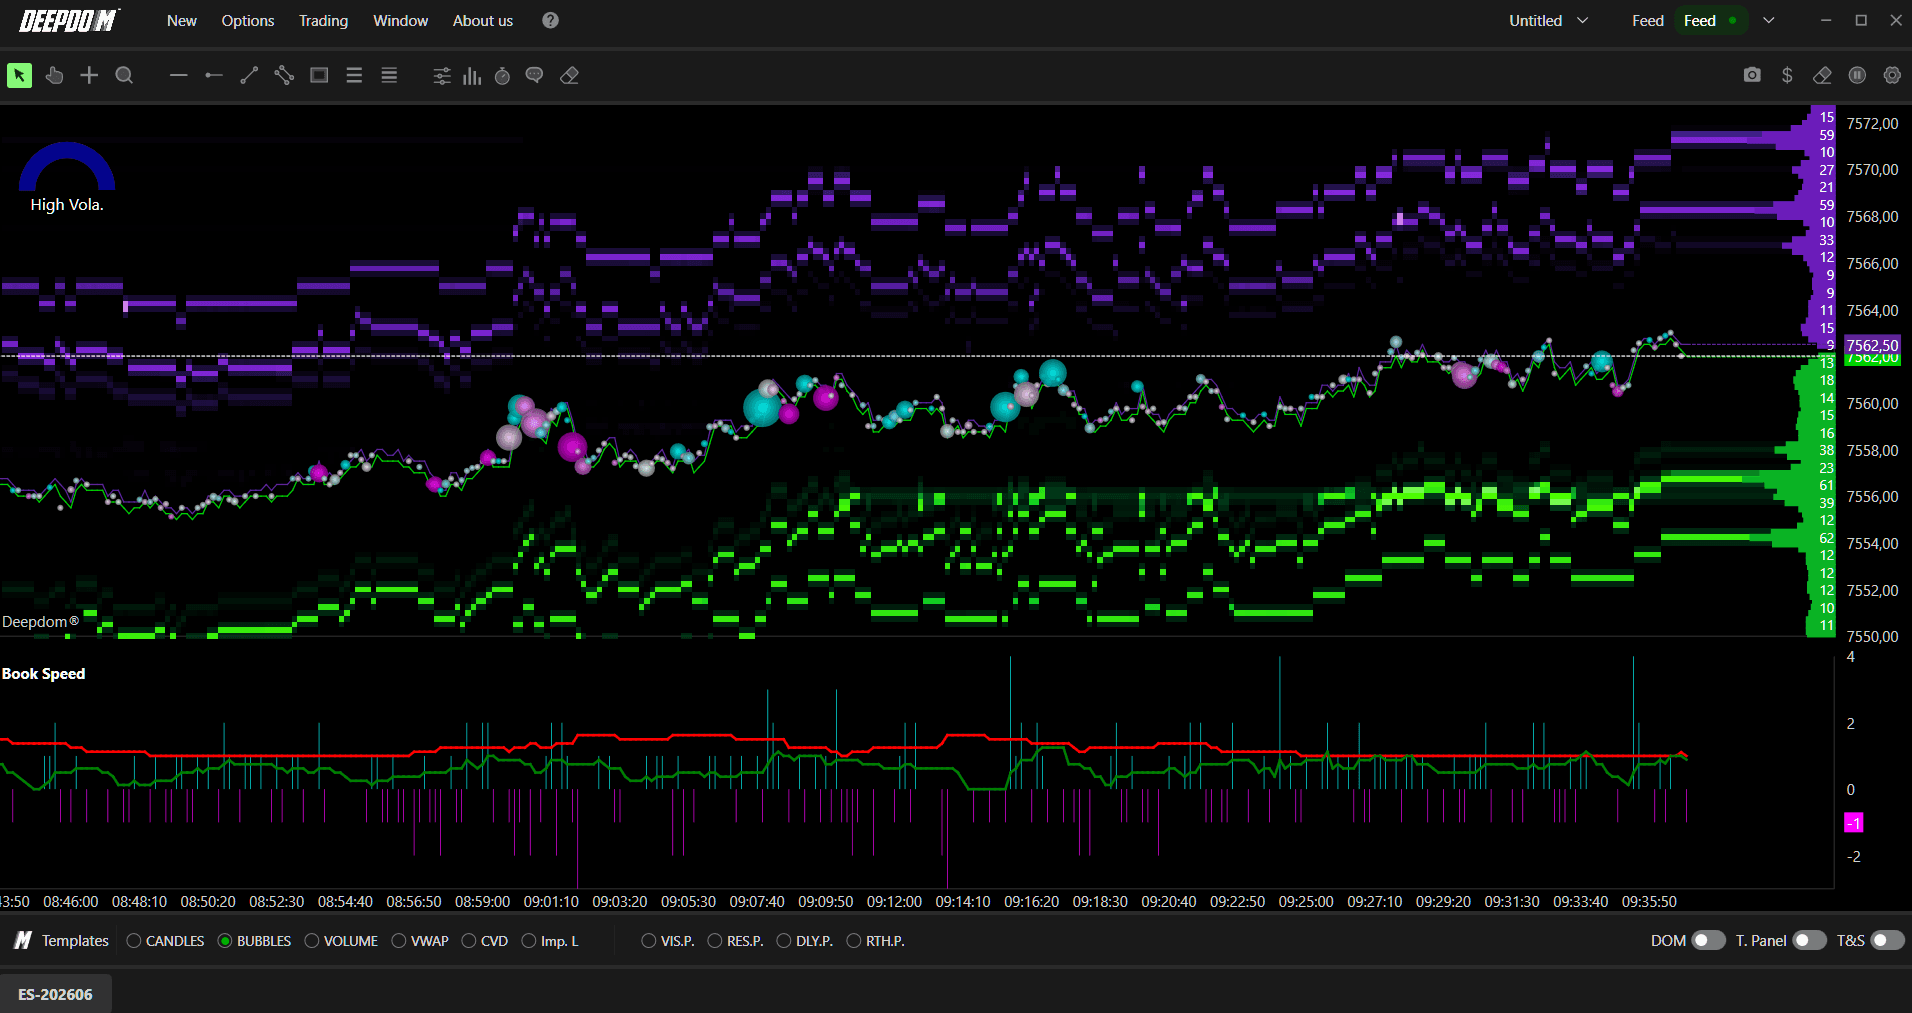
What is a Book Level? Think of the order book as a ladder of prices. Each "rung" on that ladder is a book level — it represents a price where buyers or sellers have placed their limit orders. When market orders come in and wipe out those limit orders, the level is "consumed." The faster levels are being consumed, the more aggressive the buying or selling pressure is in the market.
How to Add Book Speed to Your Chart
Right-click on the chart and select Indicators.
Search for the desired indicator and add it to your workspace by clicking the "+" button.
Open the indicator's settings panel, customize the parameters according to your preferences, and confirm the changes by clicking Save.

General Settings
Parameter Mode Defines how the indicator measures book activity. You can choose between:
Seconds — measures how many book levels are consumed within a set number of seconds. This is the most straightforward mode — you simply define a time window and the indicator counts how much liquidity was absorbed during that period

Tick Reversal — measures consumption based on price tick reversals. Instead of using time, this mode triggers a new measurement every time price reverses by a defined number of ticks. This is useful for traders who prefer to analyze the market based on price movement rather than fixed time intervals
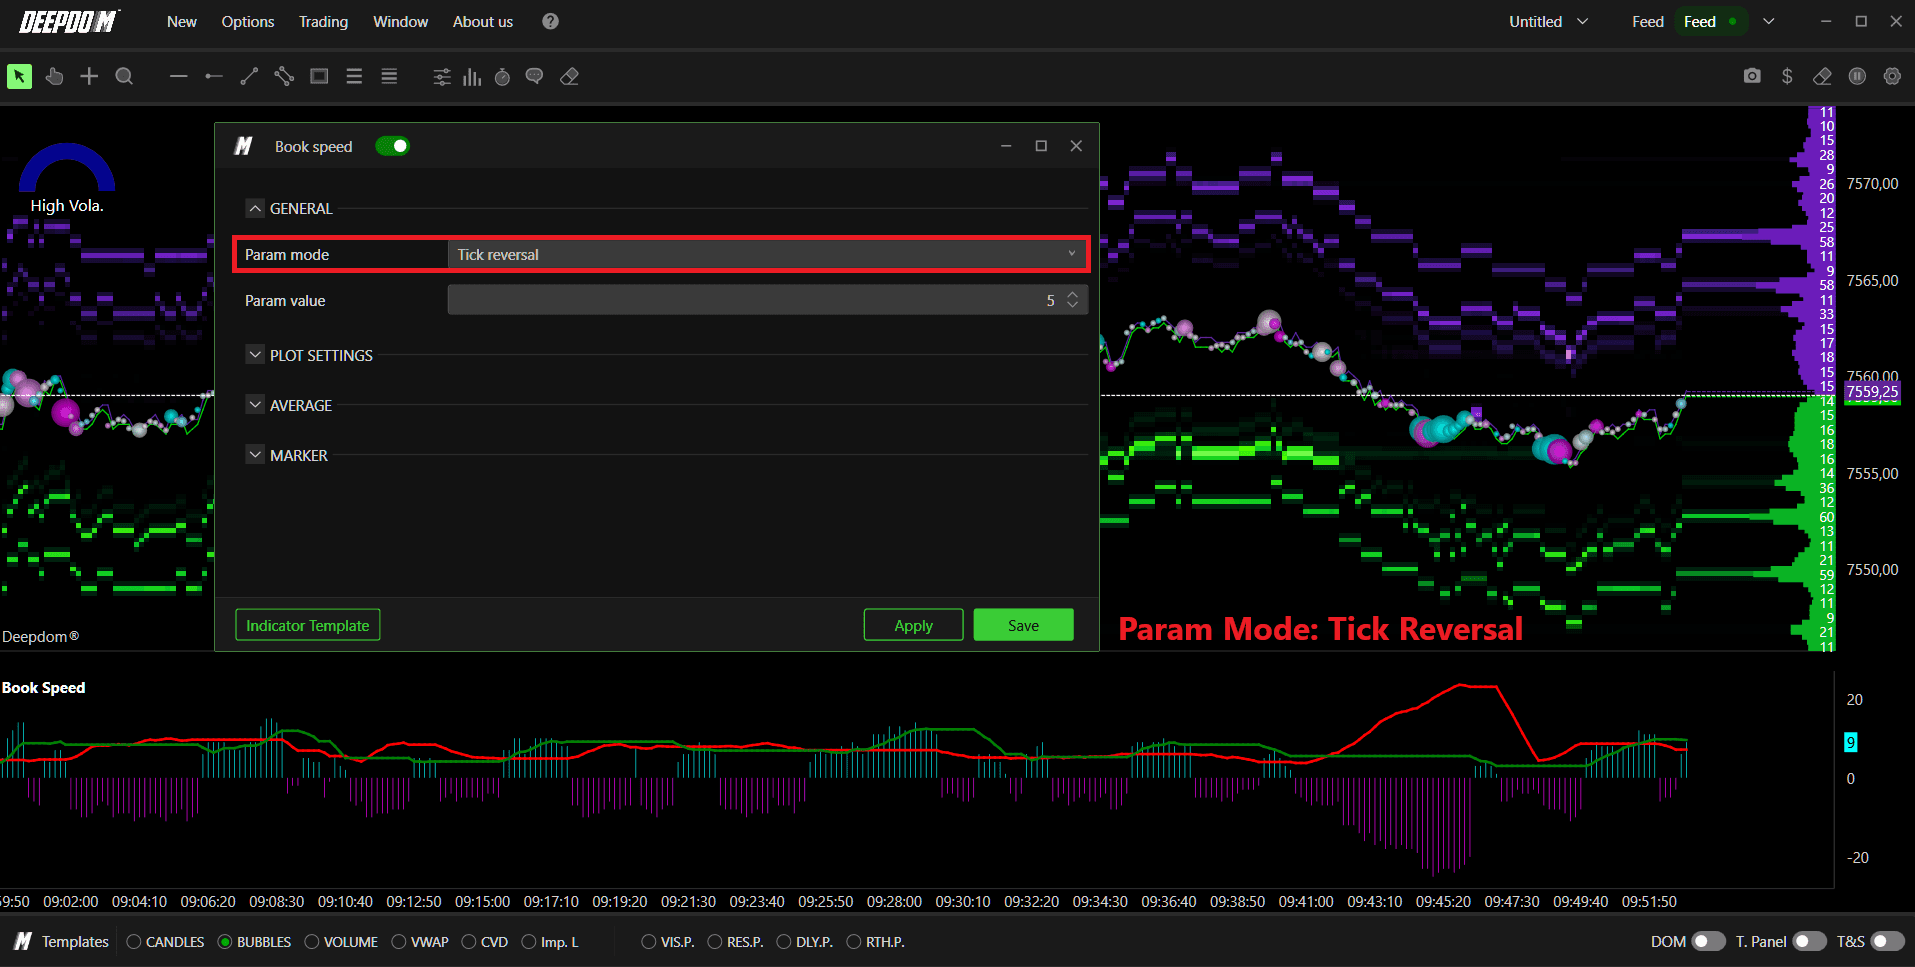
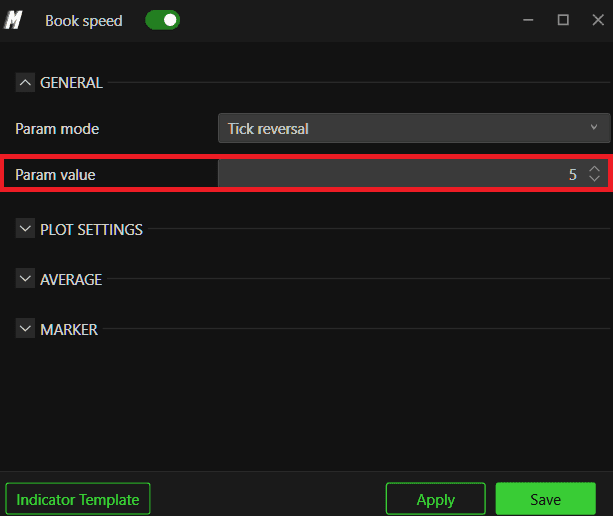
Parameter Value Sets the numeric value for the parameter chosen above. For example, if you selected Seconds, entering 10 here means the indicator calculates book levels consumed every 10 seconds. If you selected Tick Reversal, this value defines how many ticks of reversal are needed to start a new measurement.
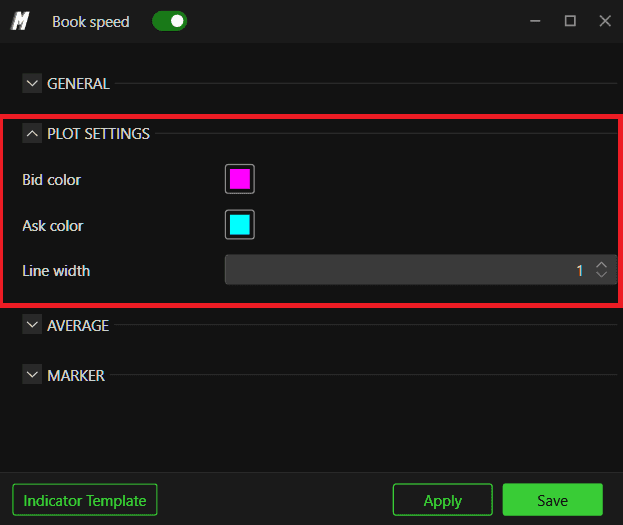
Plot Settings
Allows you to customize the appearance of the histograms:
Set the color of the Bid histogram
Set the color of the Ask histogram
Set the Line Width of both histograms
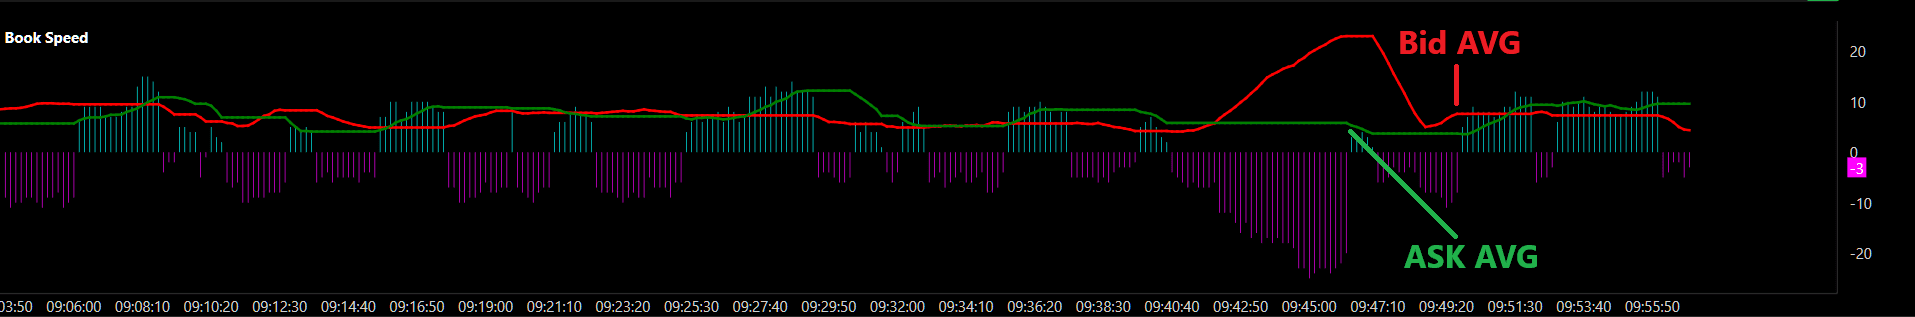
Average
Enables a moving average line over the Book Speed histogram for both Bid and Ask.
What is a Moving Average here? A moving average smooths out the histogram bars by calculating a rolling average over a defined number of periods. Instead of seeing every spike and dip in book consumption, you get a smoother line that shows the overall trend — making it much easier to spot whether book activity is genuinely picking up or slowing down over time.
Customize the color of Avg Bid and Avg Ask
Avg length — a longer length gives a smoother line, a shorter length reacts faster to changes

Marker
Enables a marker line on the histogram to define a threshold level.
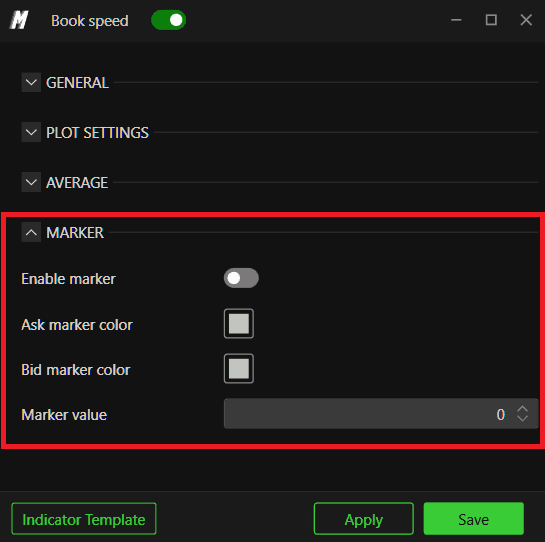
What is a Marker? A marker is simply a horizontal reference line you draw at a specific value on the histogram. You decide in advance what level of book consumption is significant to you — and the marker makes it instantly visible whenever the histogram crosses that level. Think of it like a trip wire — when book activity exceeds it, you know something notable is happening.
Enable or disable the marker
Set a custom color for the Bid and Ask marker
Set the marker value — the level at which the marker line appears

Conclusion
The Book Speed indicator is a powerful tool for reading the aggressiveness of market participants in real time. By comparing the rate of book consumption against price movement, you can detect divergences that may signal a potential reversal or continuation before it becomes visible in price alone.
Still Having Trouble?
Our support team is available 24/7 and ready to help you with any issue you encounter.
When reaching out, please include:
A screenshot of the issue
A brief description of what you were trying to do
Support Ticket (Fastest Response) Visit www.deepcharts.com and create a support ticket directly on our website.
Email Support Reach us at support@deepcharts.com — please note that email responses may take a little longer than a support ticket.