Indicators
Updated:
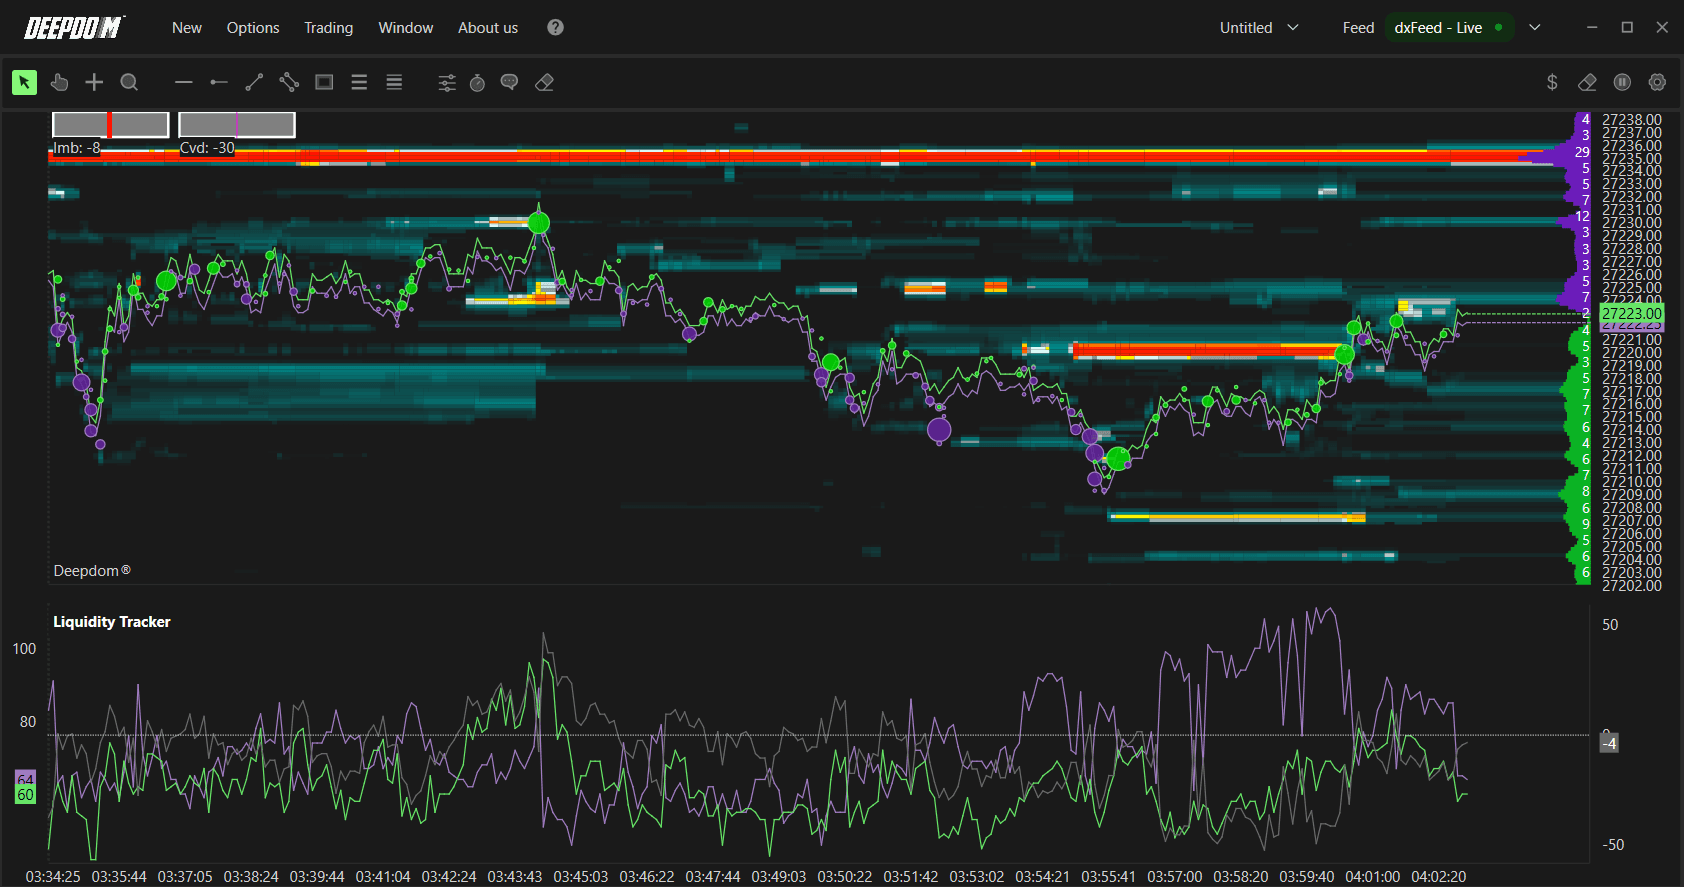
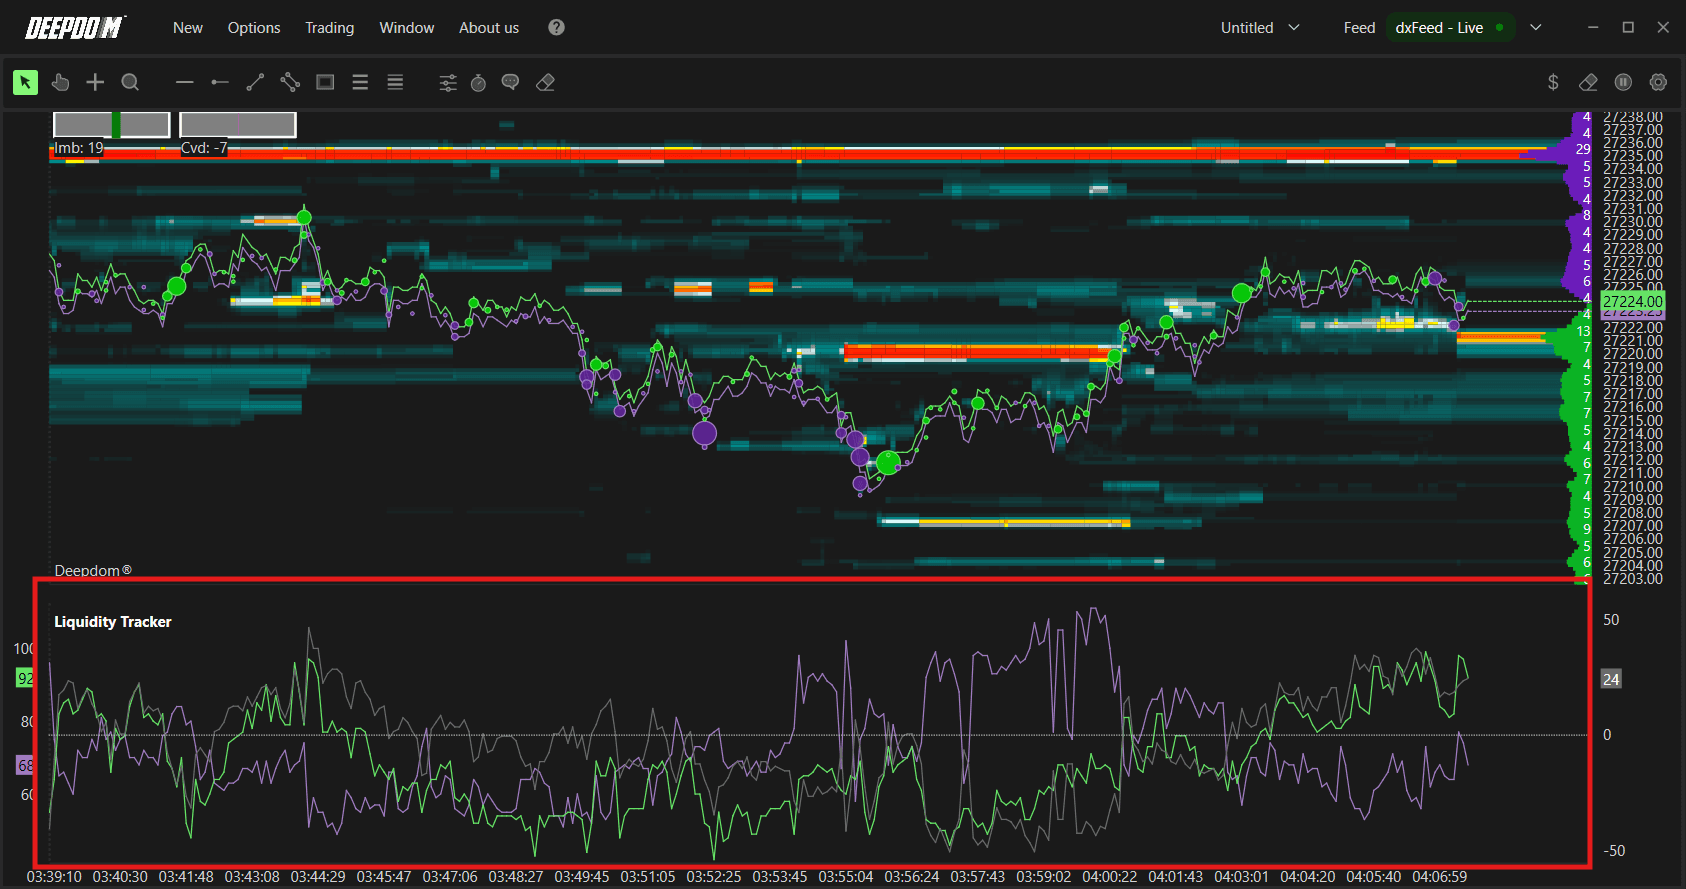
The Liquidity Tracker monitors and displays the level of passive liquidity on both the Bid (demand) and Ask (supply) sides of the market in real time. It shows you where limit orders are concentrated in the DOM (Depth of Market) and how the balance between buyers and sellers is shifting over time. By using distinct colors for Bid, Ask, and Delta, the indicator helps you quickly spot moments of peak interest and potential price reactions.
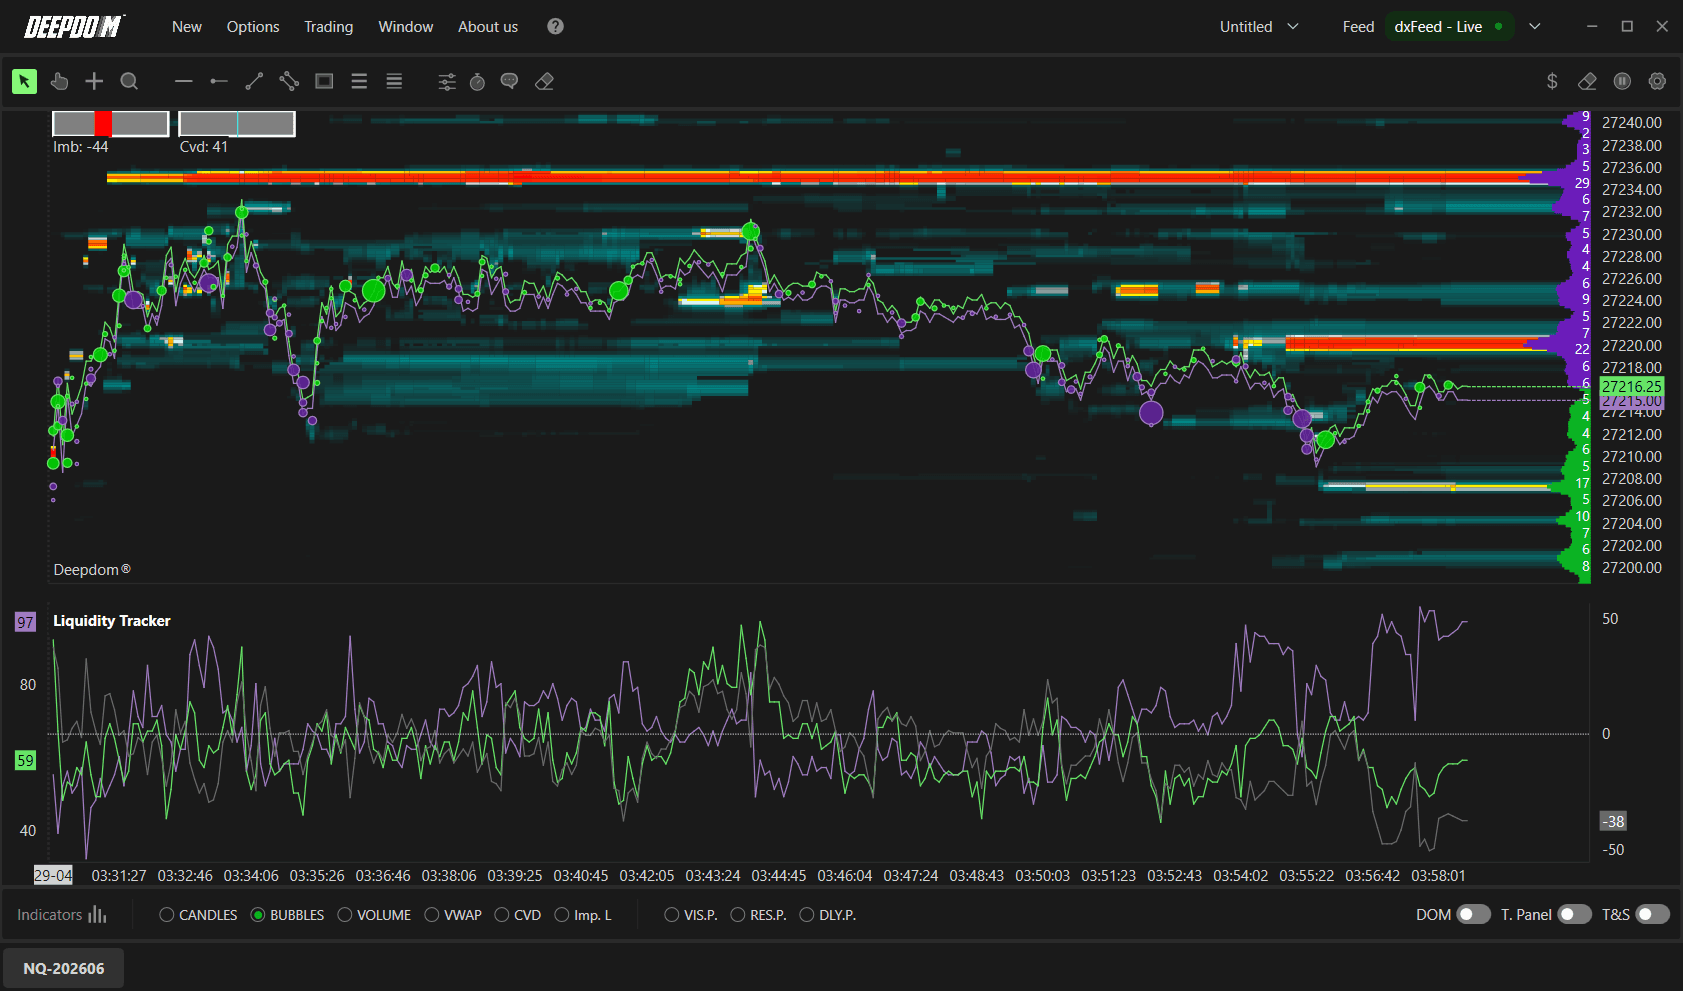
What is Passive Liquidity? Passive liquidity refers to limit orders sitting in the order book waiting to be filled. For example, a trader places a limit buy order at 26,750 — that order sits in the book as passive liquidity on the Bid side. It is not actively hitting the market — it is waiting for price to come to it. The Liquidity Tracker measures how much of this passive liquidity is sitting on each side of the market at any given moment, and how that balance is changing over time.
How to Set Up the Liquidity Tracker
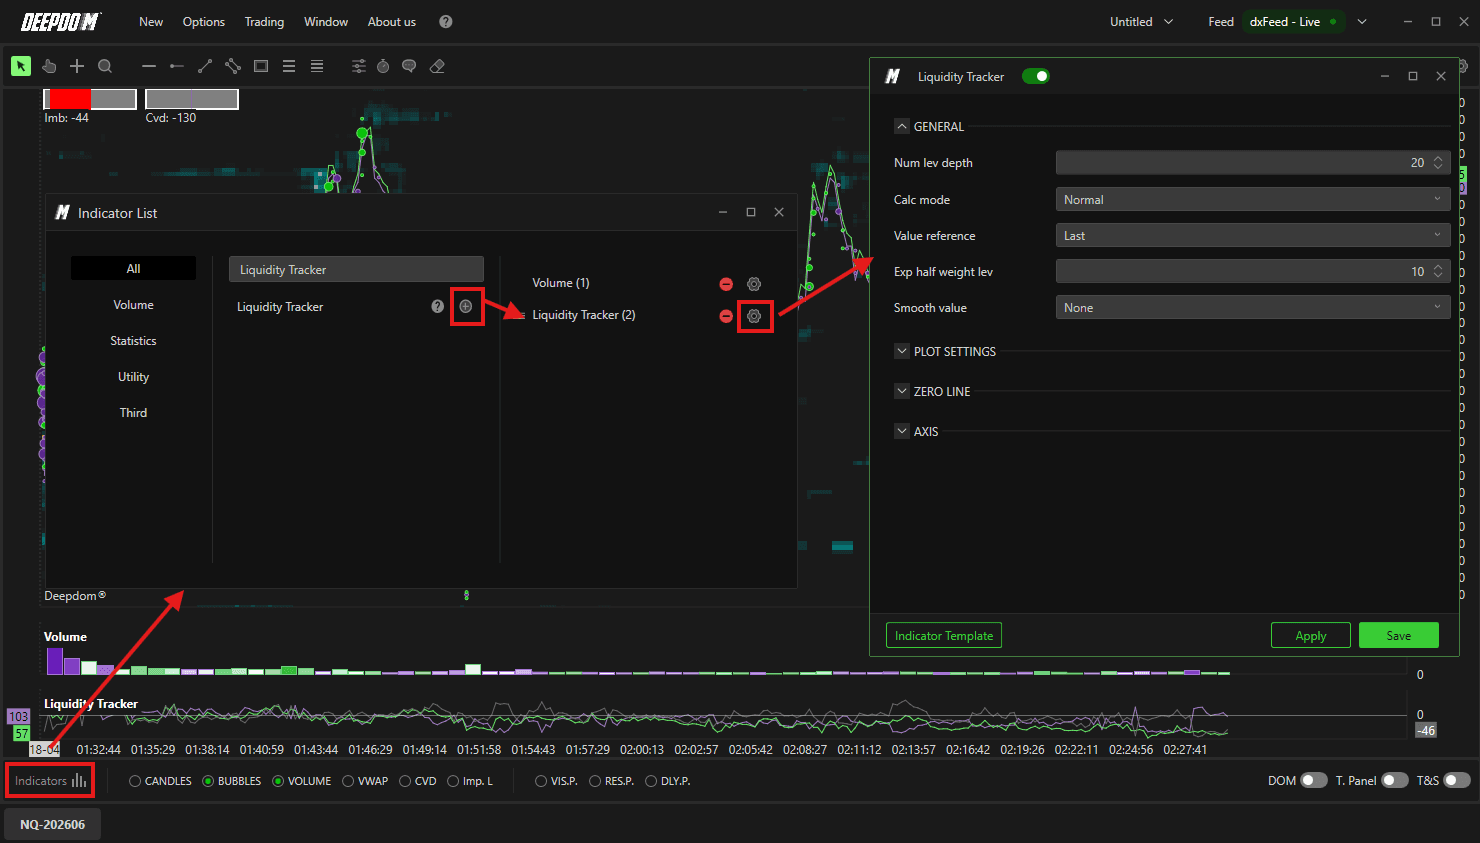
Click the Indicators icon on the chart
Find Liquidity Tracker in the list and click + to add it
Click the settings icon on the indicator to open its configuration window
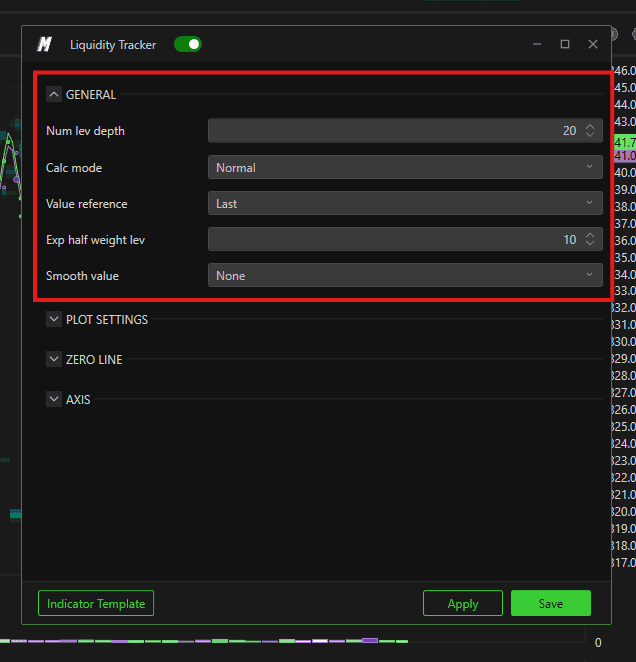
General Settings
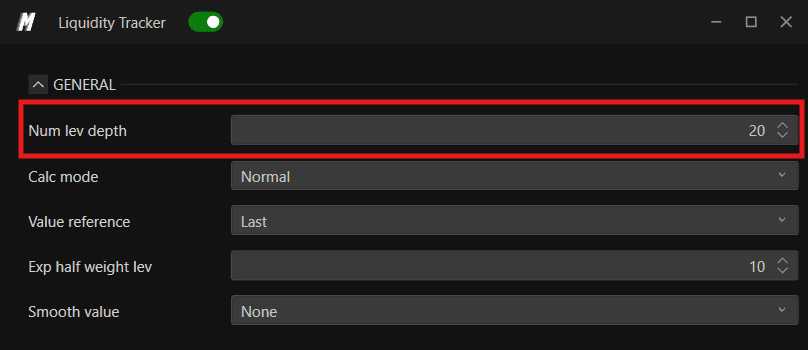
1. Num Lev Depth Sets the number of book depth levels included in the liquidity calculation. A higher number considers more levels of the DOM, giving a broader view of available liquidity.
Examples -
Num Lev Depth - 20
Num Lev Depth - 200
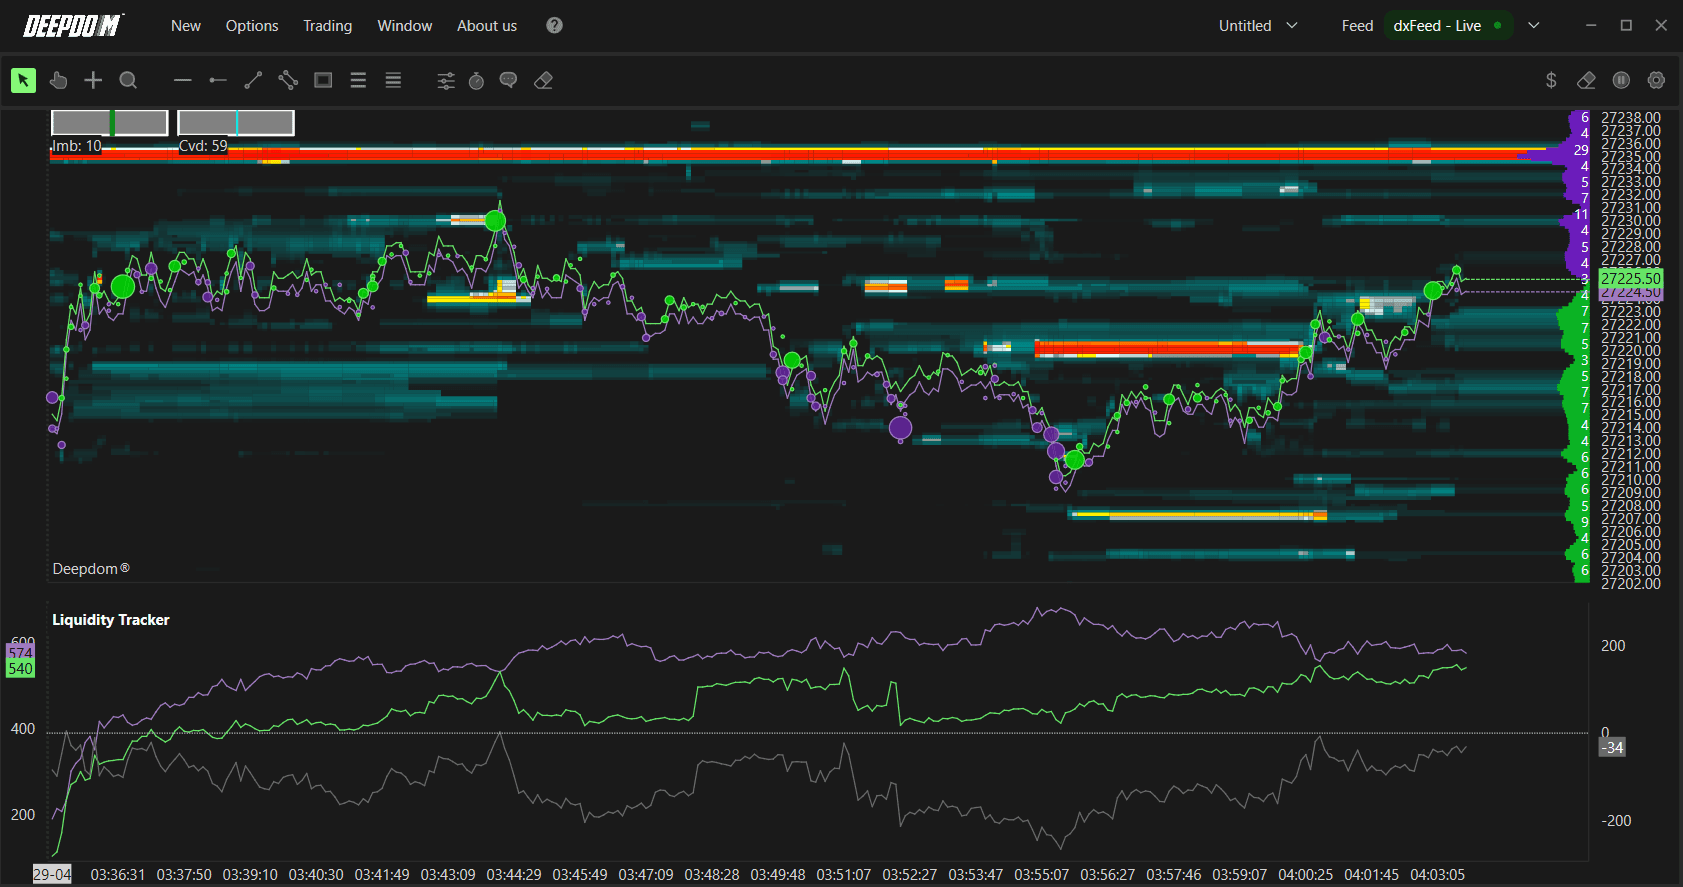
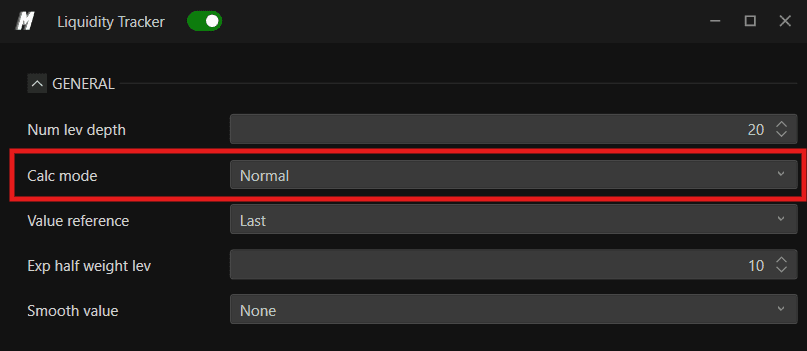
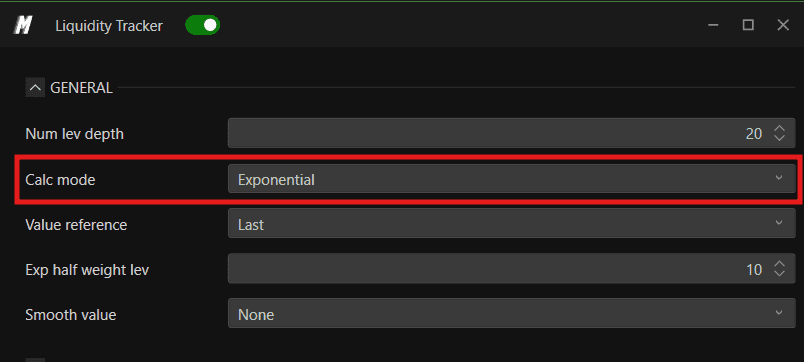
2. Calc Mode Defines how liquidity is calculated across the depth levels:
Normal — liquidity is calculated in a direct and linear manner, treating all depth levels equally
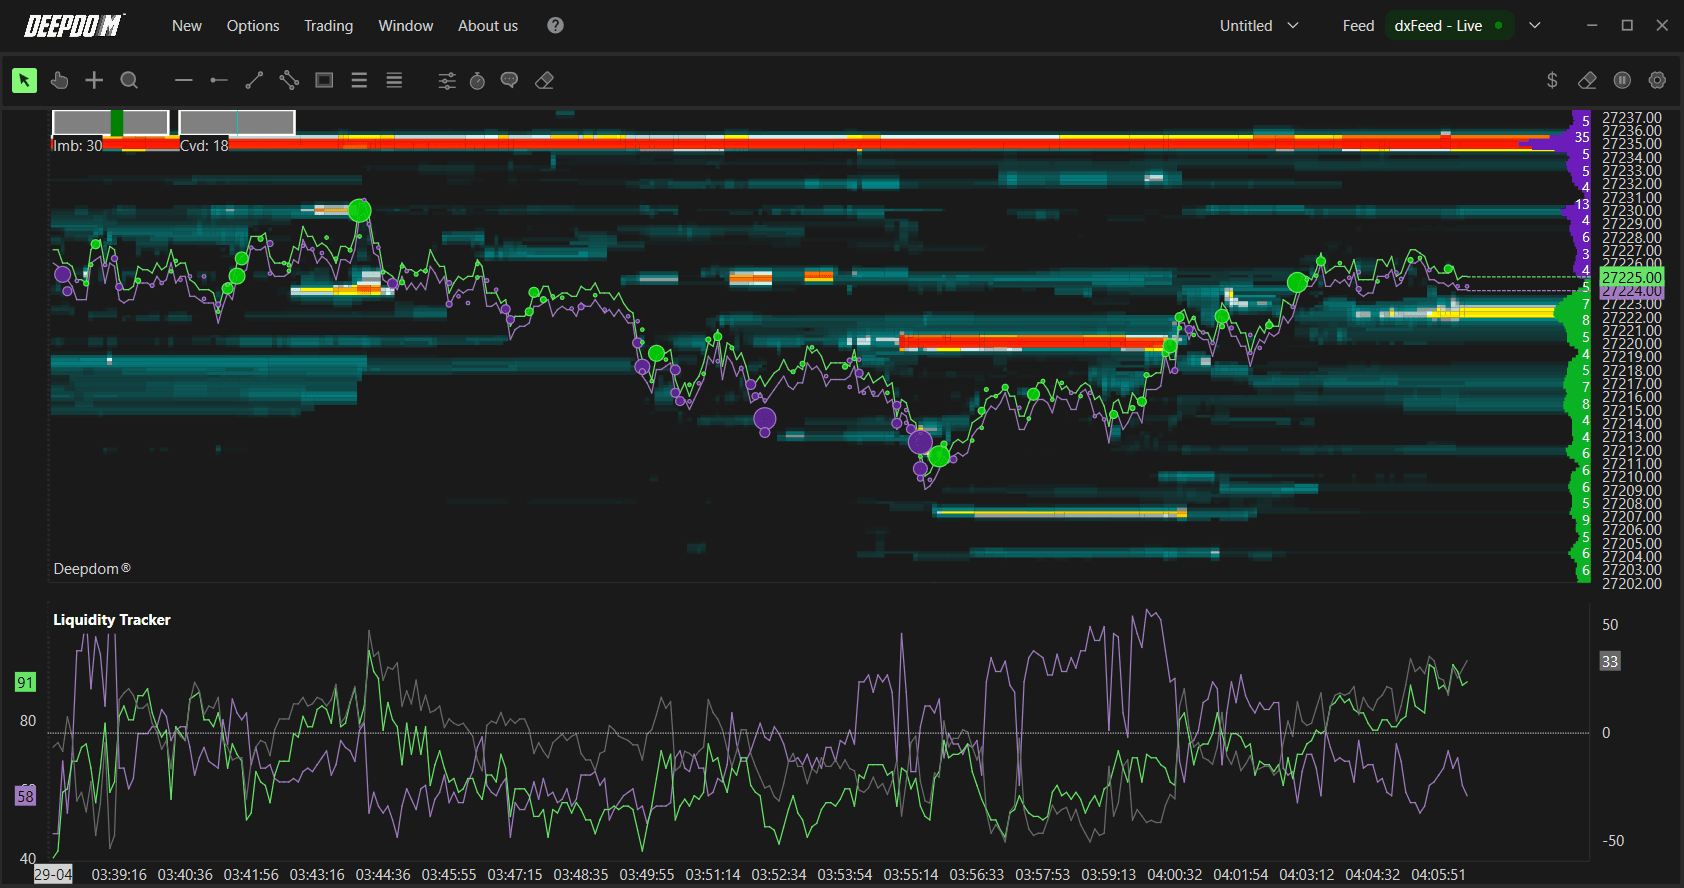
Exponential — applies greater weight to levels closest to the current price, making nearby liquidity more influential than liquidity further away in the book
3. Value Reference Defines the reference point used to measure and compare liquidity across book depth levels. Options include:
Last — calculates liquidity relative to the most recent price level in the book
Peak — calculates liquidity relative to the highest liquidity level detected in the book
4. Exp Half-Weight Lev Only relevant when using Exponential mode. This defines the midpoint level at which the weight of data is halved. In practice, it controls how quickly the influence of deeper book levels fades compared to levels near the current price. A lower value concentrates more weight very close to the price, while a higher value spreads the weight more evenly across levels.
5. Value Smooth Applies smoothing to the data to reduce market noise and display a cleaner representation of liquidity trends. Options include:
No — no smoothing applied
One Sec — smoothing over 1 second
Three Secs — smoothing over 3 seconds
Five Secs — smoothing over 5 seconds
Ten Secs — smoothing over 10 seconds
Thirty Secs — smoothing over 30 seconds
One Min — smoothing over 1 minute
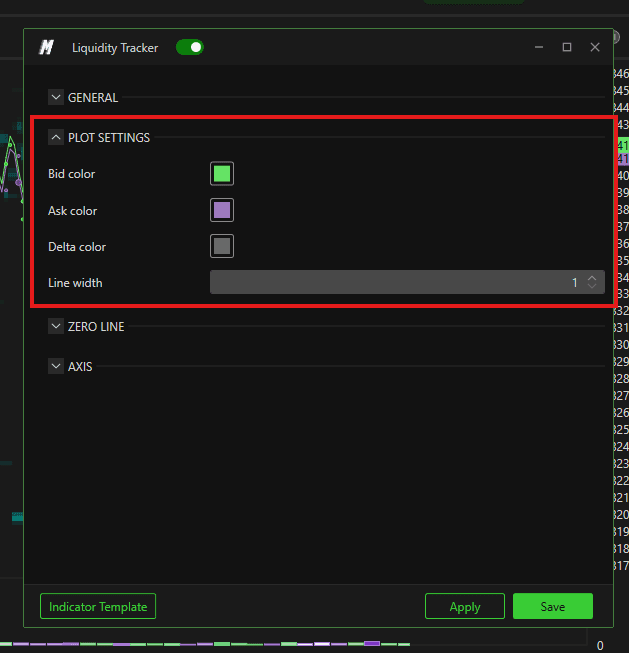
Plot Settings
1. Bid Color Sets the color used to represent liquidity on the Bid (demand) side of the market.
2. Ask Color Sets the color used to represent liquidity on the Ask (supply) side of the market.
3. Delta Color Sets the color used to represent the Liquidity Delta — the difference between Bid and Ask liquidity at any given moment. A positive delta indicates more liquidity on the Bid side; a negative delta indicates more on the Ask side.
4. Line Width Sets the thickness of the Bid, Ask, and Delta lines displayed in the indicator panel.
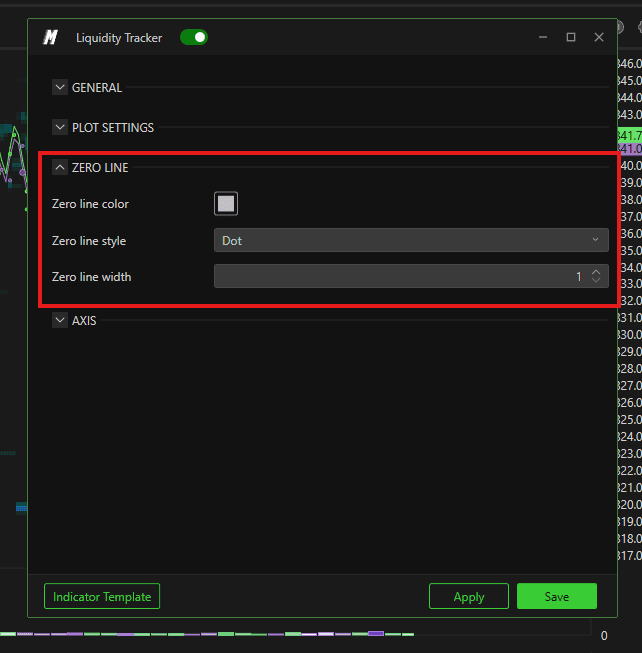
Zero Line
The zero line represents the point of balance between Bid and Ask liquidity. When the indicator crosses above or below this line, it signals a shift in the dominance of liquidity between buyers and sellers.
1. Zero Line Color Sets the color of the zero line.
2. Zero Line Style Defines the visual style of the zero line. Options include:
Solid — a continuous unbroken line
Dash — a dashed line
Dot— a dotted line
Dash dot — alternates between strokes and points
Dash dot dot — alternates between strokes and two points
3. Zero Line Width Sets the thickness of the zero line.
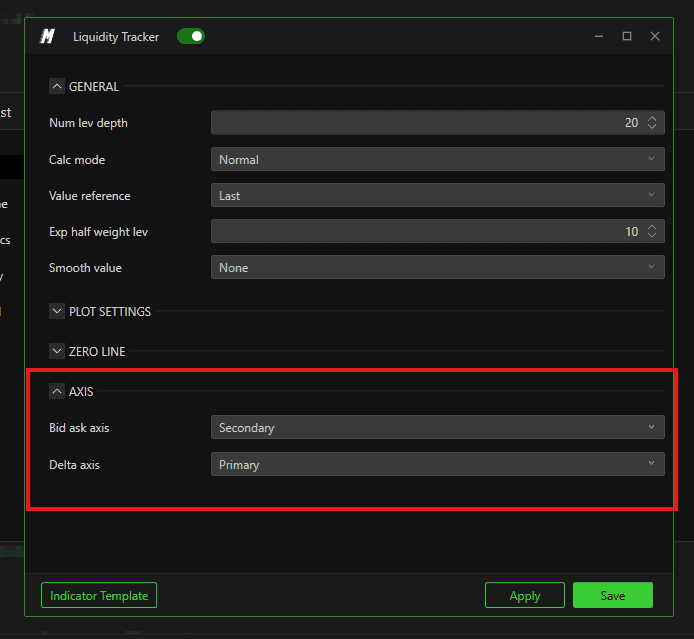
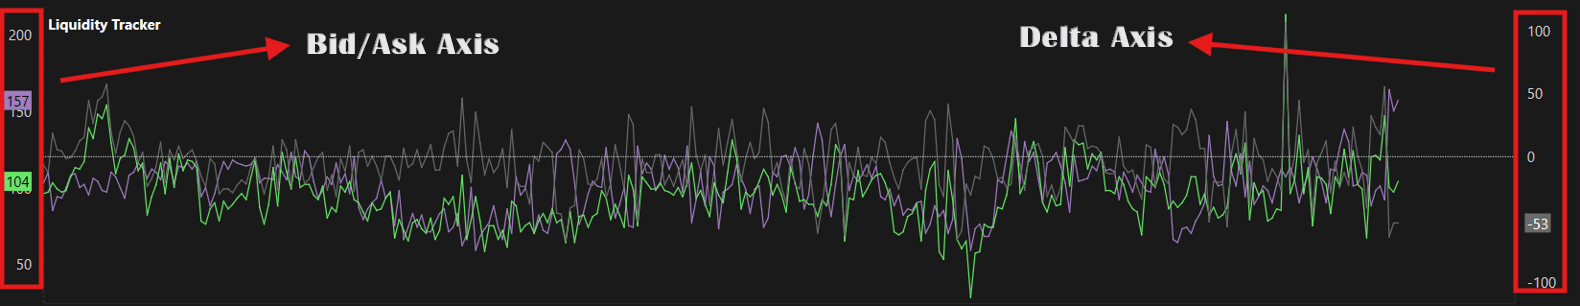
Axis
Bid Ask Axis Defines which axis the Bid and Ask lines are scaled against:
Primary — Bid and Ask are plotted on the left axis with an independent scale
Secondary — Bid and Ask are plotted on the right axis
Delta Axis Defines which axis the Delta line is scaled against:
Primary — Delta is plotted on the left axis with an independent scale
Secondary — Delta is plotted on the right axis
Setting Bid Ask and Delta to different axes allows each to be read on its own scale, making it easier to compare their movements without one overshadowing the other.
Conclusion
The Liquidity Tracker gives you a real-time view of where passive liquidity is building and shifting in the DOM. By monitoring the balance between Bid and Ask liquidity and watching for meaningful changes in the delta, you can gain early insight into potential price reactions before they become visible in price alone.
Still Having Trouble?
Our support team is available 24/7 and ready to help you with any issue you encounter.
When reaching out, please include:
A screenshot of the issue
A brief description of what you were trying to do
Support Ticket (Fastest Response) Visit www.deepcharts.com and create a support ticket directly on our website.
Email Support Reach us at support@deepcharts.com — please note that email responses may take a little longer than a support ticket.