Indicatori avanzati
Updated:
Il Deep V-Tracker è un indicatore sofisticato di Order Flow progettato per rilevare squilibri volumetrici e specifici pattern di prezzo. Fornisce ai trader indicazioni sia sull'azione del prezzo sia sulle dinamiche sottostanti del flusso degli ordini. L'indicatore è composto da due moduli principali:
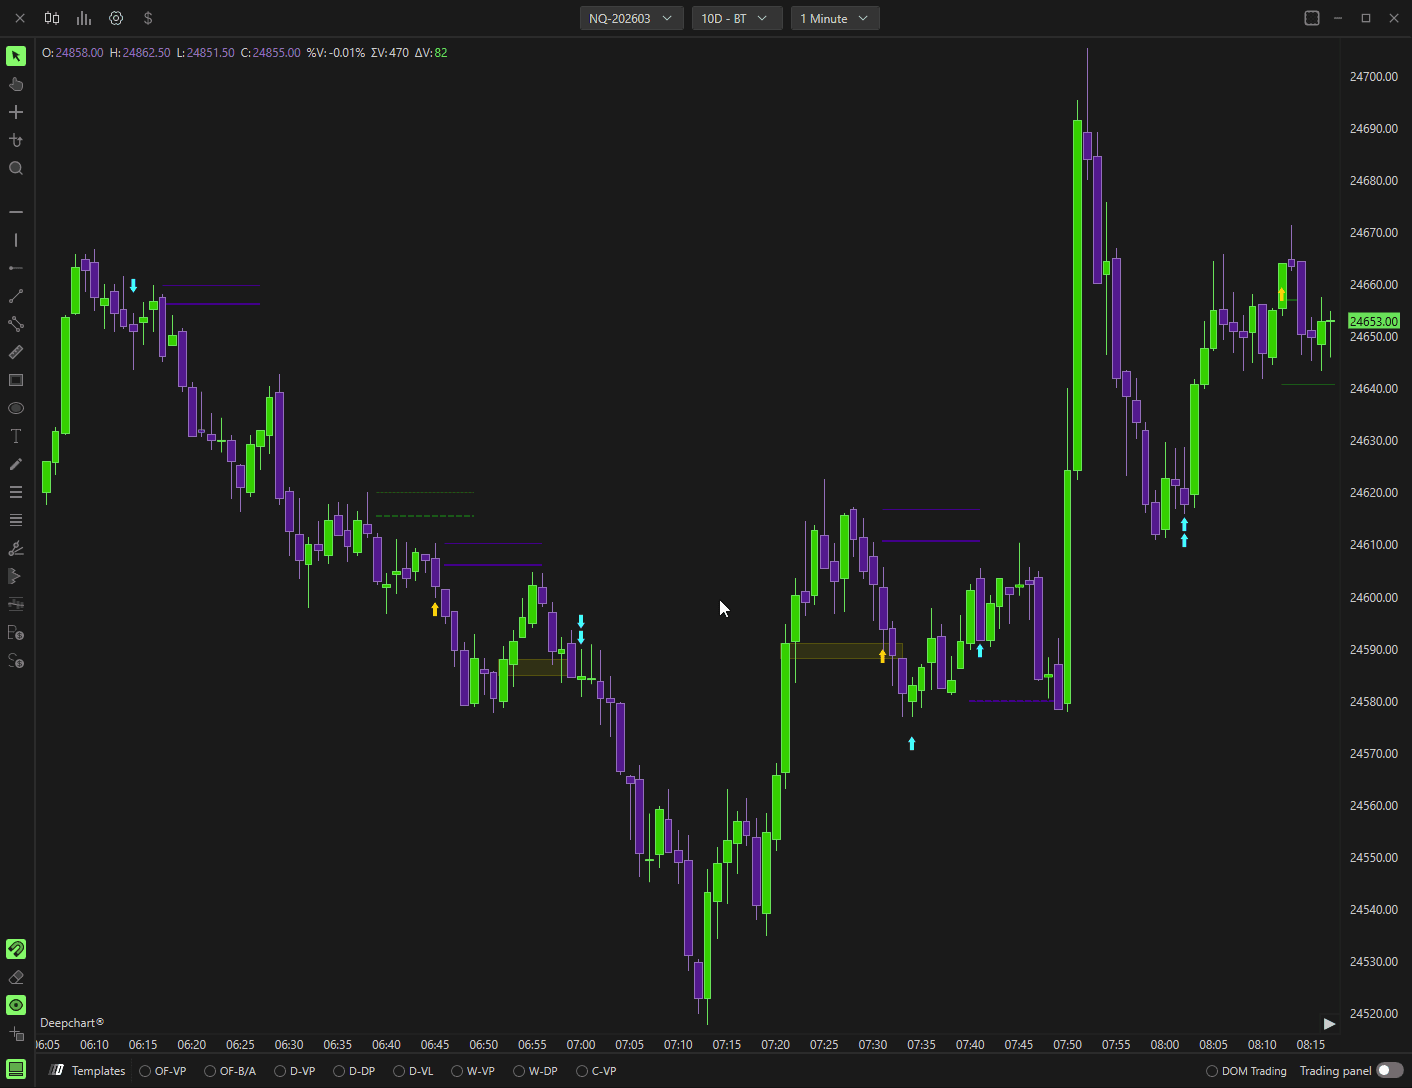
Patterns – Analizza i movimenti delle candele e l'azione del prezzo.
Absorption & Pressure – Valuta l'attività volumetrica ai livelli chiave.
1. Applicazione di Deep V-Tracker
Apri la Lista indicatori sul tuo grafico.
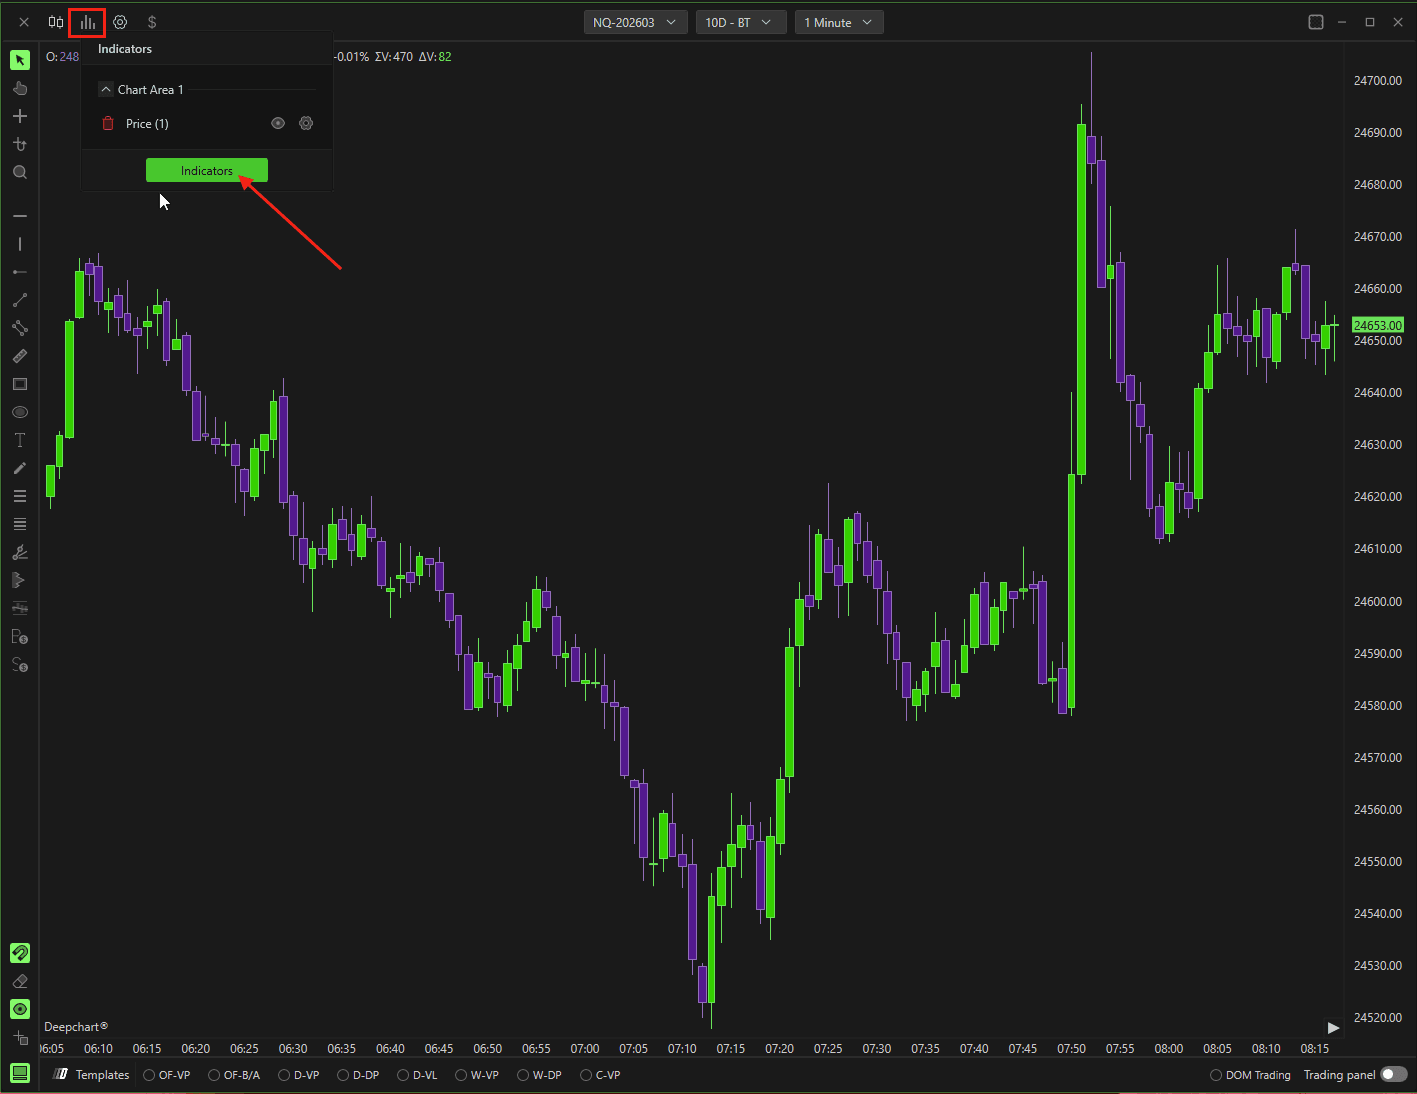
Individua Deep V-Tracker e fai clic sul pulsante + per aggiungerlo.
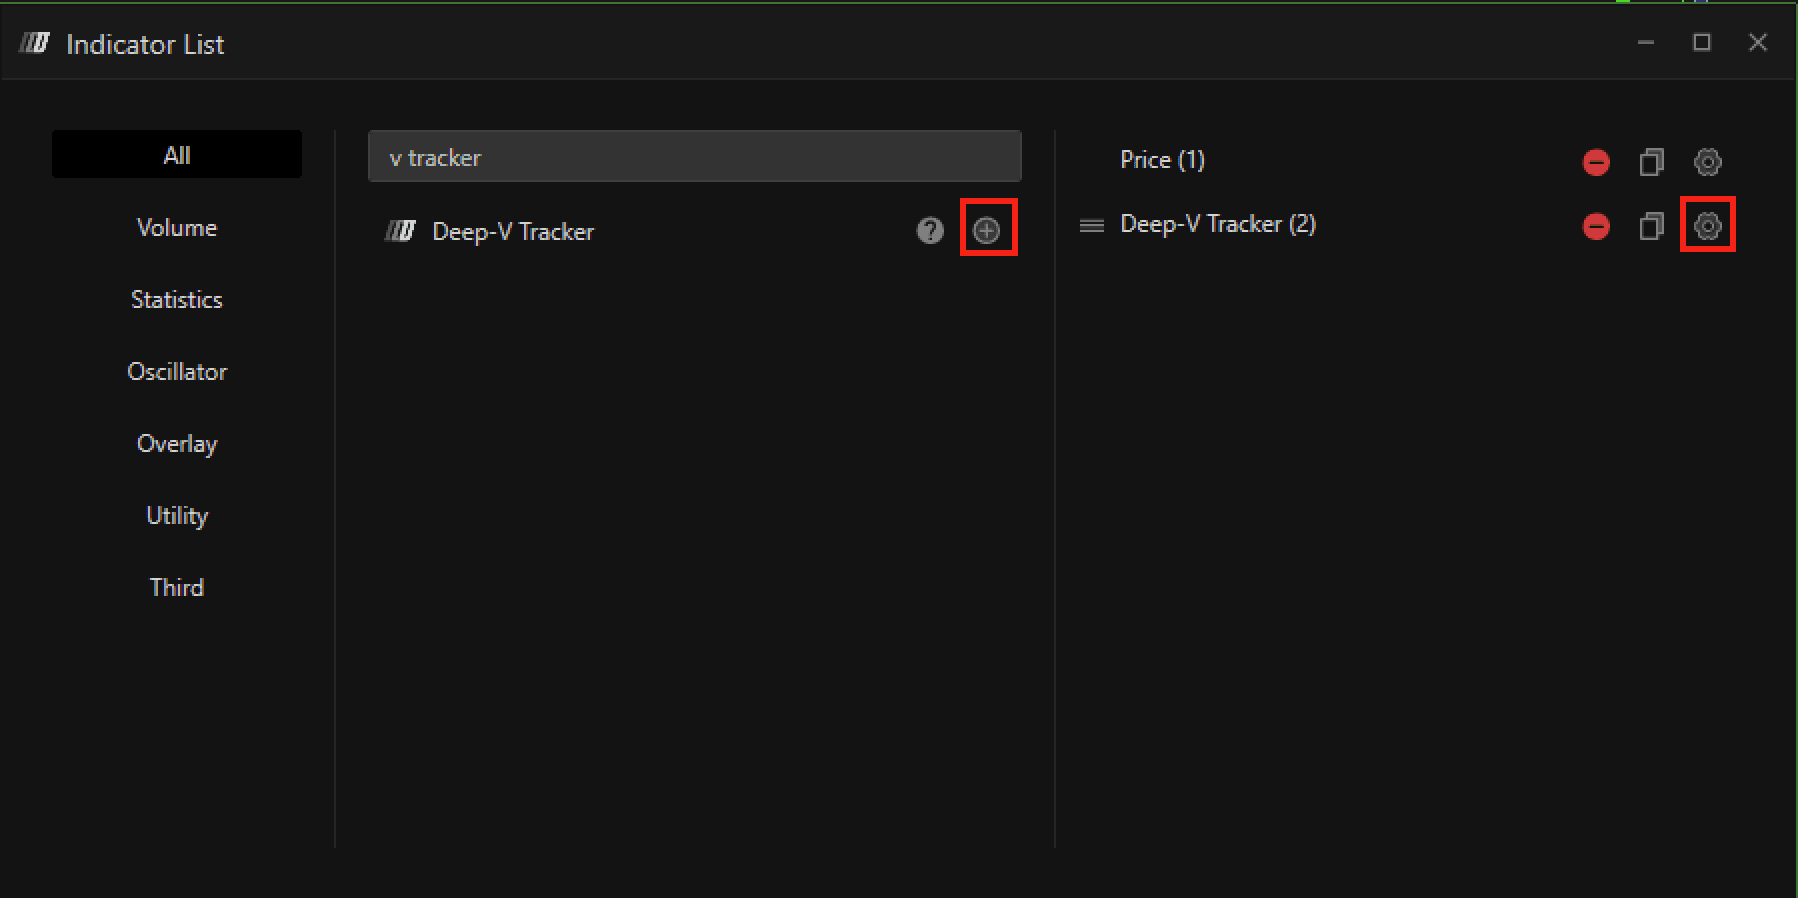
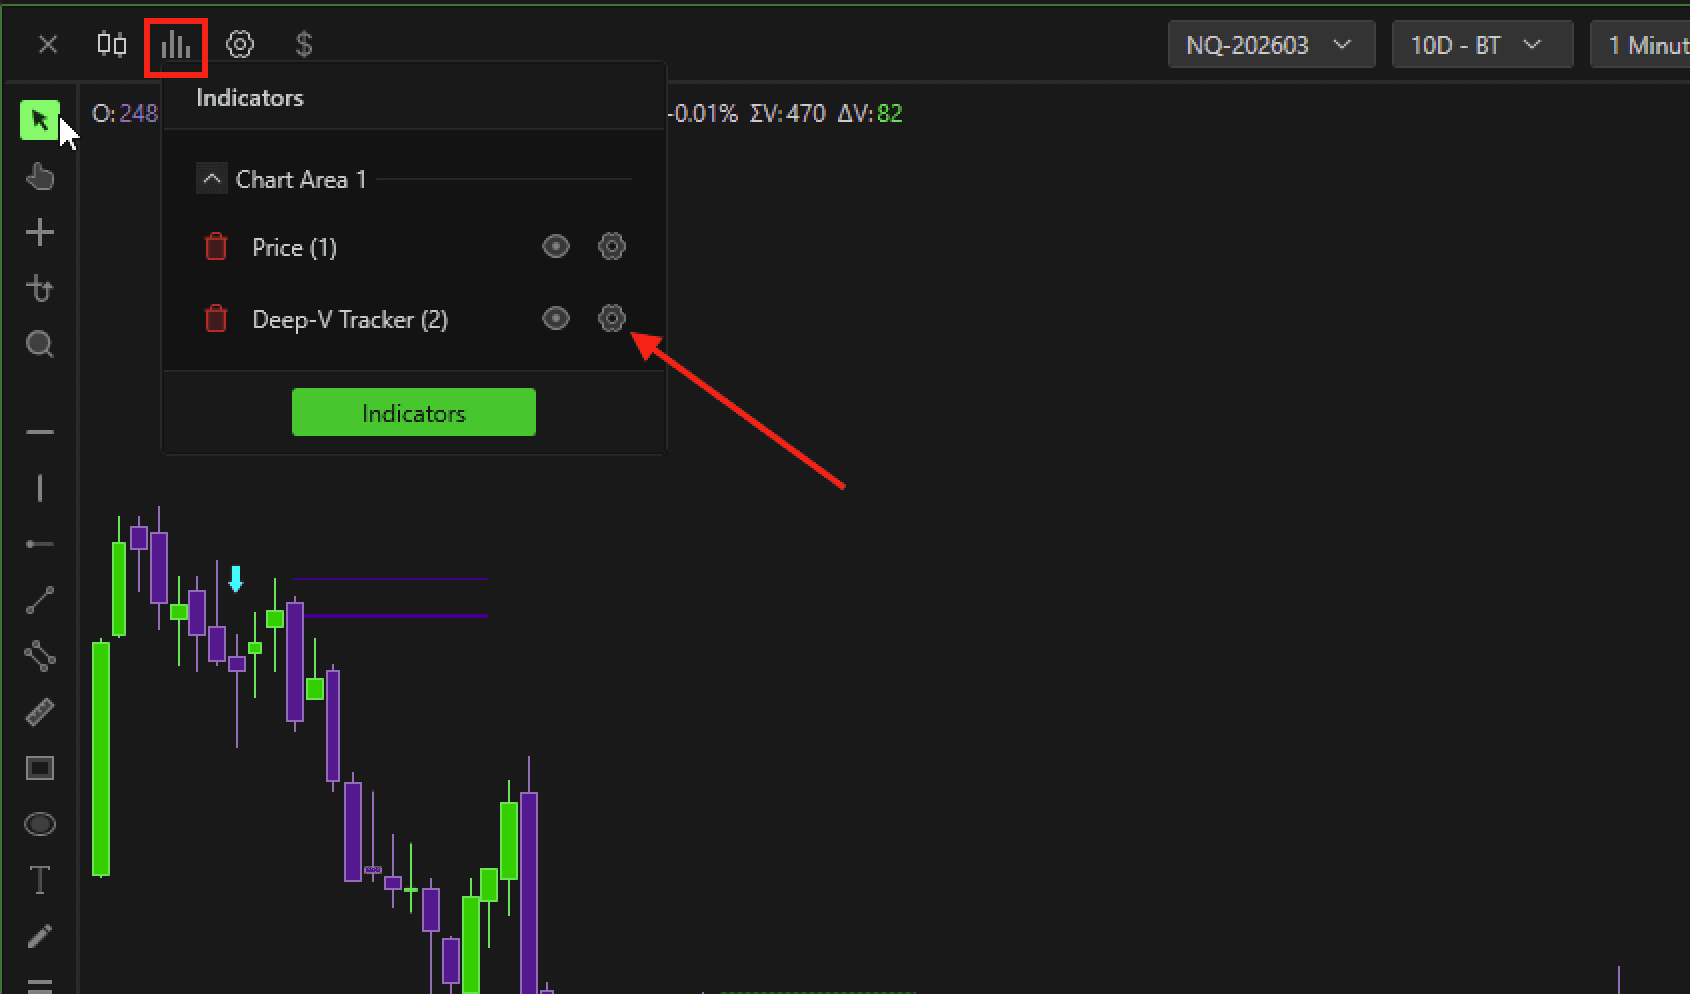
Fai clic sull'icona Impostazioni accanto a Deep V-Tracker nell'elenco degli indicatori attivi per configurarne i parametri.
2. Modulo Patterns
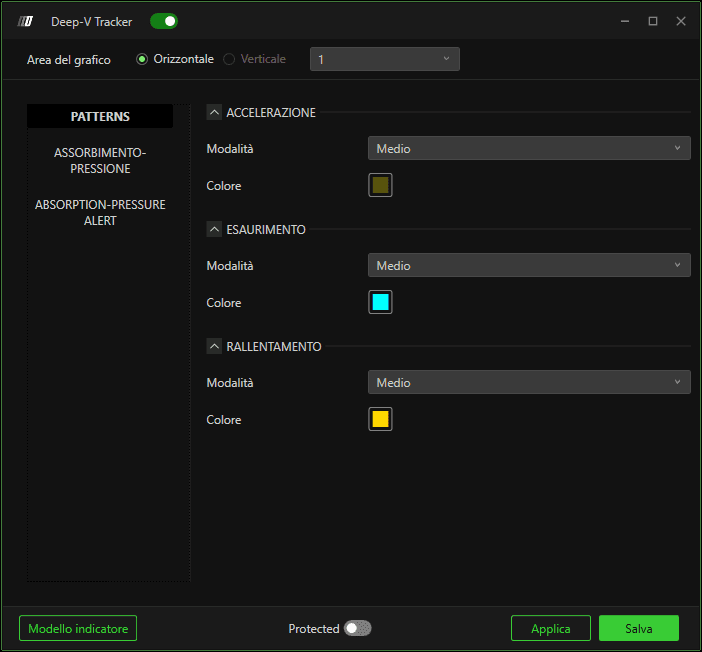
Il modulo Patterns identifica anomalie nella velocità di trading e nel comportamento delle candele. Esistono tre tipi di pattern: Accelerazione, Esaurimento e Rallentamento. Per chiarezza, si consiglia di attivare solo Accelerazione per mantenere il grafico pulito.
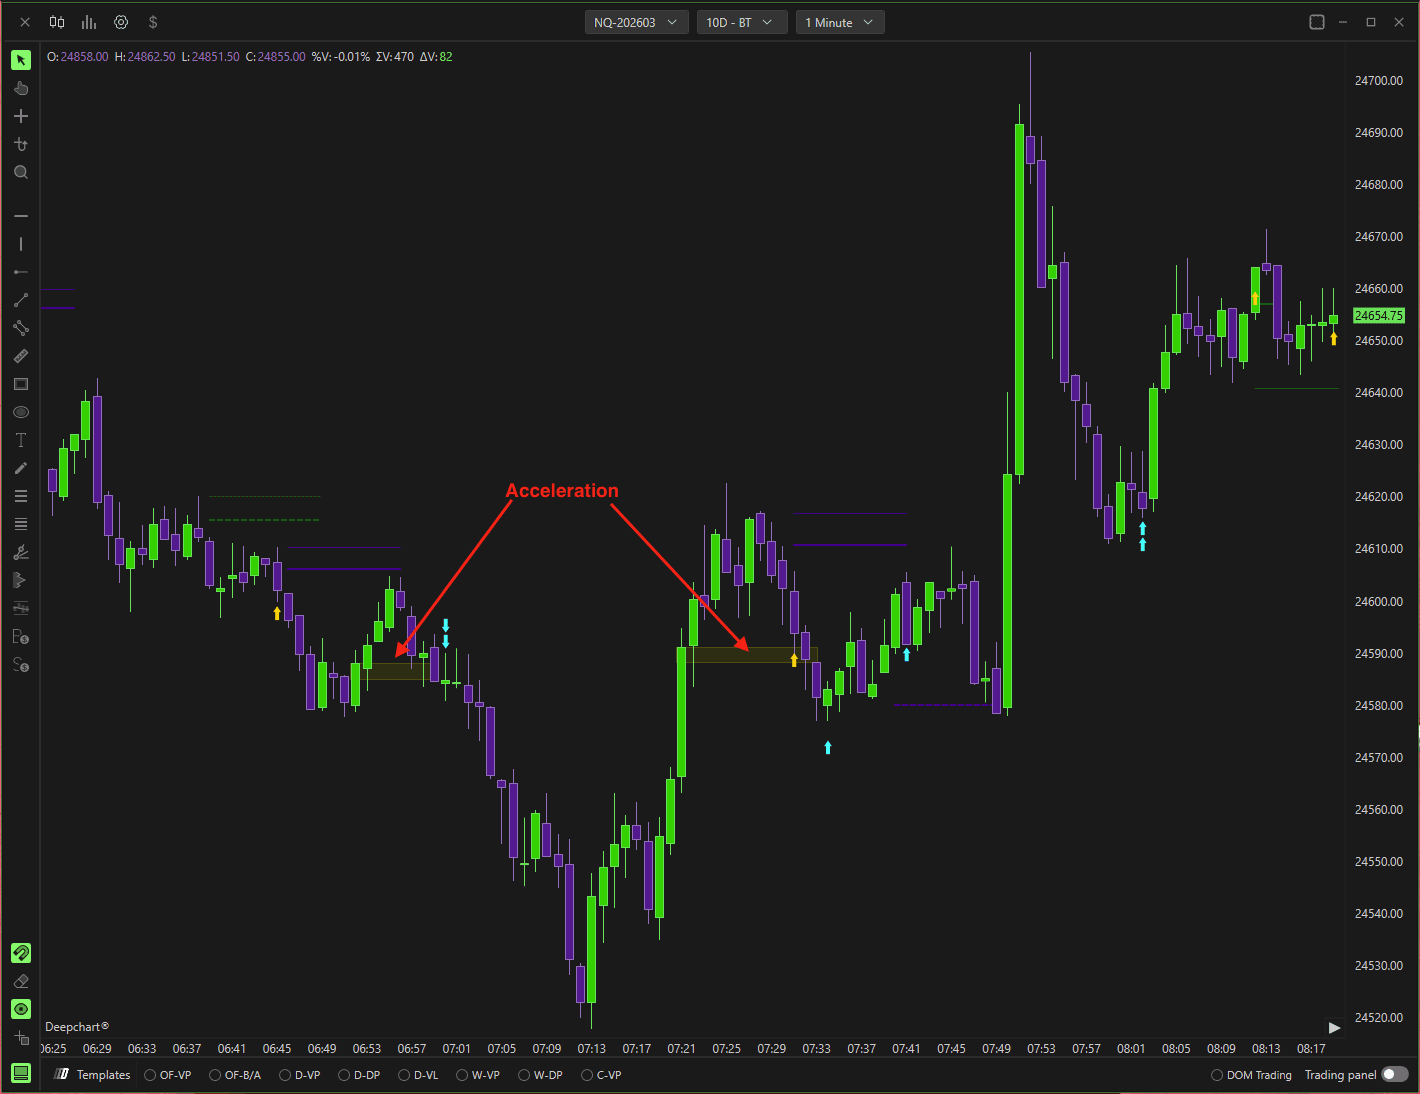
Accelerazione
Definizione: Rileva un improvviso “colpo” o accelerazione nel flusso degli ordini durante la formazione della candela.
Visualizzazione: Viene mostrato come un riquadro ciano pieno che copre il corpo della candela o parte di esso.
Significato operativo: Indica zone di forte interesse istituzionale:
Punti di rigetto (potenziali inversioni)
Punti di continuazione del trend forte
Raccomandazione: Disattiva Esaurimento e Rallentamento per evitare di affollare il grafico.
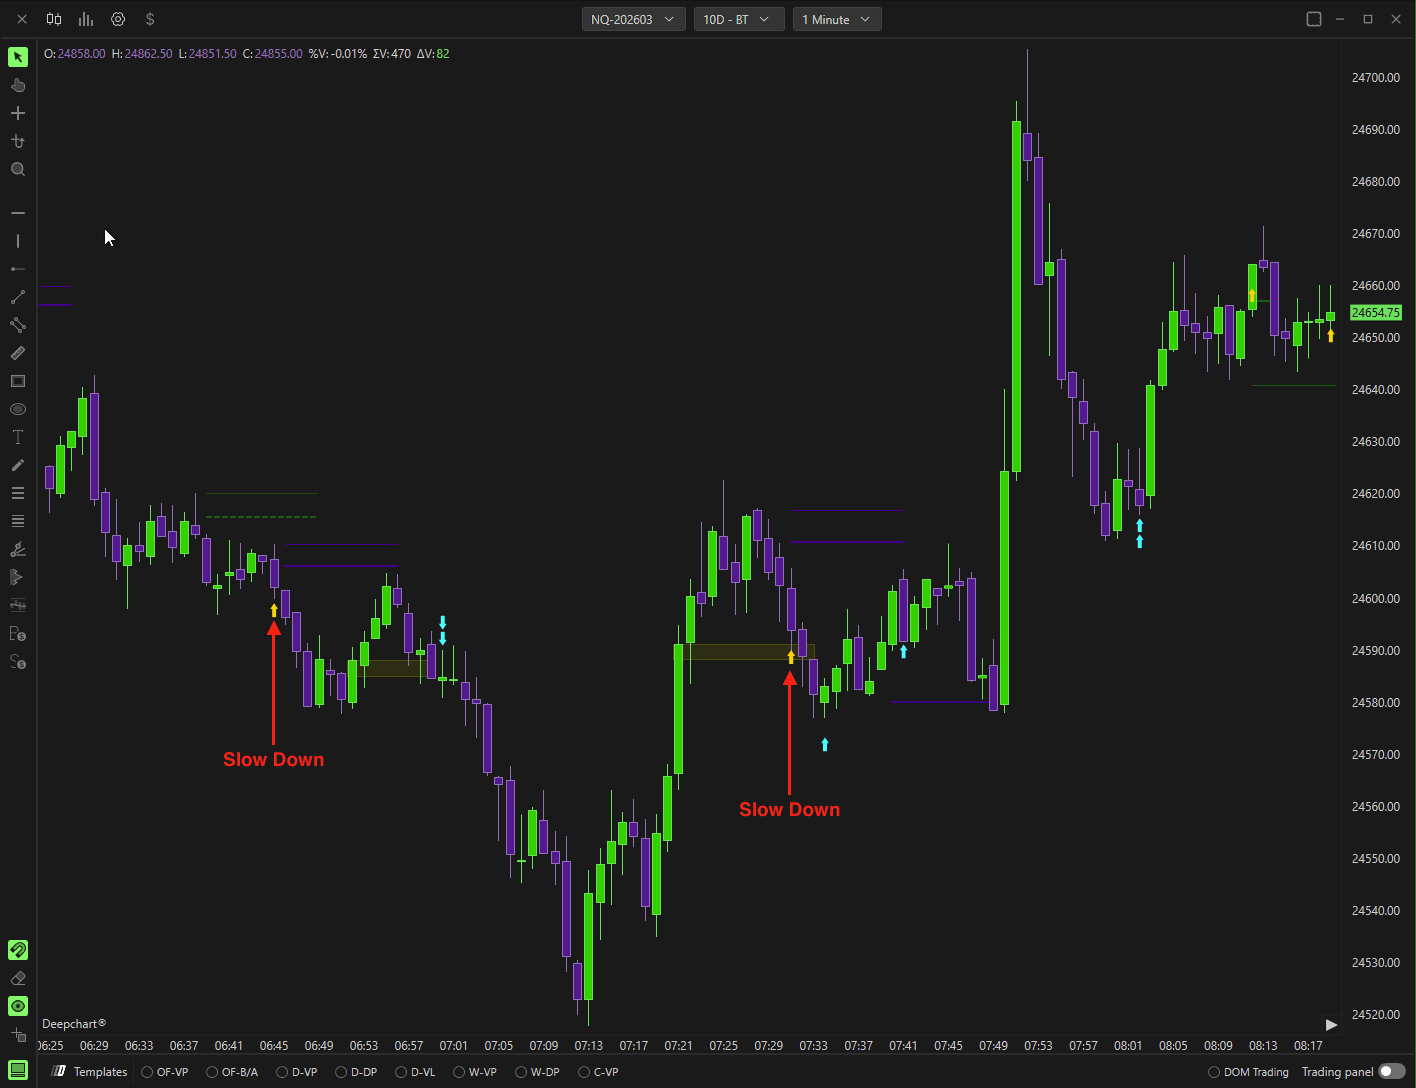
Rallentamento
Definizione: Mostra dove il movimento del prezzo decelera nella sua direzione attuale.
Caso d'uso: Utile per individuare possibili fasi di consolidamento o trend in indebolimento.
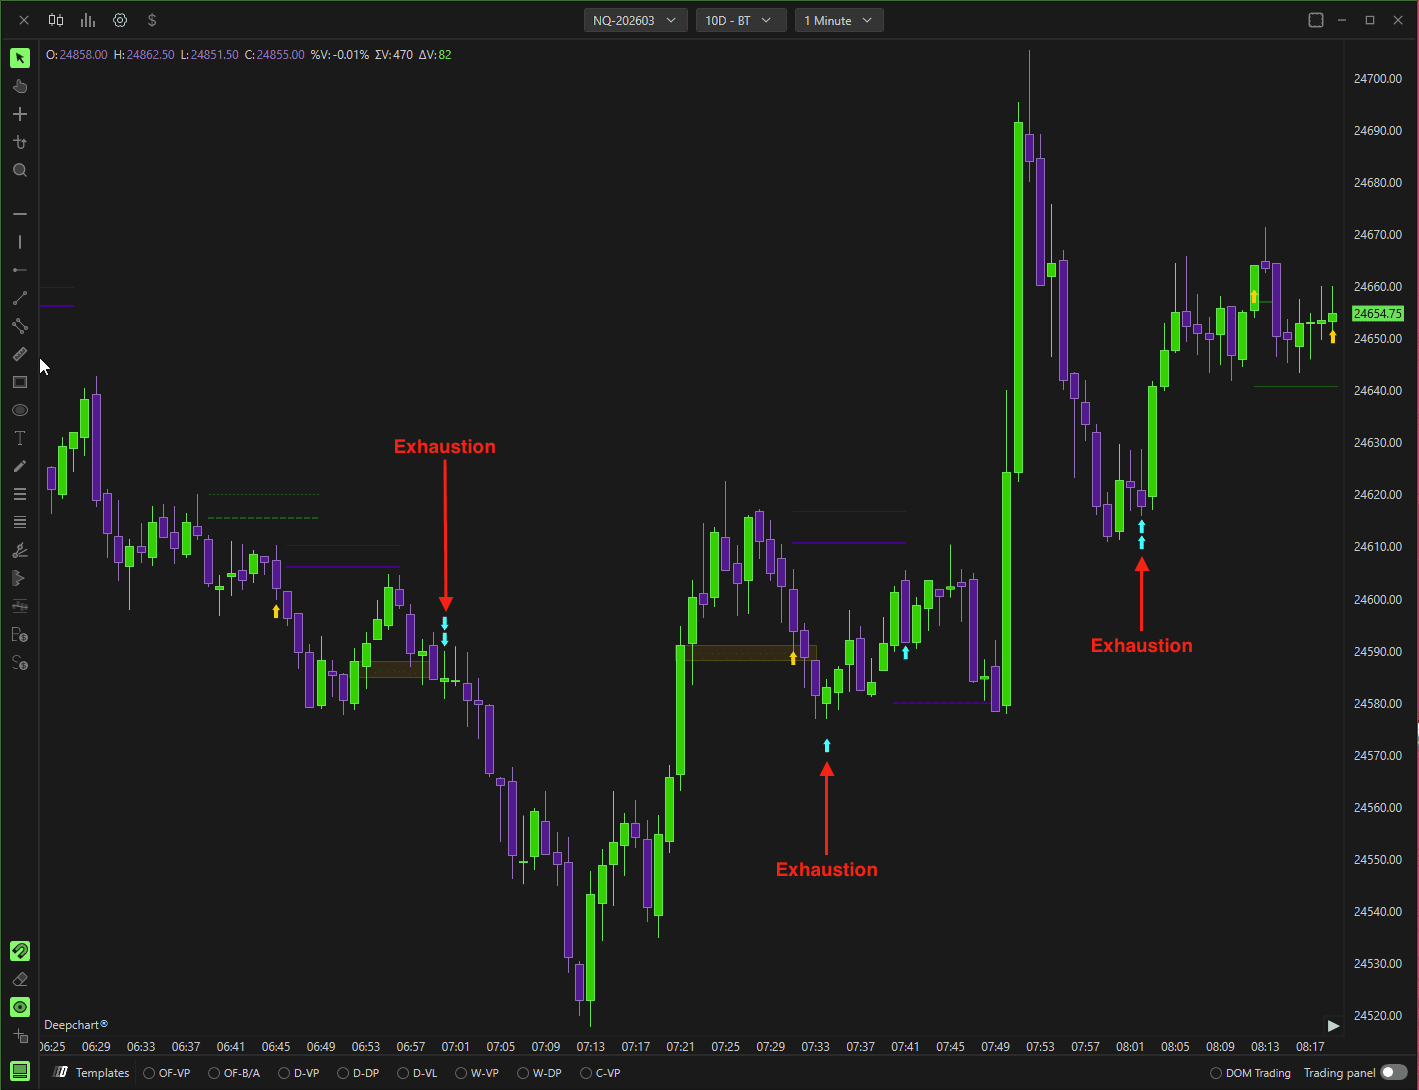
Esaurimento
Definizione: Si verifica quando i partecipanti aggressivi esauriscono la propria energia o gli ordini, lasciando poca pressione di acquisto o vendita per proseguire il movimento.
Interpretazione:
Esaurimento del trend rialzista: i compratori sono finiti → possibile inversione o ritracciamento.
Esaurimento del trend ribassista: i venditori sono finiti → possibile formazione di un minimo.
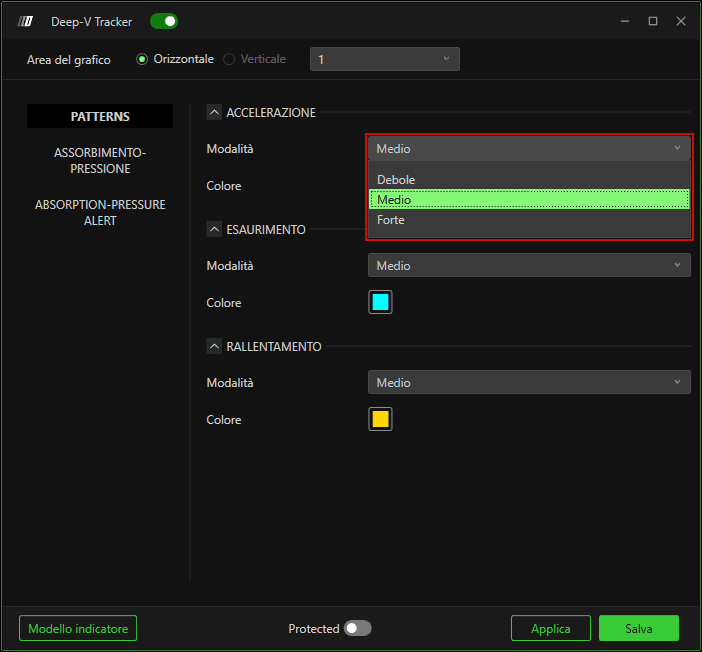
Modalità Pattern
Forte: filtra il rumore, mostra solo i livelli forti
Medio: rumore moderato, mostra livelli di forza media
Debole: più marker, rumore maggiore
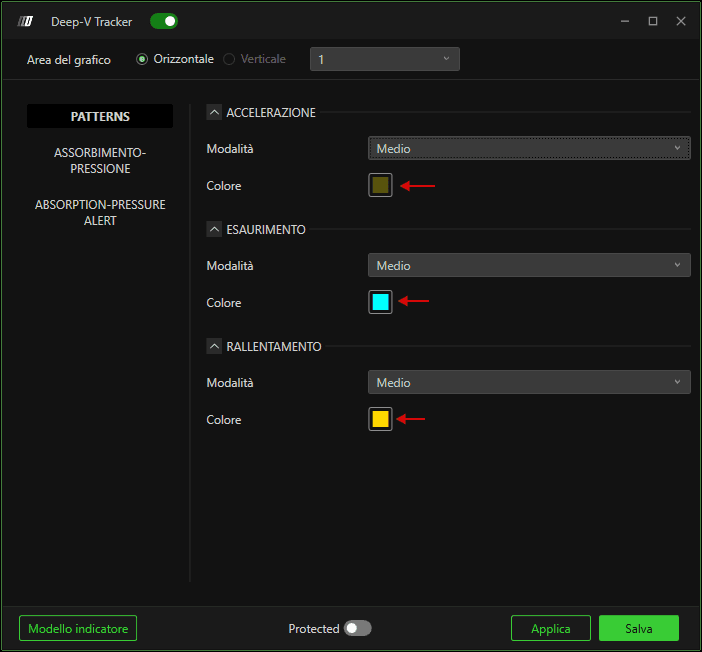
Colore: personalizza il colore del marker per ogni pattern
3. Modulo Absorption & Pressure
Questo modulo mette in evidenza le zone in cui compratori o venditori esercitano pressione tramite linee orizzontali.
Colore:
Viola: Attività sul BID (pressione dei venditori)
Verde: Attività sull'ASK (pressione dei compratori)
I colori sono completamente personalizzabili.
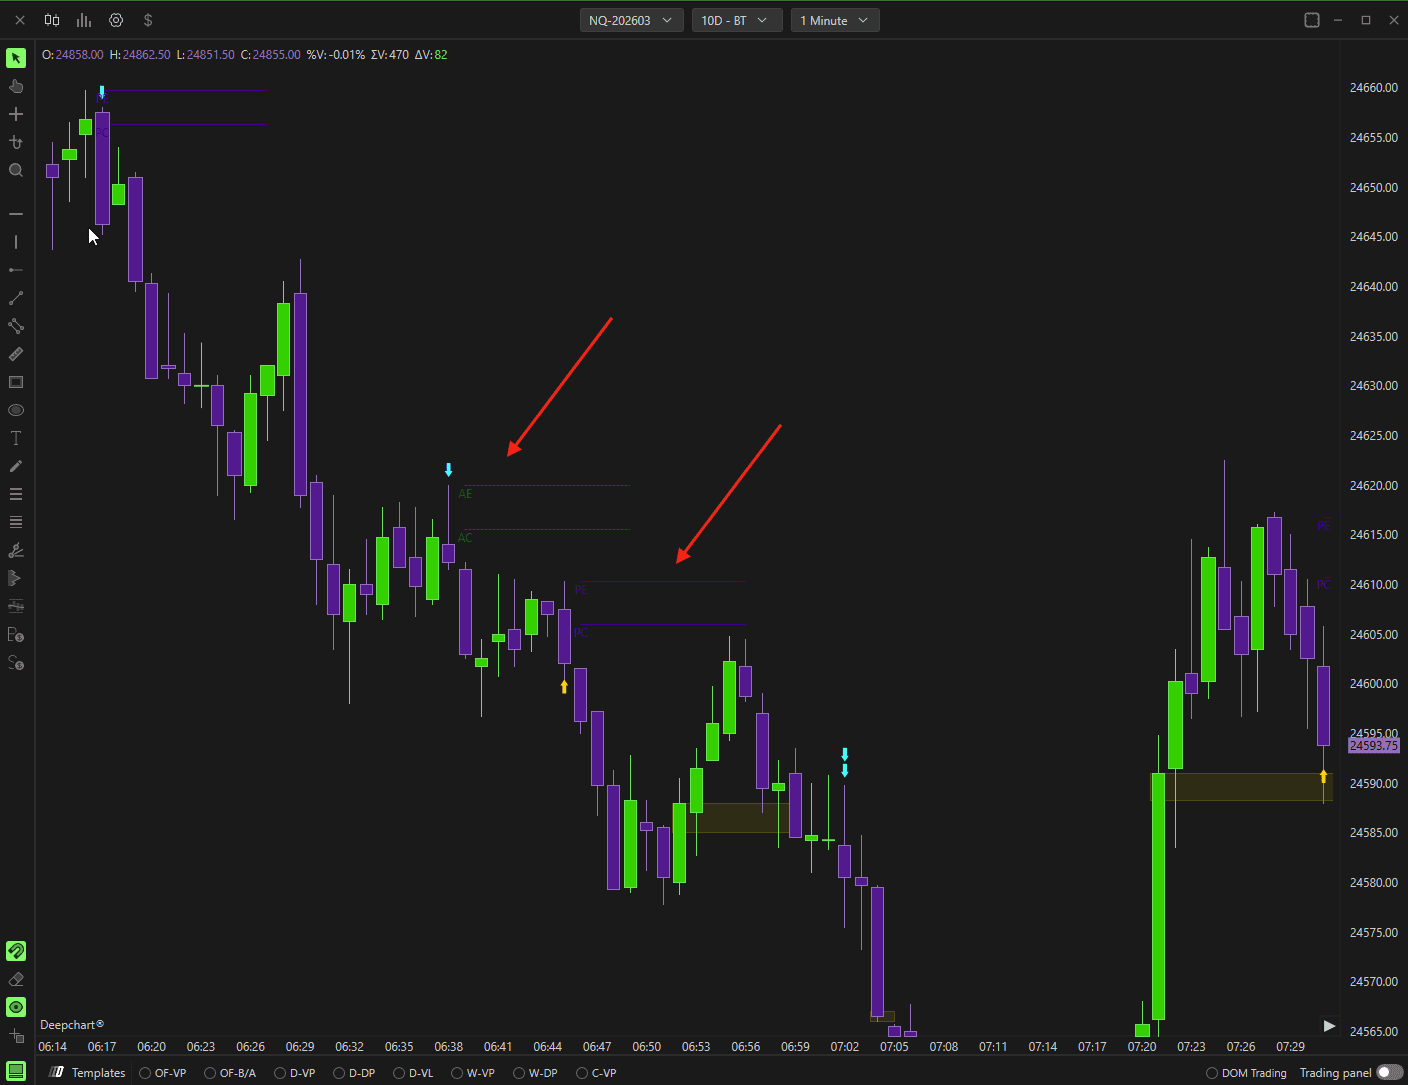
Etichette
P = Pressione: Indica zone attive in cui una controparte spinge il prezzo con forza.
P tratteggiata → forte pressione d'acquisto
P continua → forte pressione di vendita
A = Assorbimento: Zone in cui gli ordini aggressivi vengono bloccati da ordini passivi (ordini limite). Spesso segnala una possibile inversione o un rimbalzo.
Livelli di controllo (suffissi C ed E)
C = Controllo (PC / AC): livello chiave; aspettati una reazione del prezzo.
E = Estremo (PE / AE): limite massimo; una chiusura oltre invalida la zona.
Etichetta | Significato |
|---|---|
PC | Controllo Pressione – livello chiave di vendita |
PE | Estremo Pressione – livello di invalidazione |
AC | Controllo Assorbimento – livello chiave di assorbimento acquisti |
AE | Estremo Assorbimento – livello di invalidazione della zona di assorbimento |
Intensità
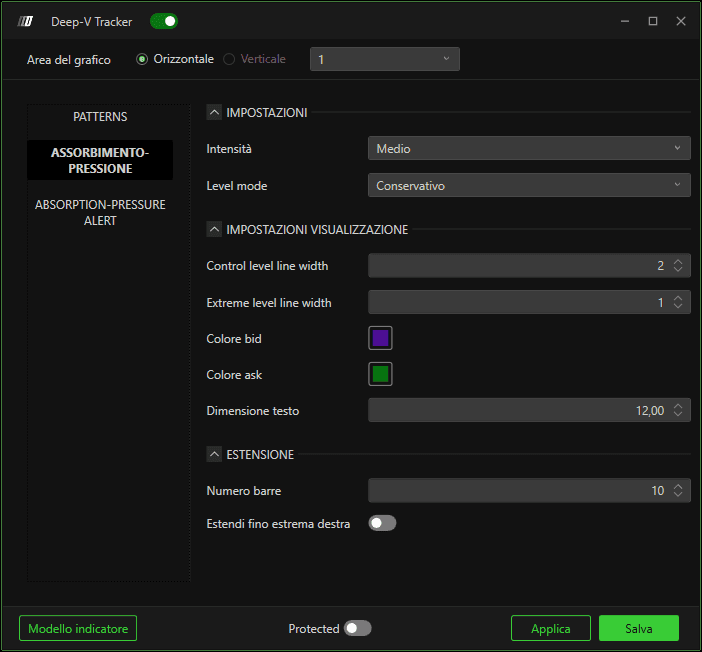
Forte: mostra solo i livelli più forti, rumore minimo
Medio: equilibrio tra visibilità e rumore
Debole: mostra più livelli, rumore maggiore
Modalità livello
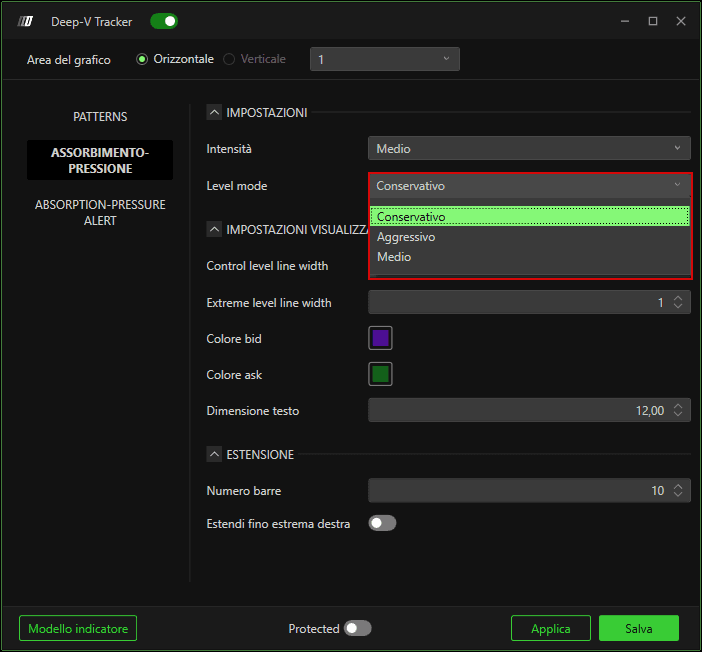
Conservativa: i livelli compaiono su zone strutturali solide
Media: approccio bilanciato
Aggressiva: può generare livelli vicini al prezzo, più facili da violare
Impostazioni aggiuntive:
Larghezza linea Controllo/Estremo: regola lo spessore delle linee
Colore Bid/Ask: personalizza i colori delle linee venditore/compratore
Dimensione testo: regola la dimensione dell'etichetta
Numero di barre: definisce la lunghezza della linea in barre
Estendi fino a destra: estende le linee fino alla scala dei prezzi del grafico
4. Avvisi Absorption / Pressure

Puoi impostare avvisi per qualsiasi pattern, evento di assorbimento o pressione:
Vai su Opzioni → Impostazioni → Aggiungi avviso
Crea un nuovo avviso
L'avviso apparirà nell'elenco di Deep V-Tracker quando viene attivato
Conclusione
Il Deep V-Tracker offre ai trader informazioni operative combinando pattern di price action e analisi volumetrica del flusso degli ordini. I vantaggi principali includono:
Identificazione di improvvise accelerazioni nel flusso degli ordini
Rilevazione di potenziali punti di esaurimento o rallentamento
Mappatura delle zone di pressione e assorbimento con livelli di controllo ed estremi
Impostazioni visive e di alert completamente personalizzabili
Padroneggiando i moduli Patterns e Absorption & Pressure, i trader possono individuare l'attività istituzionale e livelli ad alta probabilità per ingressi e uscite.