Indicatori
Updated:
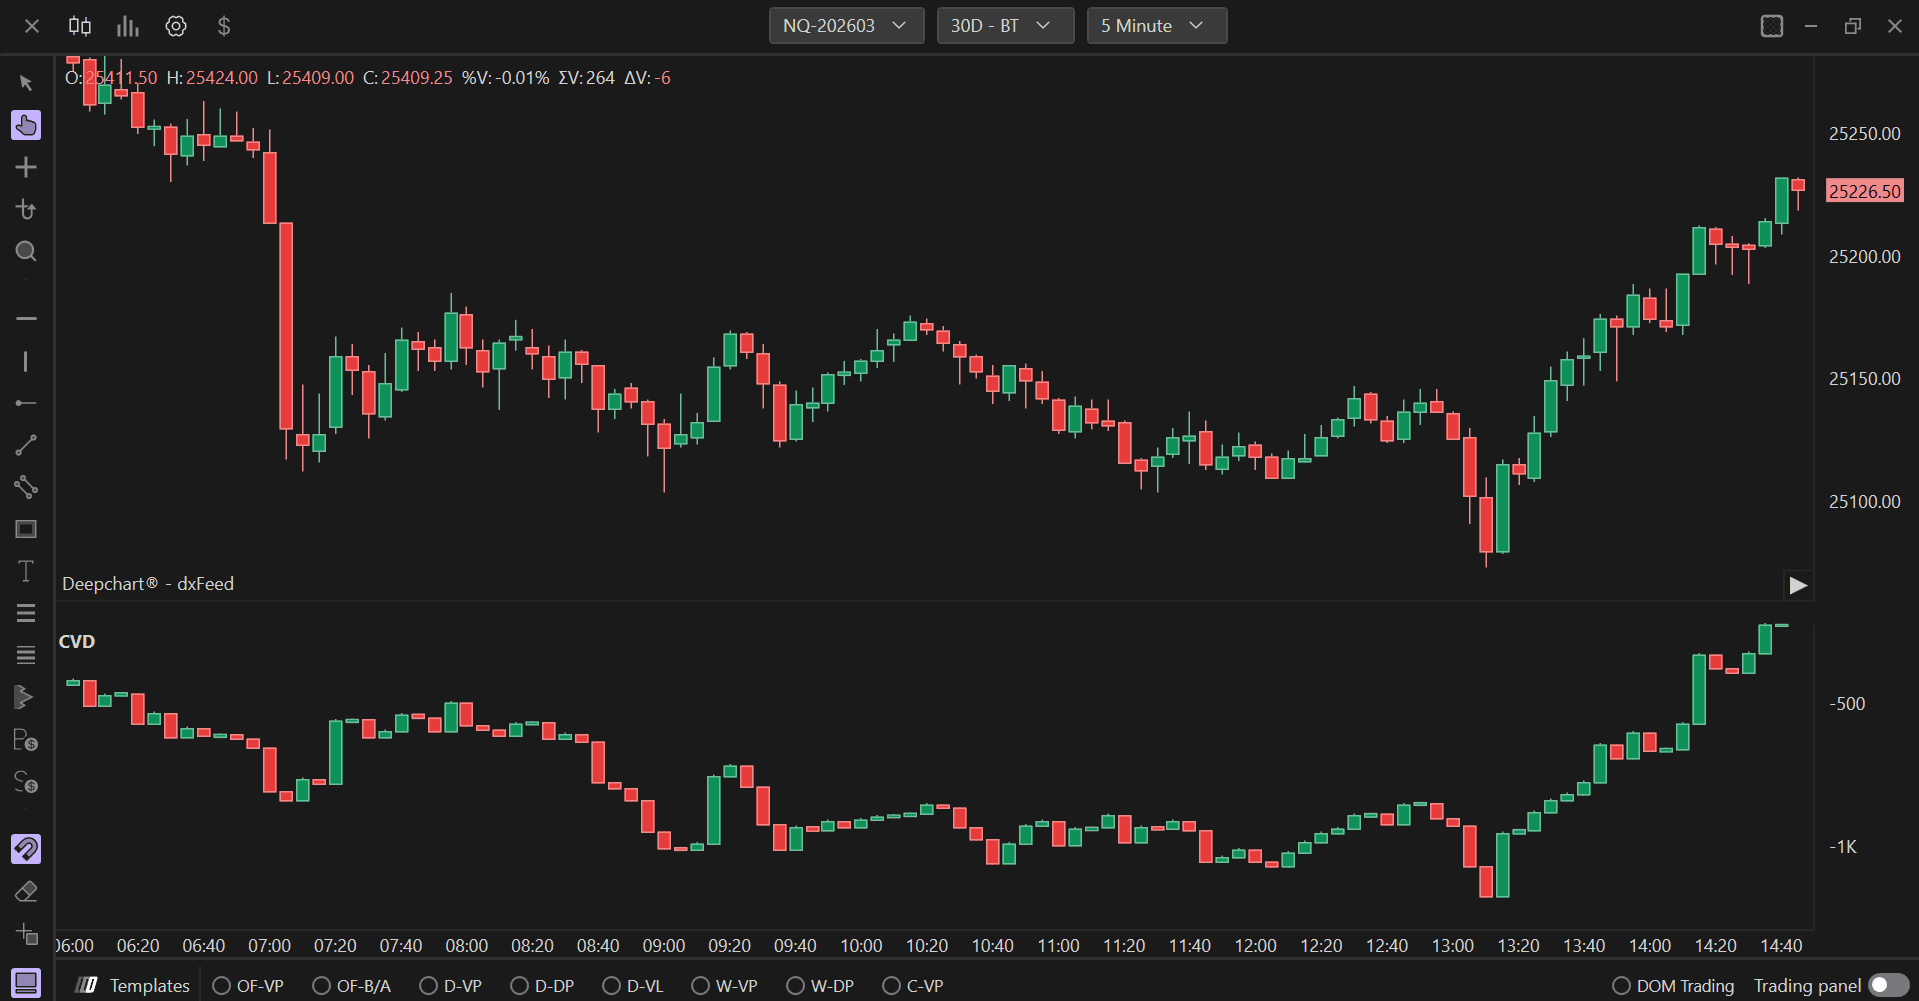
L’indicatore Delta Cumulative Candlestick consente di visualizzare, tramite candele nella parte inferiore del grafico, la somma cumulativa del delta di ciascuna candela, vale a dire la differenza tra vendite a mercato e acquisti a mercato. Ciò consente agli utenti di identificare quale lato del mercato è più aggressivo. La visualizzazione a candela può rendere più facile per alcuni utenti individuare divergenze tra delta cumulativo e prezzo.
Utilizzo delle impostazioni
Facendo clic sull'icona delle impostazioni dell'indicatore si aprirà la relativa finestra di configurazione, all'interno della quale è possibile effettuare diverse scelte relative alla funzionalità dell'indicatore stesso.
Parametri (Generali)
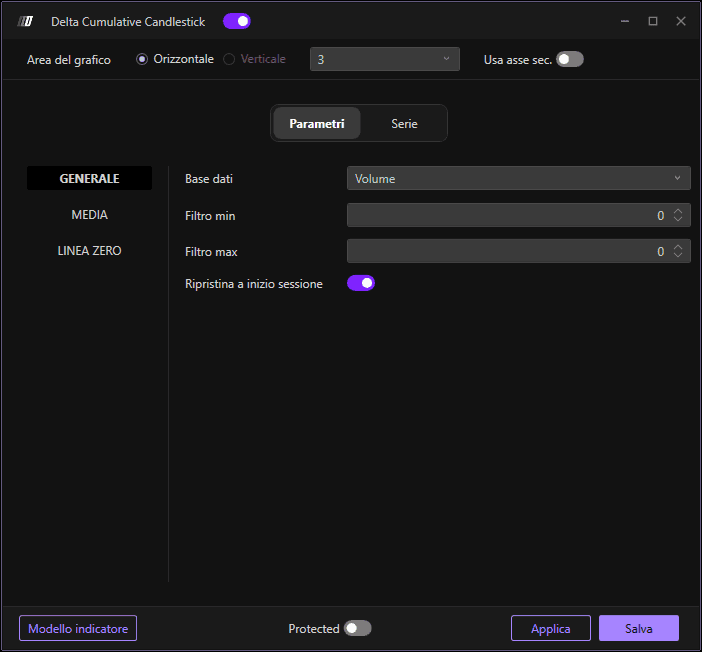
Dati di input
Definisce quale database utilizzare per calcolare l'indicatore. Puoi scegliere tra:
Volumi: Indicano la quantità di contratti/azioni negoziati. Questa opzione è utile per comprendere l'intensità dell'attività di trading e l'importo totale movimentato dai trader.
Ordine: Considera i dati degli ordini, come la quantità di ordini di acquisto e di vendita a ciascun livello di prezzo. Questa opzione è utile per valutare la pressione degli ordini e analizzare il comportamento degli operatori di mercato
Trade aggregati: Indicano il numero di esecuzioni o transazioni effettuate. Questa opzione è utile per comprendere con quale frequenza lo strumento viene negoziato.
In altre parole, i Trade indicano quanto spesso uno strumento finanziario viene negoziato, mentre i Volumi indicano quanto dello strumento finanziario viene negoziato.
Ad esempio, un aumento nel numero di Trade senza un corrispondente aumento dei Volumi indica che c'è un'attività frequente ma su importi ridotti. Al contrario, un aumento dei Volumi senza un corrispondente aumento del numero di Trade indica che pochi trader stanno movimentando grandi quantità.
Filtro Min
Consente di applicare un filtro minimo all'indicatore. Verranno visualizzati solo i valori del delta cumulativo superiori a questa soglia.
Filtro Max
Consente di applicare un filtro massimo all'indicatore. Se si lascia il valore 0, l'indicatore non applicherà alcun filtro massimo. Impostare un valore specifico per escludere il delta cumulativo che supera questa soglia.
Reimposta all'inizio della sessione
Se abilitato, consente di riavviare il calcolo del delta cumulativo all'inizio di ogni sessione di trading. Questo è utile per analizzare il comportamento del delta all'interno delle singole sessioni.
Media
Consente di inserire una media mobile nell'indicatore. Questo smussa la linea del delta cumulativo e può aiutare a individuare più chiaramente i trend.
Linea dello zero
Consente di abilitare la linea dello zero, che è la linea di demarcazione tra un delta cumulativo positivo (maggiore aggressività in acquisto) e un delta cumulativo negativo (maggiore aggressività in vendita).
Sottografici
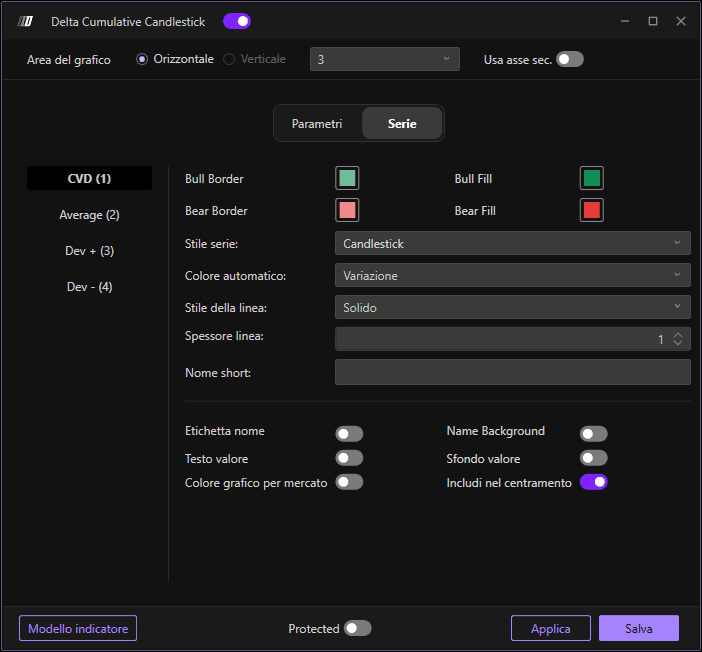
In questa sezione è possibile definire l'aspetto visivo dell'indicatore a candele del delta cumulativo:
Impostazioni Delta Cumulativo
Colori: Definiscono la combinazione di colori per le candele del delta cumulativo (in genere colori diversi per delta positivo e negativo)
Stile del sottografico: Scegli tra diversi stili di visualizzazione:
Candlestick: Mostra il delta cumulativo come barre a candela
OHLC: Mostra nel formato Open, High, Low, Close
CandleBody: Mostra solo il corpo della candela senza le ombre
Larghezza linea: Regola la larghezza/spessore delle candele per una migliore visibilità
Media
Colore: Definisce il colore della linea della media mobile
Stile linea: Scegli lo stile della linea per la media mobile
Larghezza linea: Regola la larghezza della linea della media mobile
Deviazioni: Abilita le deviazioni standard dalla media mobile per mostrare le bande di volatilità