Indicatori
Updated:
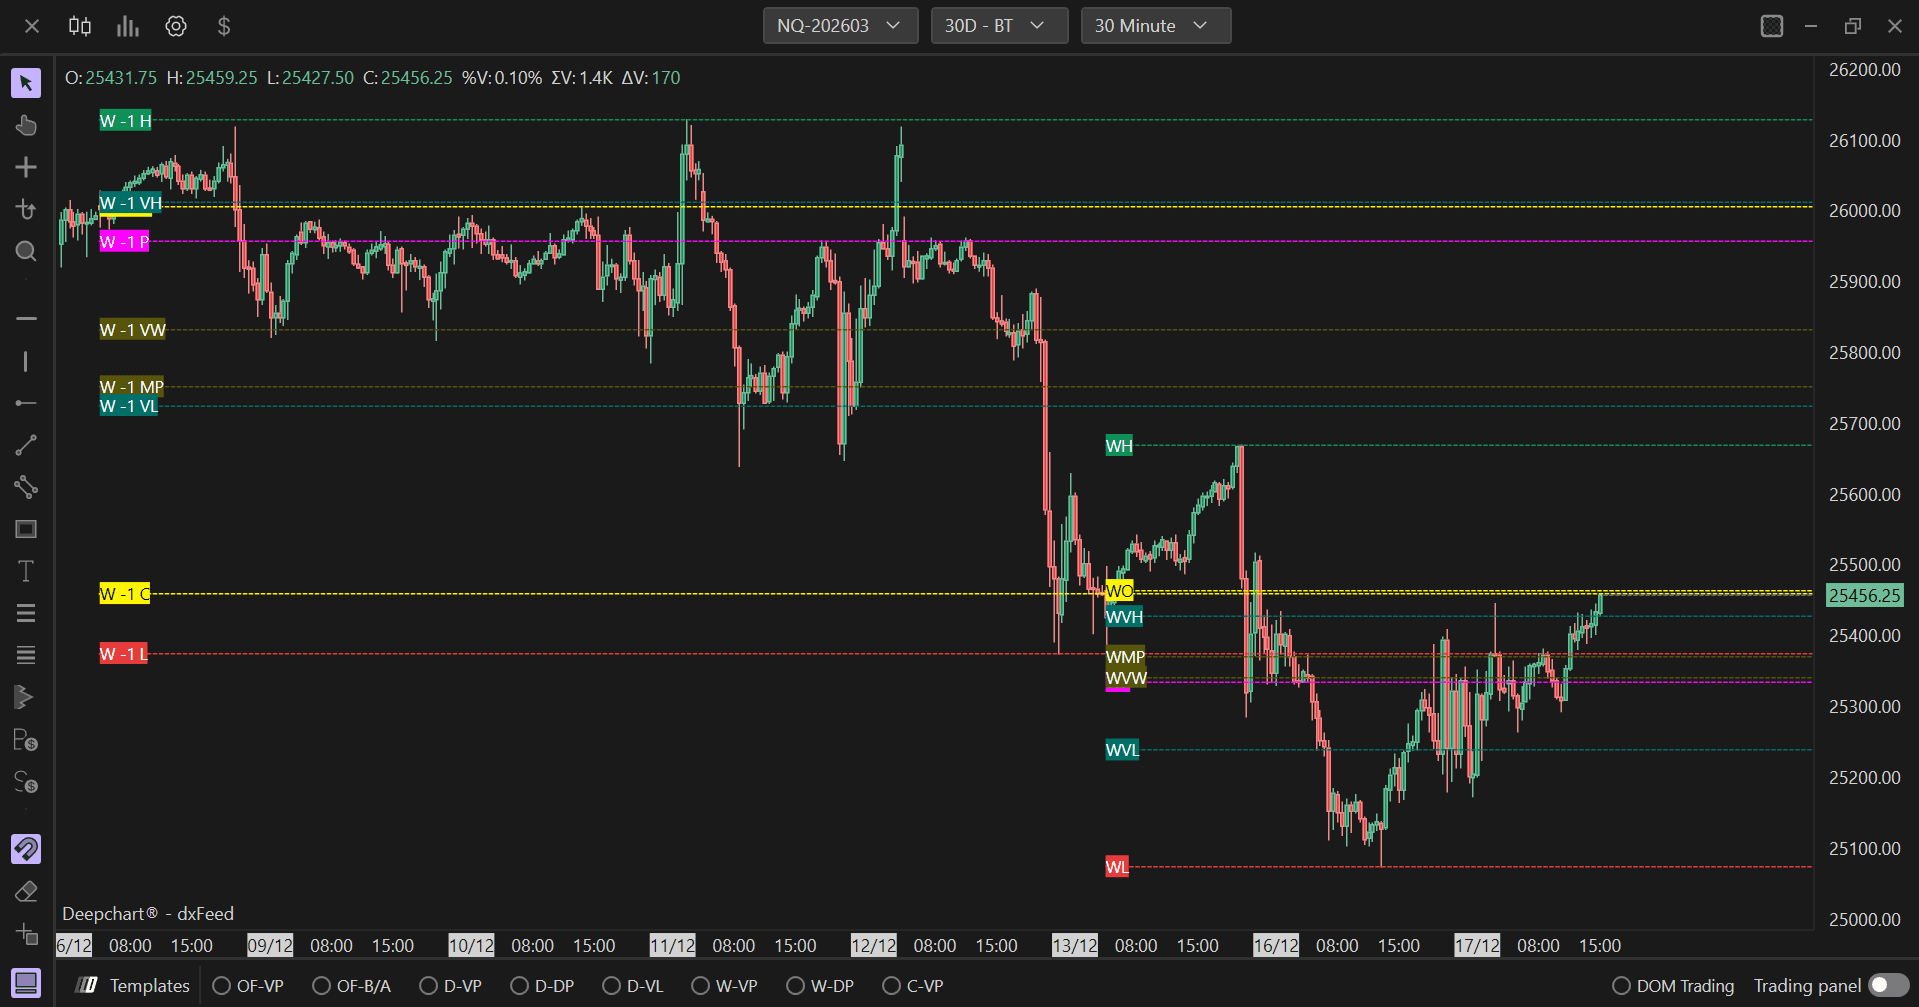
L’Indicatore Important Levels ti permette di evidenziare i livelli di prezzo più importanti su base giornaliera, settimanale e mensile. Questo indicatore è particolarmente utile nei grafici intraday, in quanto consente all’utente di avere sempre ben visibili sul grafico i massimi, i minimi, i prezzi di apertura e chiusura, i POC, le aree di valore, i VWAP e i valori medi dei periodi abilitati.
Utilizzo delle impostazioni
Facendo clic sull’icona delle impostazioni dell’indicatore si aprirà la sua finestra di configurazione, all’interno della quale potrai effettuare diverse scelte relative alla funzionalità dell’indicatore stesso.
Impostazioni della lunghezza
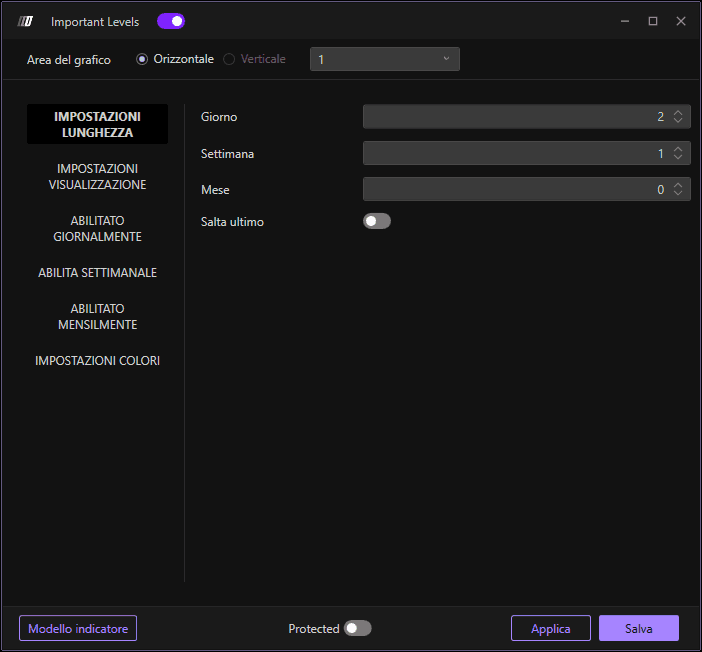
In questa sezione potrai impostare il numero di giorni, settimane e mesi che desideri evidenziare:
Giorni: Definisci quanti livelli dei giorni precedenti mostrare
Settimane: Definisci quanti livelli delle settimane precedenti mostrare
Mesi: Definisci quanti livelli dei mesi precedenti mostrare
Salta ultimo: Se abilitato, l’indicatore non evidenzierà i valori importanti del giorno, della settimana e del mese correnti
Impostazioni del plot
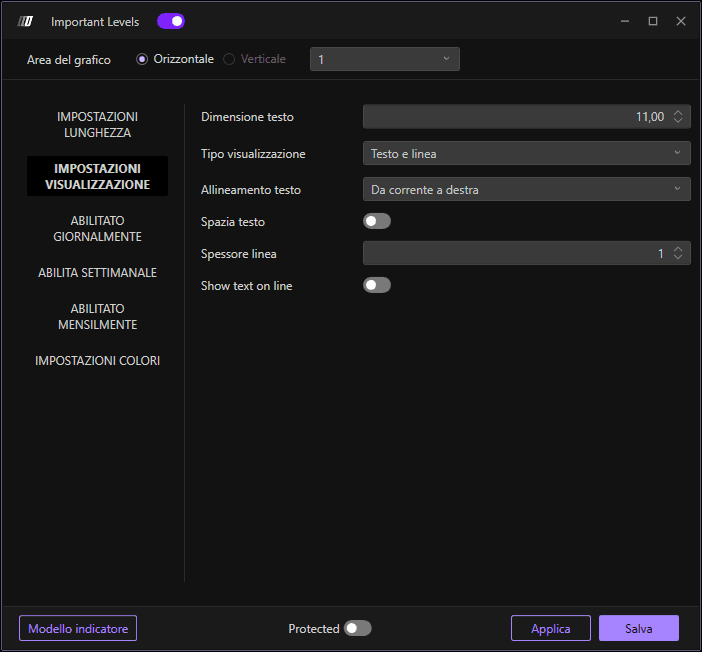
Dimensione del font
Consente di modificare la dimensione del testo delle varie etichette riportate dall’indicatore.
Tipo di plot
Consente di definire il tipo di visualizzazione dei livelli importanti, potendo scegliere tra:
Etichetta: Visualizza solo le etichette testuali dei livelli
Linea: Visualizza solo le linee orizzontali dei livelli
Etichetta e linea: Visualizza sia le etichette testuali sia le linee orizzontali
Allineamento testo
Consente di stabilire dove visualizzare il testo sul grafico:
Sinistra: Visualizza le etichette sul lato sinistro del grafico
Destra: Visualizza le etichette sul lato destro del grafico
Dalla posizione corrente a destra: Visualizza le etichette dalla posizione corrente verso destra
Dalla posizione corrente all’ultimo: Visualizza le etichette dalla posizione corrente fino all’ultimo livello visibile
Livelli giornalieri/settimanali/mensili abilitati
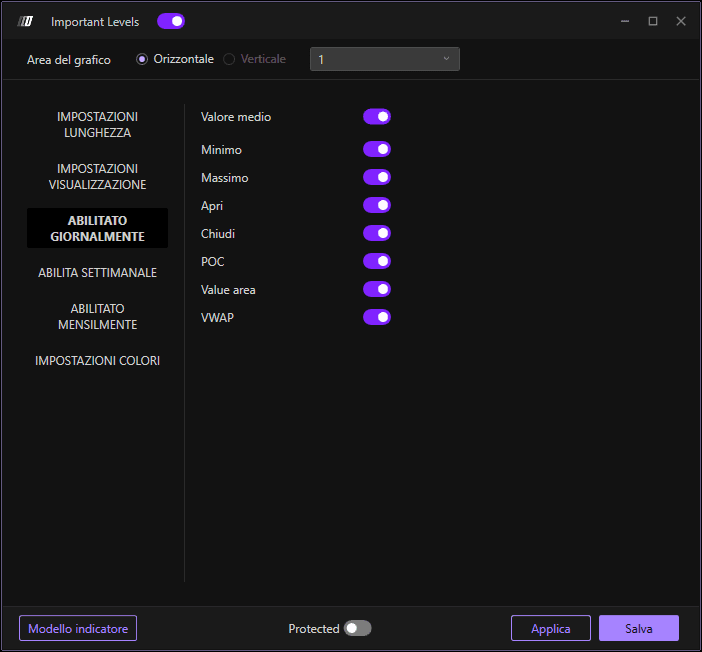
Abilita i valori importanti di interesse per l’utente. Per ogni periodo (giornaliero, settimanale, mensile), puoi scegliere di mostrare o nascondere i seguenti livelli:
Valore medio: Il prezzo medio del periodo
Minimo: Il prezzo più basso durante il periodo
Massimo: Il prezzo più alto durante il periodo
Open: Il prezzo di apertura del periodo
Close: Il prezzo di chiusura del periodo
POC (Point of Control): Il livello di prezzo con il volume di trading più elevato
Area di valore: L’intervallo di prezzo che contiene una specifica percentuale del volume di trading totale
VWAP: Prezzo medio ponderato per il volume del periodo
Impostazioni dei colori
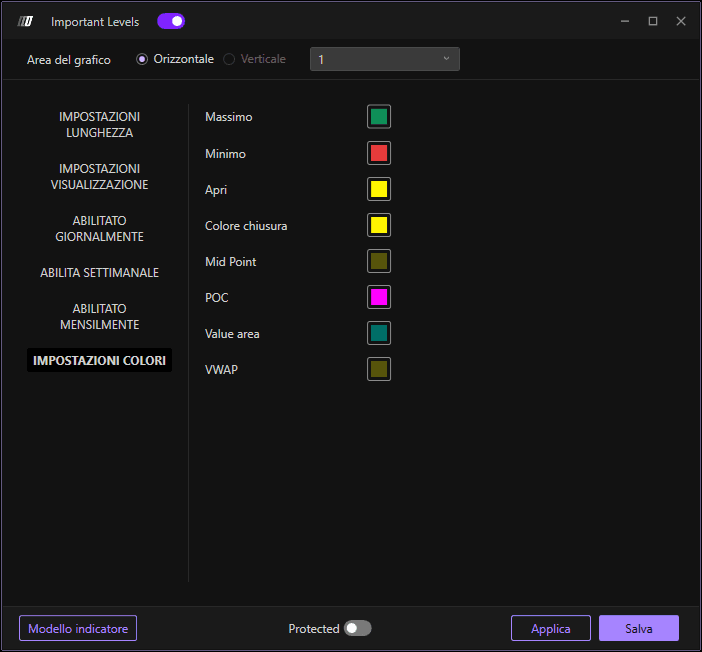
Consente di modificare i colori dei vari valori importanti visualizzati. Puoi personalizzare i colori di:
Minimo: Colore per il prezzo minimo
Massimo: Colore per il prezzo massimo
Open: Colore per il prezzo di apertura
Close: Colore per il prezzo di chiusura
Punto medio: Colore per il punto medio
POC: Colore per il Point of Control
Area di valore: Colore per l’area di valore
VWAP : Colore per il VWAP
Suggerimento: Se vuoi differenziare i colori tra i valori importanti giornalieri, settimanali e mensili, puoi inserire più indicatori Important Levels — ad esempio, uno con soli valori giornalieri e uno con soli valori settimanali — e differenziarne i colori.