Indicatori
Updated:
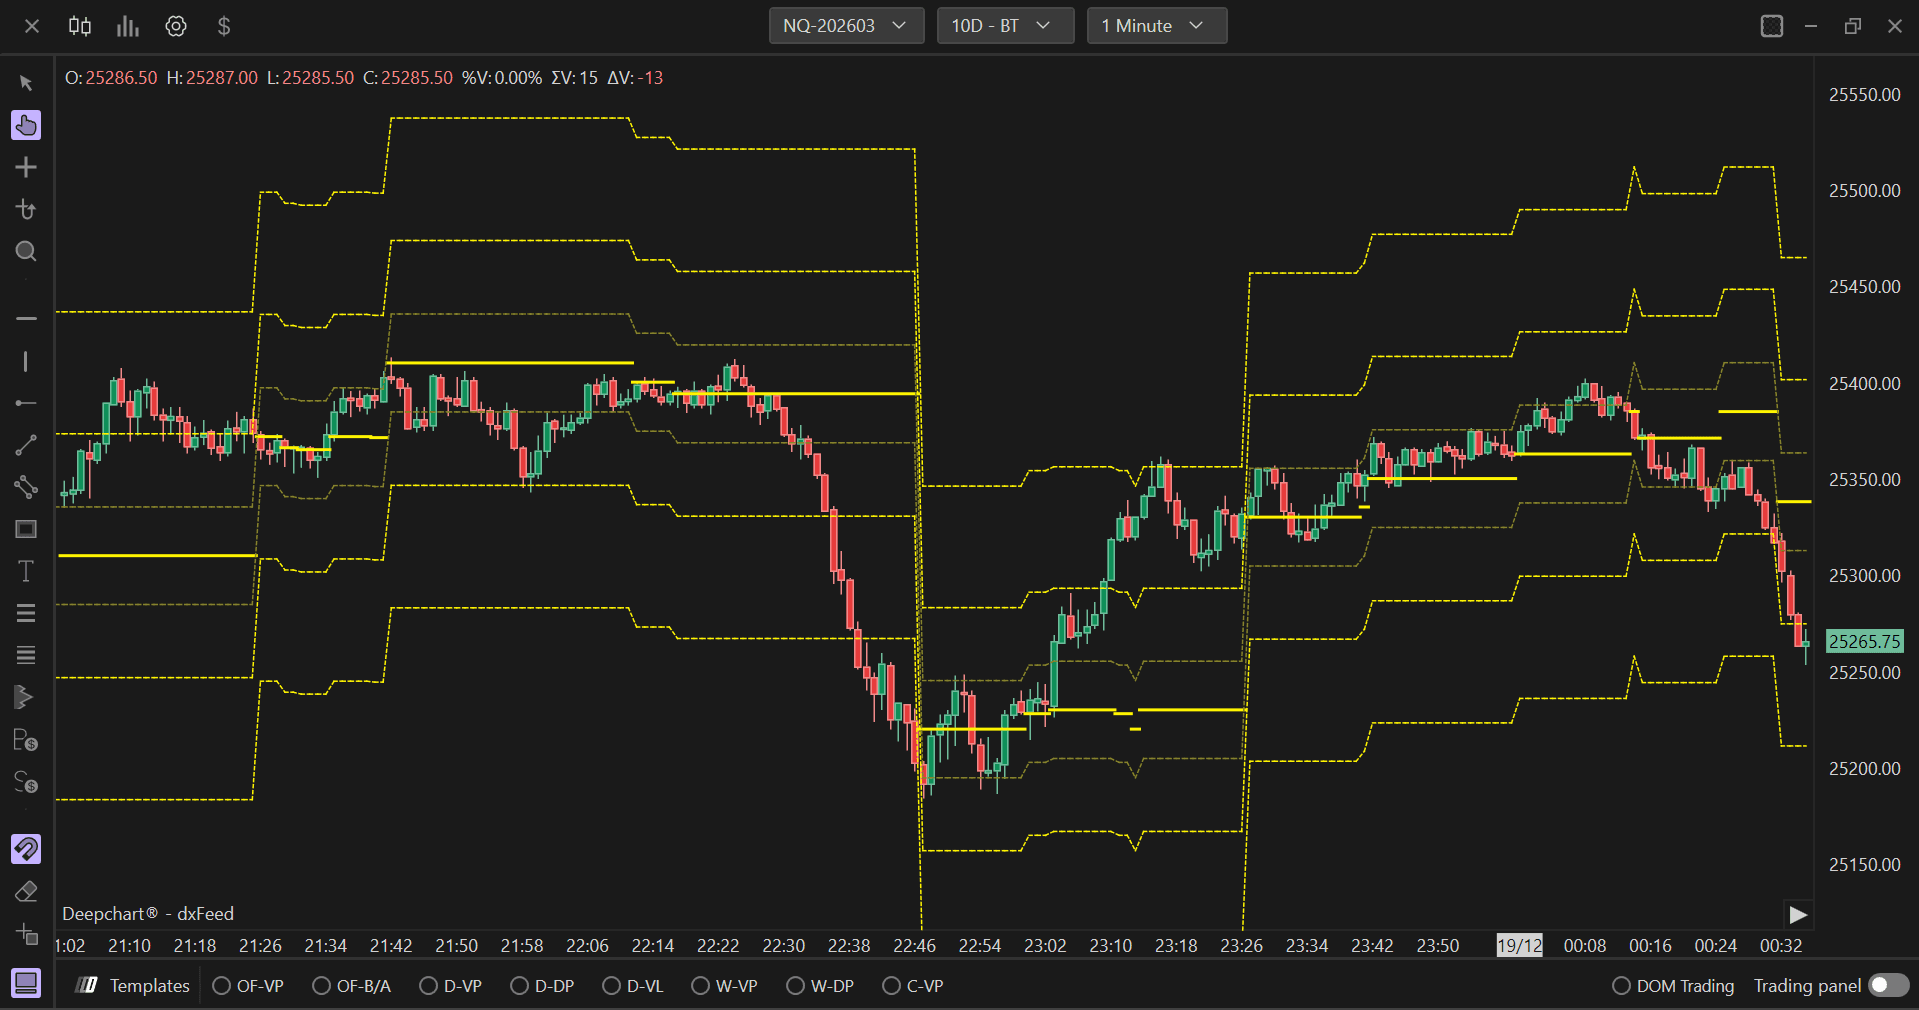
L'indicatore Dynamic POC consente di visualizzare il Point of Control (POC), ovvero il livello di prezzo in cui si è sviluppato il maggiore volume, degli ultimi n minuti o barre. Consente inoltre di visualizzare le deviazioni standard dal POC, offrendo una rappresentazione dinamica dell'attività volumetrica in un periodo di tempo configurabile.
Utilizzo delle impostazioni
Facendo clic sull'icona delle impostazioni dell'indicatore si aprirà la sua finestra di configurazione, all'interno della quale potrai effettuare diverse scelte relative alla funzionalità dell'indicatore stesso.
Generale
Modalità periodo
Consente di definire il periodo di riferimento per il calcolo dell'indicatore. Puoi scegliere tra:
Minuti: Mostra il POC degli ultimi n minuti. Utile per i trader intraday che analizzano pattern volumetrici di breve termine.
Barre: Mostra il POC delle ultime n barre. Utile per i trader che desiderano analizzare il POC in base al numero di candele anziché al tempo.
Valore periodo
Definisce il valore del periodo indicato nell'impostazione Modalità periodo. Ad esempio, se Modalità periodo è impostata su Minuti e Valore periodo è 120, l'indicatore visualizzerà il POC degli ultimi 120 minuti.
Proiezioni
In questa sezione puoi definire i parametri per il calcolo delle proiezioni percentuali attorno al POC. Queste proiezioni mostrano bande di volatilità come deviazione percentuale sopra e sotto il POC, aiutando a identificare condizioni di ipercomprato e ipervenduto:
% Primo: Definisce la deviazione percentuale per la prima banda della proiezione. Crea la banda iniziale attorno al POC. Il valore predefinito è in genere 0,10 (10%).
% Secondo: Definisce la deviazione percentuale per la seconda banda dela proiezione , creando una banda più ampia attorno alla prima. Il valore predefinito è in genere 0,25 (25%).
% Terzo: Definisce la deviazione percentuale per la terza banda della proiezione, creando la banda più esterna. Il valore predefinito è in genere 0,50 (50%).
Esempio: Se il POC è a prezzo 5900 e % Primo è 0,10, le prime bande della proiezione verrà tracciata approssimativamente a 5890 (inferiore) e 5910 (superiore). Questi valori percentuali vengono applicati al livello di prezzo del POC per creare la distanza della proiezione.
Sottografici
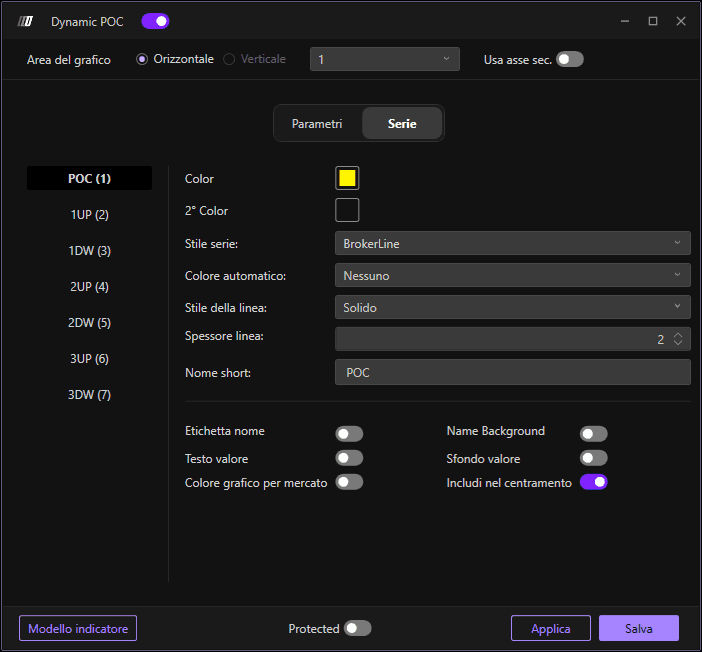
In questa sezione puoi modificare il colore e lo spessore delle linee del POC e della proiezione :
Colore POC: Definisci il colore della linea principale del POC
Colore secondario: Definisci un colore secondario opzionale
Stile sottografico: Scegli lo stile della linea
Spessore linea: Regola la larghezza delle linee del POC e della proiezione
Stile linea: Definisci lo stile della linea
Nome breve: Personalizza un nome breve per l'indicatore