Indicatori
Updated:
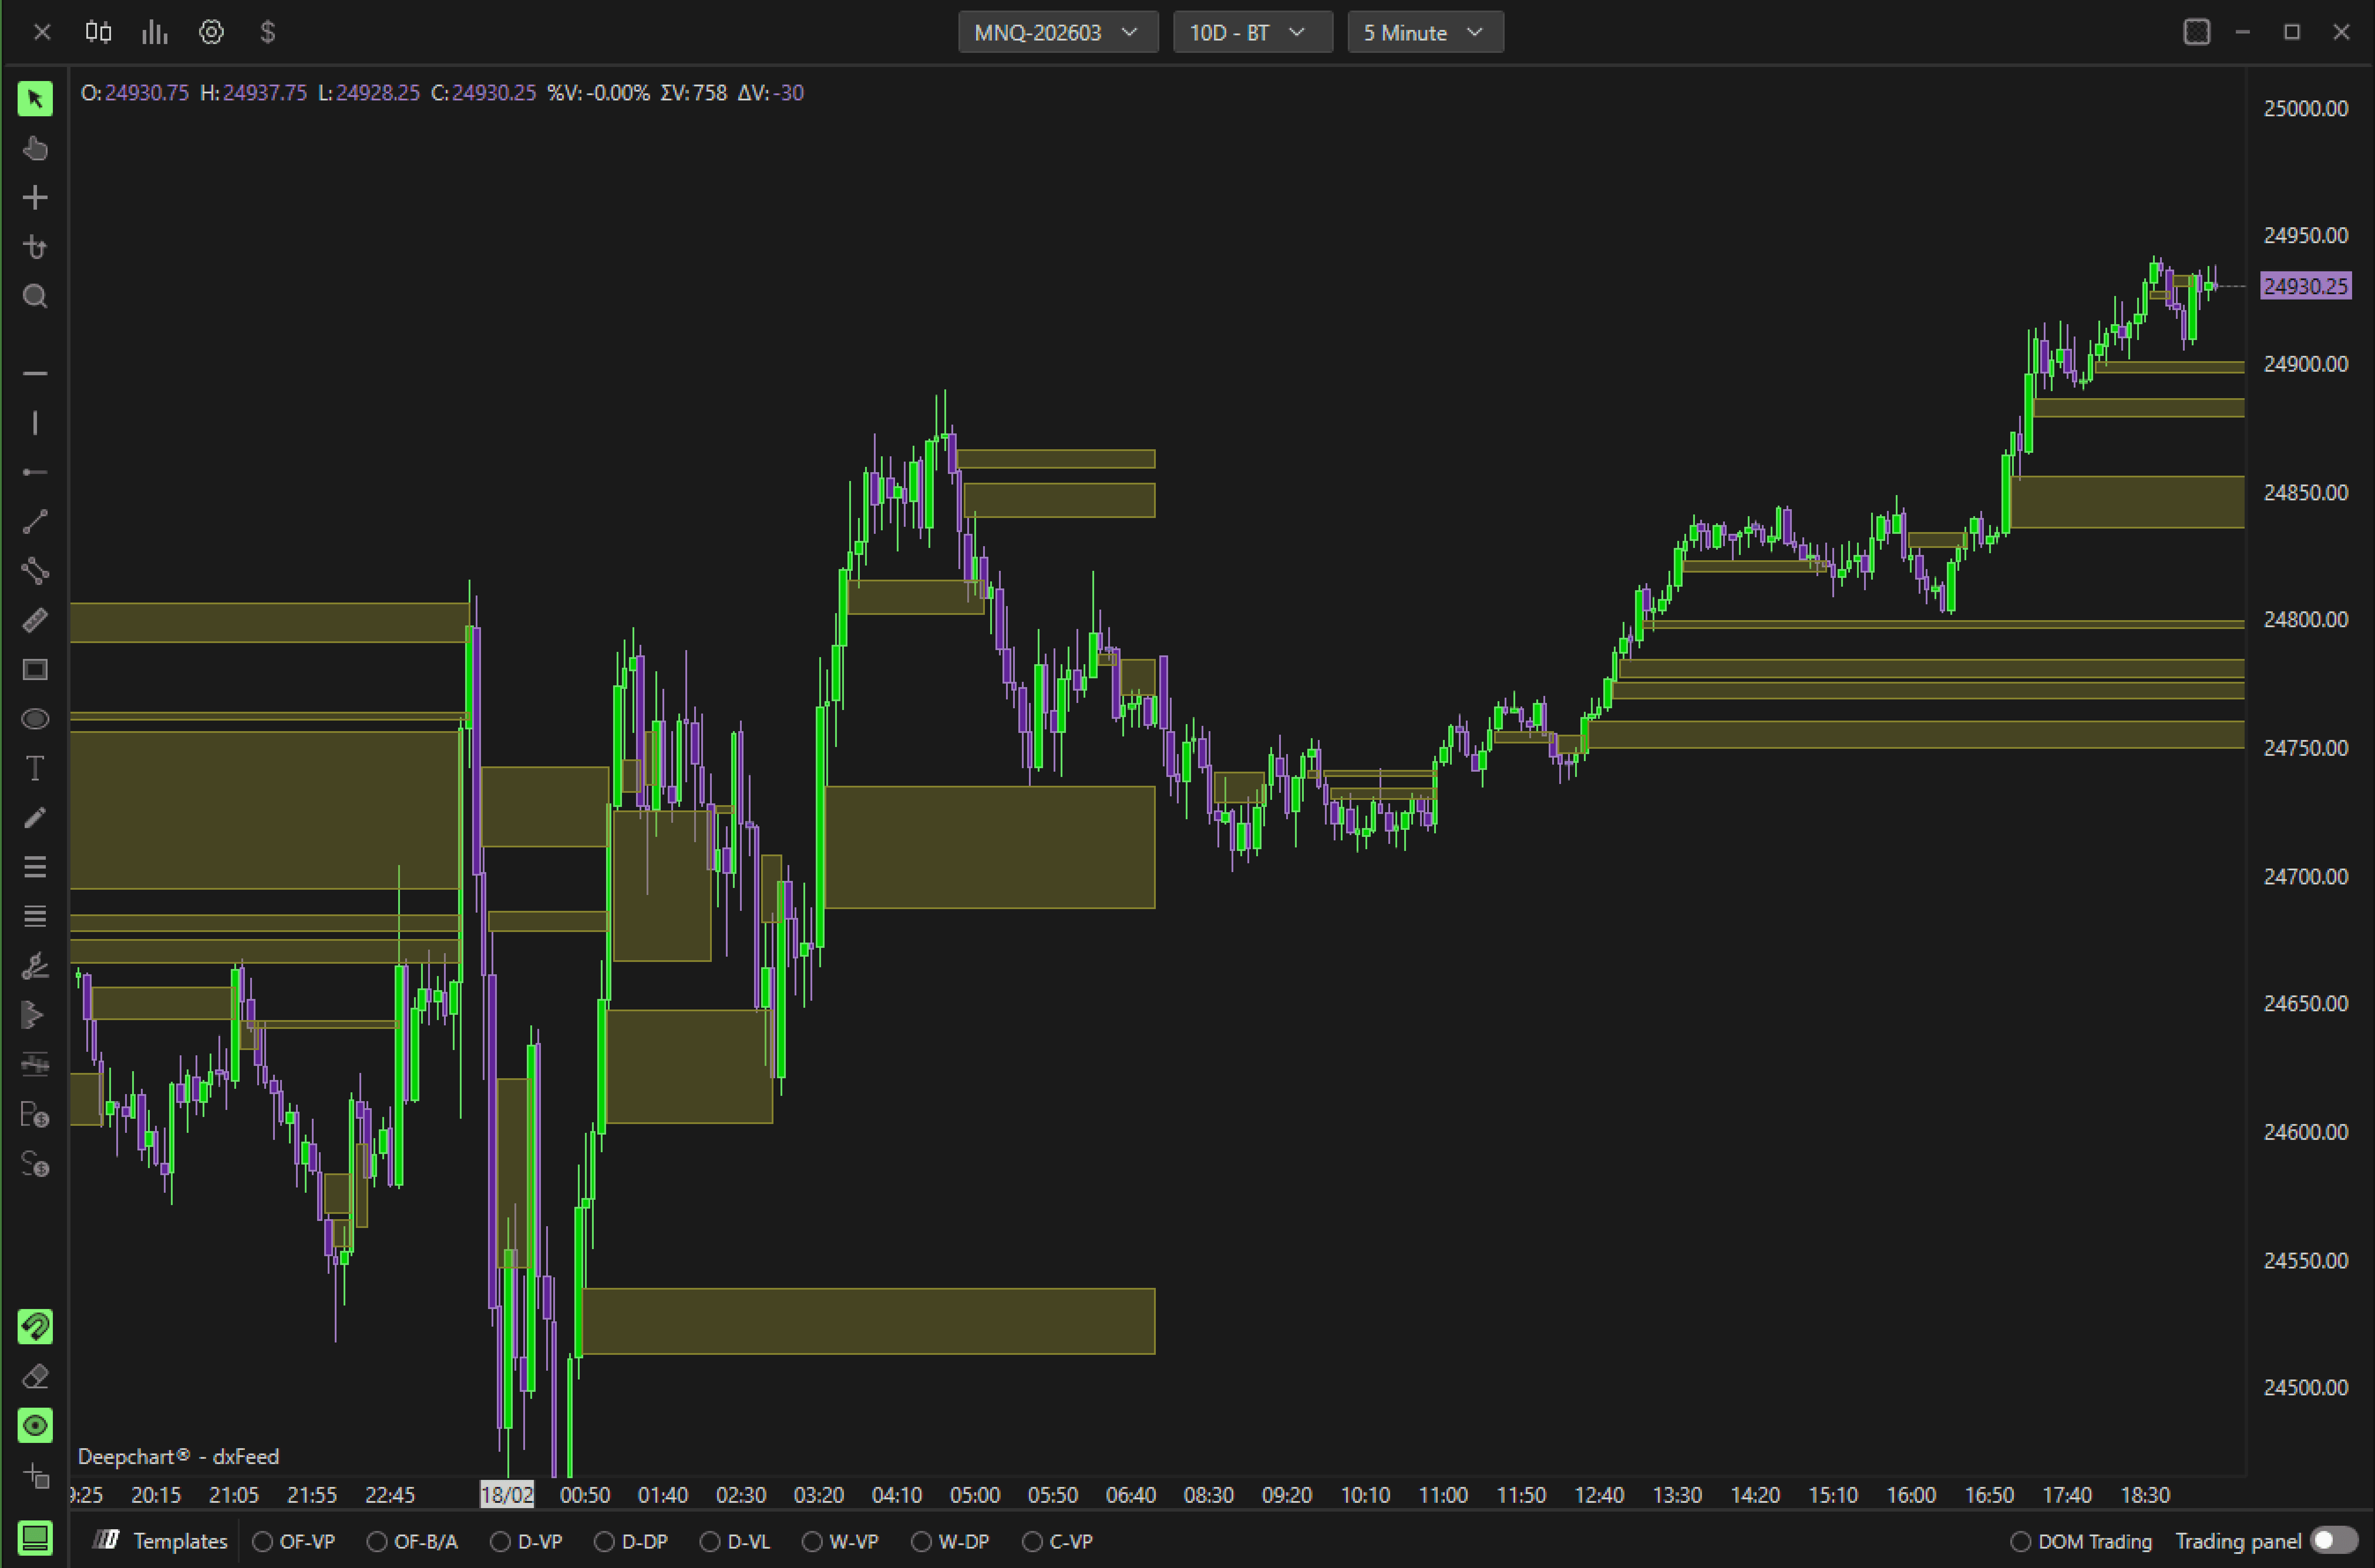
Un Fair Value Gap si forma quando il prezzo si muove in modo aggressivo, lasciando uno squilibrio tra le candele.
Queste aree spesso fungono da future zone di reazione o mitigazione.
Impostazioni
Generale
Orizzontale – Disegna evidenziazioni direttamente sul grafico dei prezzi.
Verticale – Visualizza in verticale (se supportato).
Selettore pannello – Seleziona in quale pannello del grafico appare l'overlay.
Parametri
Generale
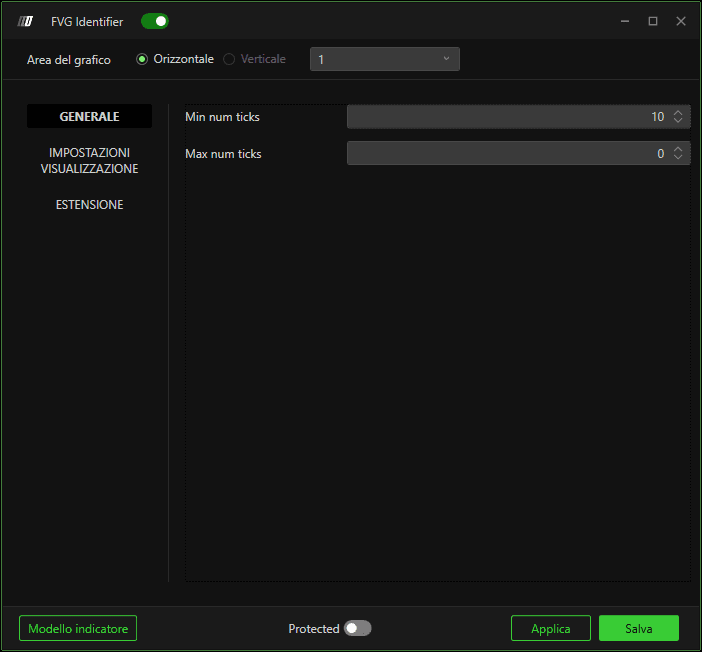
Numero minimo di tick
Definisce la dimensione minima (in tick) richiesta affinché un gap sia considerato un FVG valido.
Valori più piccoli rilevano più gap. Valori più alti filtrano gli squilibri minori.
Numero massimo di tick
Imposta la dimensione massima del gap consentita per qualificarsi come FVG.
Usalo per filtrare movimenti eccessivamente ampi.
Impostazioni del plot

Spessore linea
Controlla lo spessore dei bordi della zona FVG.
Colore
Imposta il colore dell'area FVG evidenziata.
Opacità sfondo
Regola la trasparenza dello sfondo della zona FVG.
Valori più alti = più solido. Valori più bassi = più trasparente.
Estensione

Reimposta all'inizio della giornata
Reimposta il tracciamento degli FVG all'inizio di ogni nuovo giorno di trading.
Rimuovi la linea quando viene toccata dalla wick
Rimuove la zona FVG se il prezzo la penetra con la wick (invece di richiedere una chiusura completa del corpo).
Estensione massima in barre
Limita di quante barre la zona FVG si estende in avanti.
0 = estensione illimitata.
% di breakout
Definisce quanta parte del gap deve essere riempita (in percentuale) per considerarlo mitigato o rotto.