Indicatori
Updated:
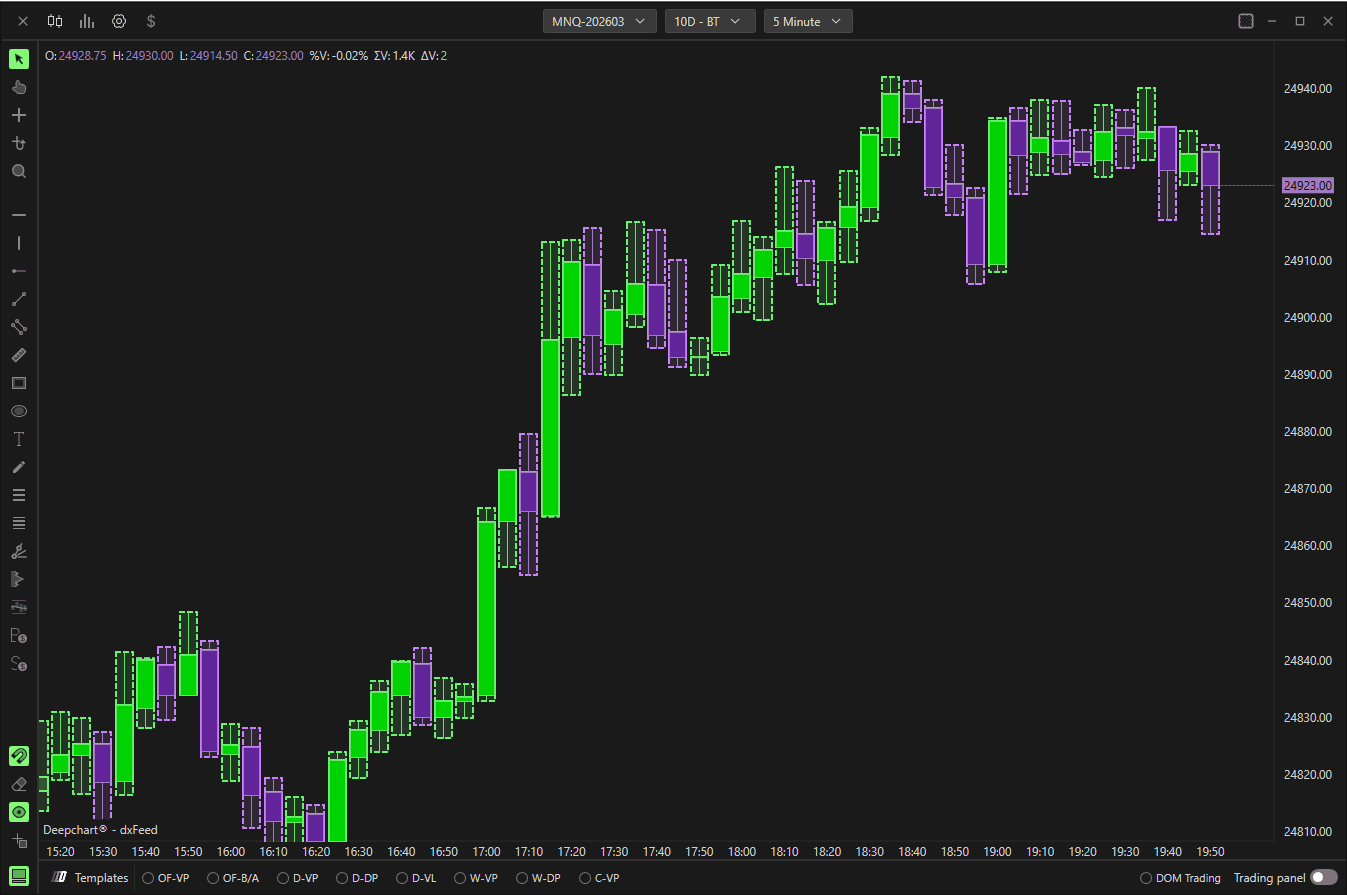
Overlay Timeframe Highlight consente ai trader di:
Visualizzare la struttura del timeframe superiore senza cambiare grafico
Monitorare i range massimo/minimo delle candele di timeframe superiore
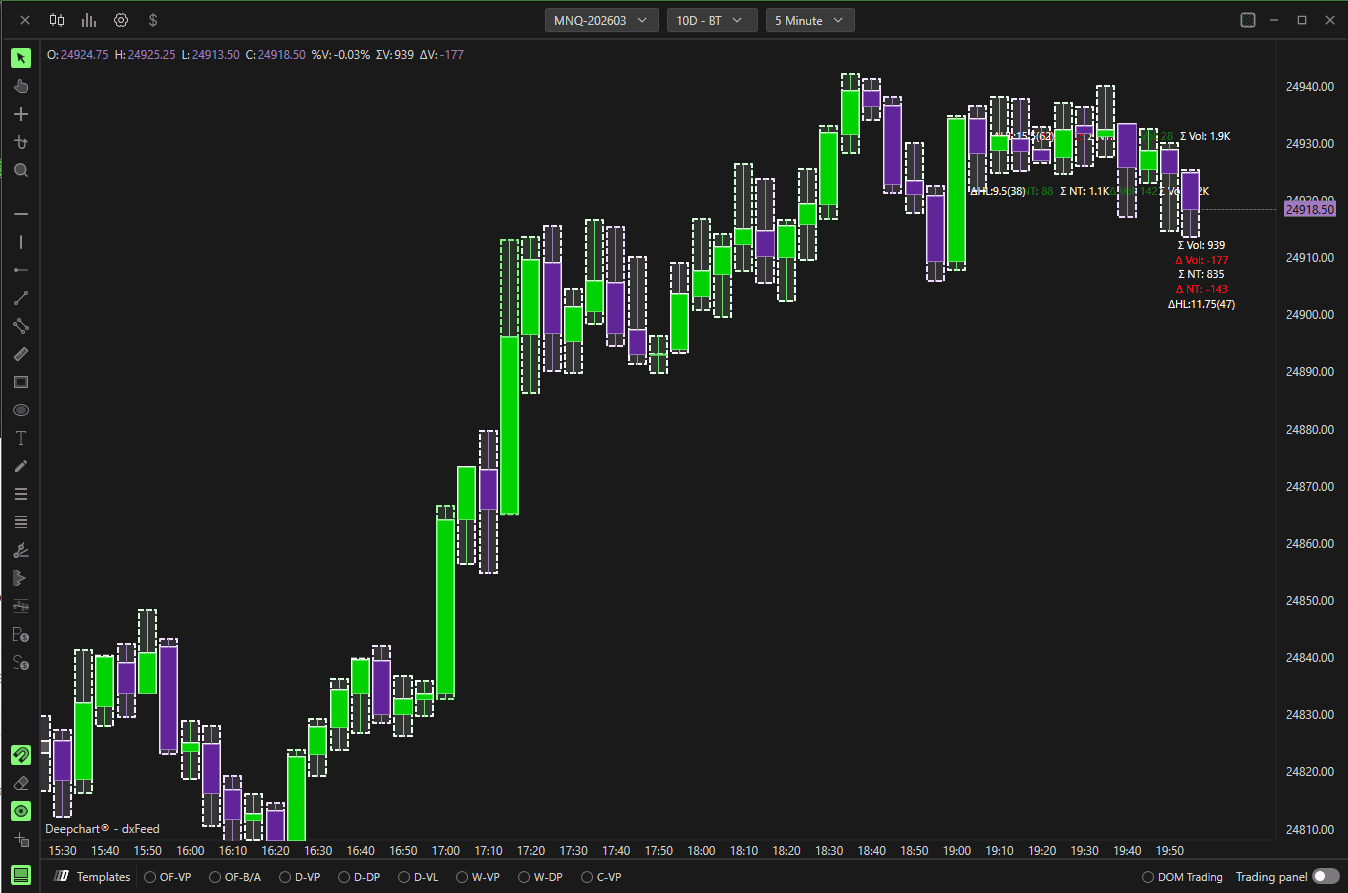
Monitorare il volume o i riepiloghi delle operazioni
Contrassegnare i target del timeframe superiore
Impostazioni
Area del grafico
Orizzontale – Disegna le evidenziazioni direttamente sul grafico prezzi.
Verticale – Visualizza in verticale (se supportato).
Selettore pannello – Seleziona in quale pannello del grafico appare l'overlay.
Parametri
Generale

Tipo parametro
Definisce il tipo di timeframe usato per l'evidenziazione (es., Minuto, Ora, Giorno).
Parametro 1
Specifica il valore principale del timeframe (es., evidenziazione a 5 minuti).
Parametro 2
Parametro secondario opzionale usato in base al tipo di timeframe selezionato.
Colore
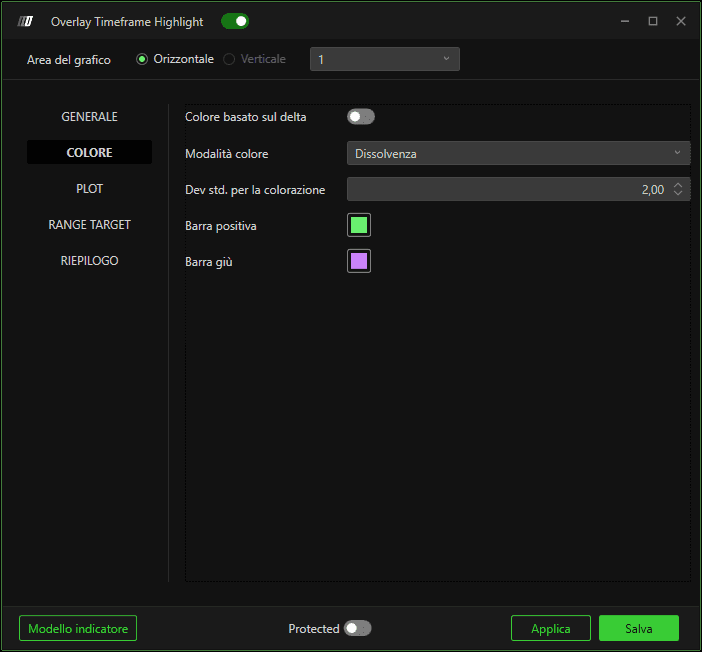
Colore in base al delta
Cambia dinamicamente il colore dell'evidenziazione in base al delta del flusso degli ordini.
Modalità colore
Determina come viene applicato il colore dell'evidenziazione (es., sfumato o pieno).
Deviazione standard per il colore
Controlla la sensibilità quando il colore si basa sulla deviazione statistica.
Barra rialzista
Imposta il colore dell'evidenziazione per le candele rialziste del timeframe superiore.
Barra ribassista
Imposta il colore dell'evidenziazione per le candele ribassiste del timeframe superiore.
Tracciato
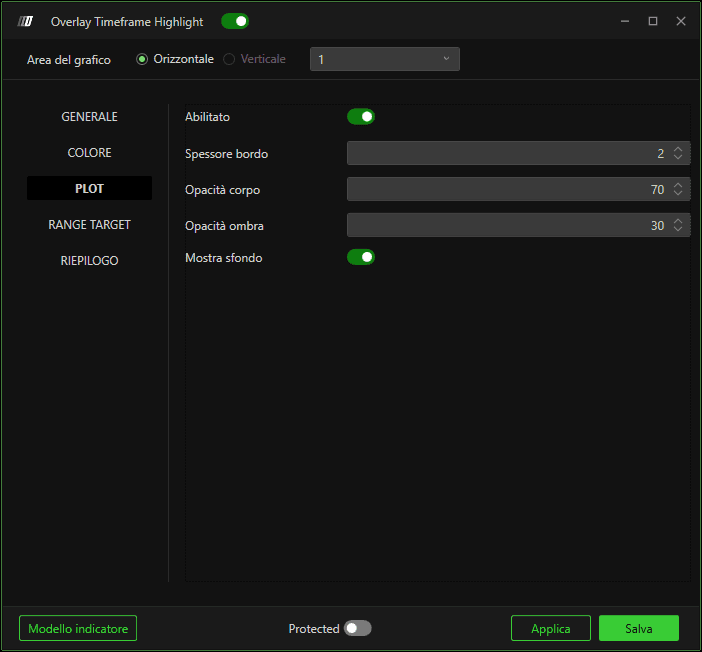
Abilita
Attiva o disattiva l'overlay di evidenziazione.
Larghezza bordo
Controlla lo spessore dell'evidenziazione del bordo della candela.
Opacità del corpo
Regola la trasparenza dell'evidenziazione del corpo della candela.
Opacità dell'ombra
Regola la trasparenza dell'evidenziazione dell'ombra della candela.
Mostra sfondo
Riempie l'intero sfondo dell'intervallo della candela del timeframe superiore.
Target del range
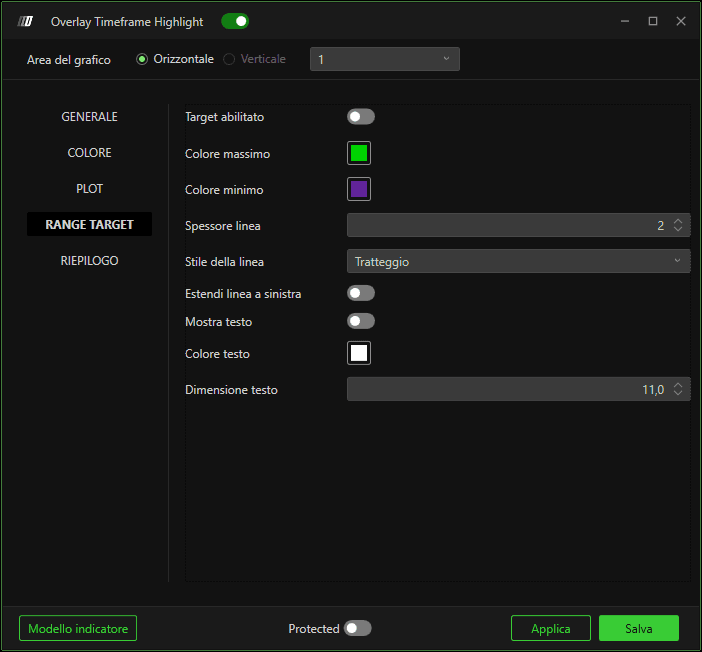
Target abilitato
Abilita le linee di proiezione del massimo/minimo dalla candela del timeframe superiore.
Colore massimo / Colore minimo
Imposta i colori delle linee proiettate di massimo e minimo.
Larghezza linea
Regola lo spessore delle linee target.
Stile linea
Definisce l'aspetto della linea (continua, tratteggiata, ecc.).
Estendi la linea a sinistra
Estende le linee target all'indietro sulle barre precedenti.
Mostra testo
Mostra il testo dell'etichetta sulle linee target.
Colore testo
Imposta il colore del testo dell'etichetta.
Dimensione testo
Controlla la dimensione del font dell'etichetta.
Riepilogo
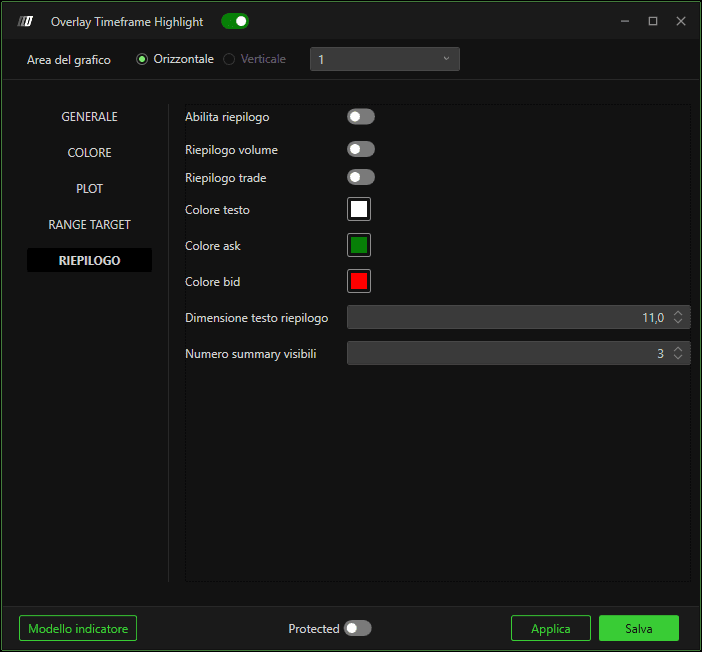
Abilita riepilogo
Mostra sul grafico le informazioni di riepilogo del timeframe superiore.
Riepilogo volume
Mostra il volume totale della candela evidenziata.
Riepilogo operazioni
Mostra metriche relative alle operazioni (se disponibili).
Colore testo
Imposta il colore del testo del riepilogo.
Colore Ask / Colore Bid
Definisce i colori usati per i valori ask/bid nel riepilogo.
Dimensione testo riepilogo
Controlla la dimensione del font dei dati di riepilogo.
Riepilogo da visualizzare
Definisce quante candele del timeframe superiore sono incluse nella visualizzazione del riepilogo.
Come funziona
Aggrega le barre del timeframe inferiore in segmenti di timeframe superiore.
Evidenzia visivamente ogni segmento.
Opzionalmente proietta i target massimo/minimo e mostra statistiche di riepilogo.