Indicatori
Updated:
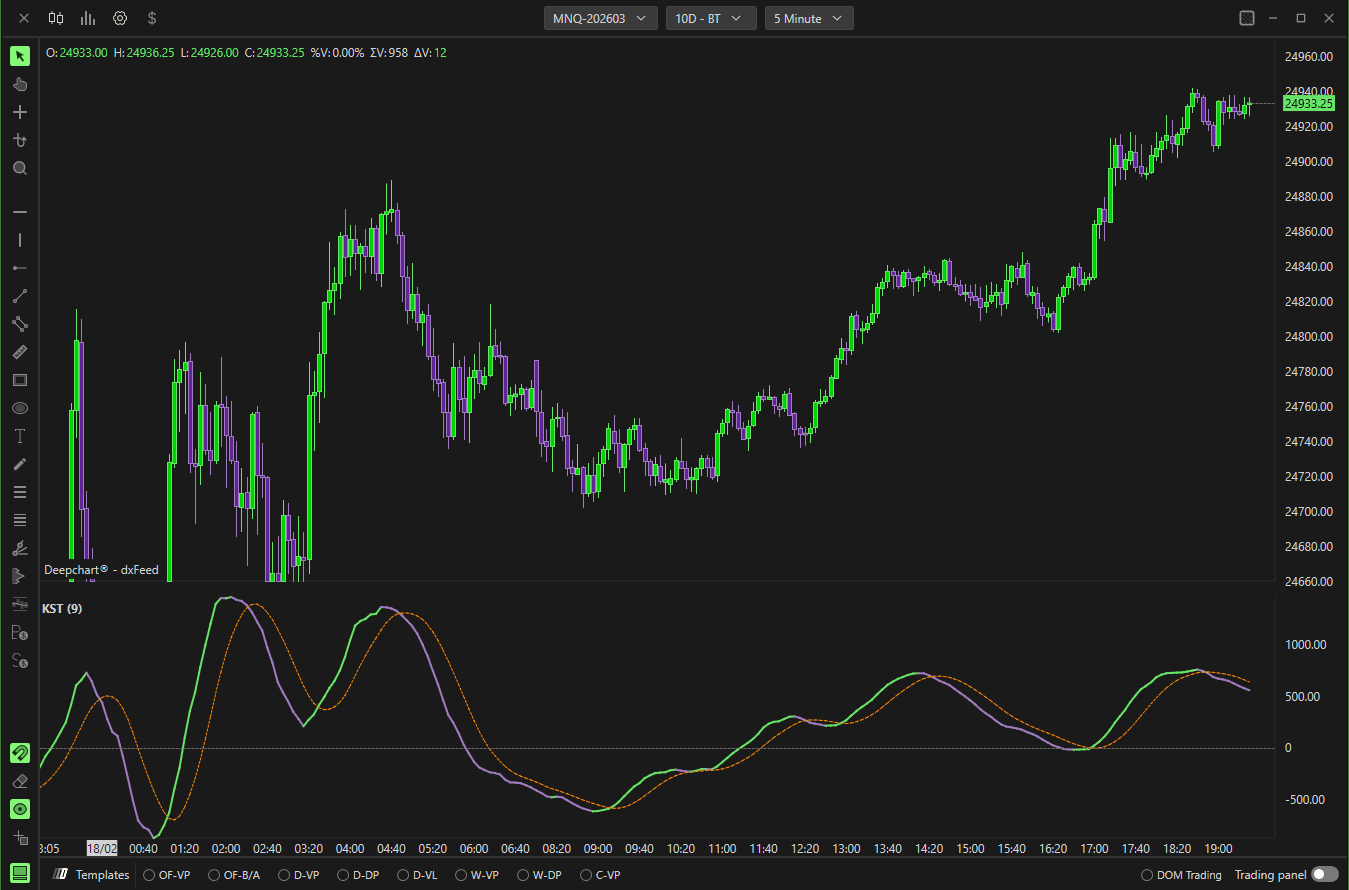
Combina il momentum a breve, medio e lungo termine in un unico indicatore e include una linea di segnale per l'analisi dei crossover.
Utilizzato per identificare:
Cambiamenti di momentum
Conferma del trend
Divergenze
Condizioni di iperestensione
Impostazioni
Area grafico
Orizzontale – Visualizza il KST in un pannello separato.
Verticale – Visualizza in verticale (se supportato).
Selettore pannello – Sceglie in quale pannello appare l'indicatore.
Usa asse secondario – Abilita la scala secondaria.
Parametri
Generale

Usa percentuali
Alterna il calcolo ROC tra:
Valori grezzi
Momentum basato sulle percentuali
Media
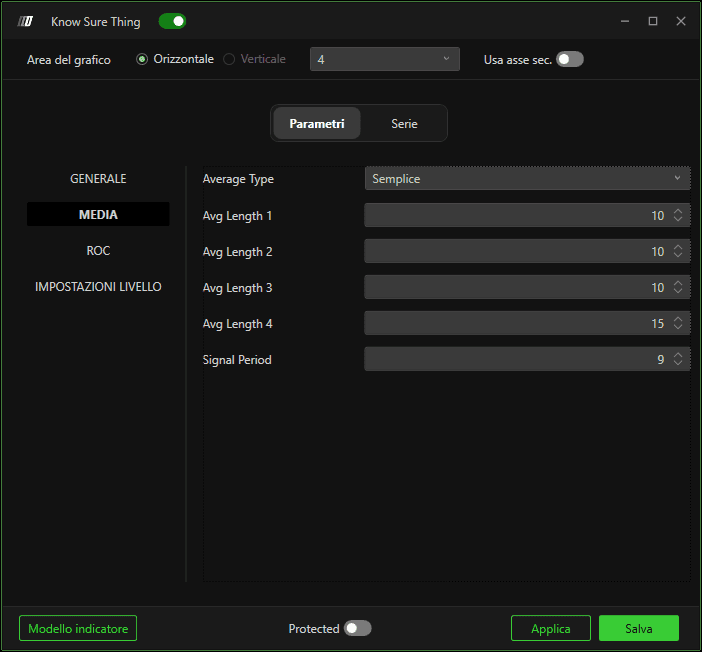
Tipo di media
Definisce il metodo di smoothing applicato a ciascun componente ROC.
Lunghezza media 1–4
Controlla lo smoothing di ciascun calcolo ROC individuale.
Valori più alti = più fluido ma con risposta più lenta.
Periodo segnale
Definisce la lunghezza di smoothing della linea di segnale usata per i segnali di crossover.
ROC
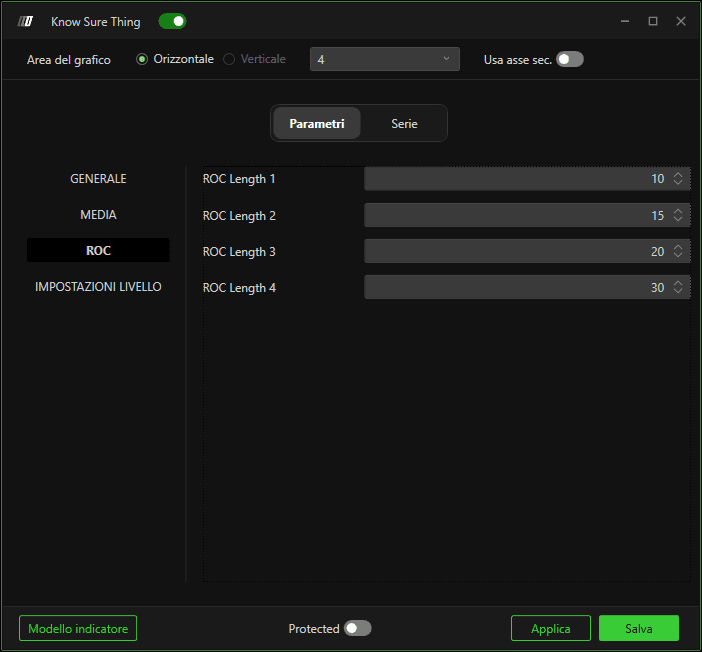
Lunghezza ROC 1–4
Definisce il periodo di lookback per ciascun componente Rate of Change.
Le lunghezze più brevi reagiscono più rapidamente.
Le lunghezze più lunghe catturano trend di momentum più ampi.
Impostazioni livello
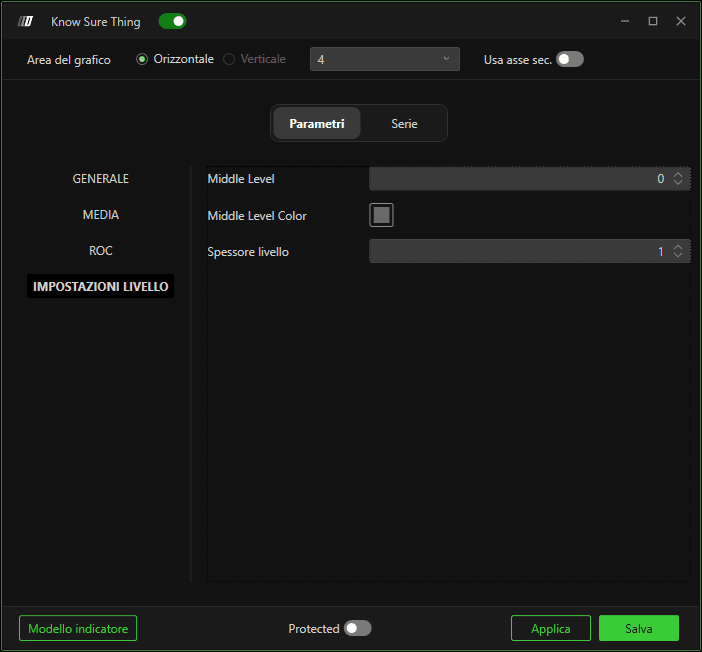
Livello centrale
Definisce la linea di riferimento neutra (zero).
Colore livello centrale
Personalizza il colore della linea dello zero.
Larghezza livello
Regola lo spessore della linea di riferimento.
Subgrafici
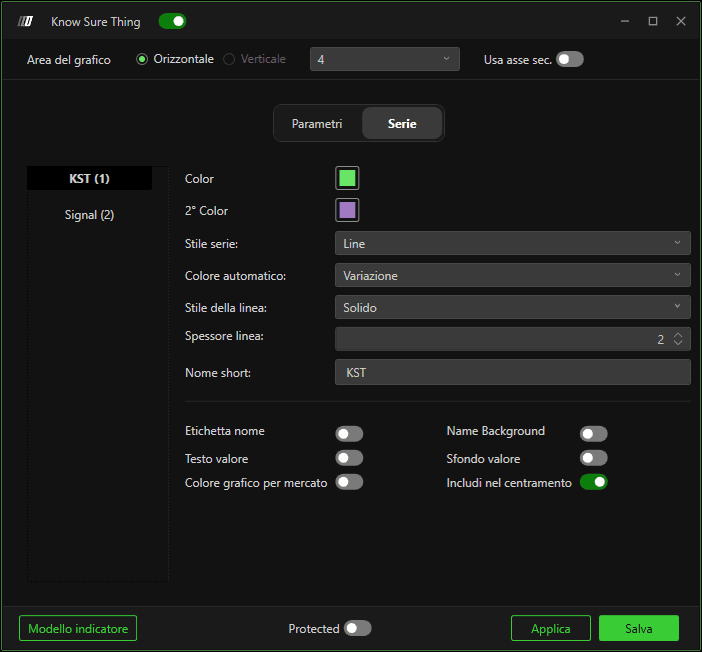
KST
Controlla l'aspetto della linea principale del momentum:
Colore
Stile linea
Larghezza
Comportamento del colore automatico
Visualizzazione etichetta
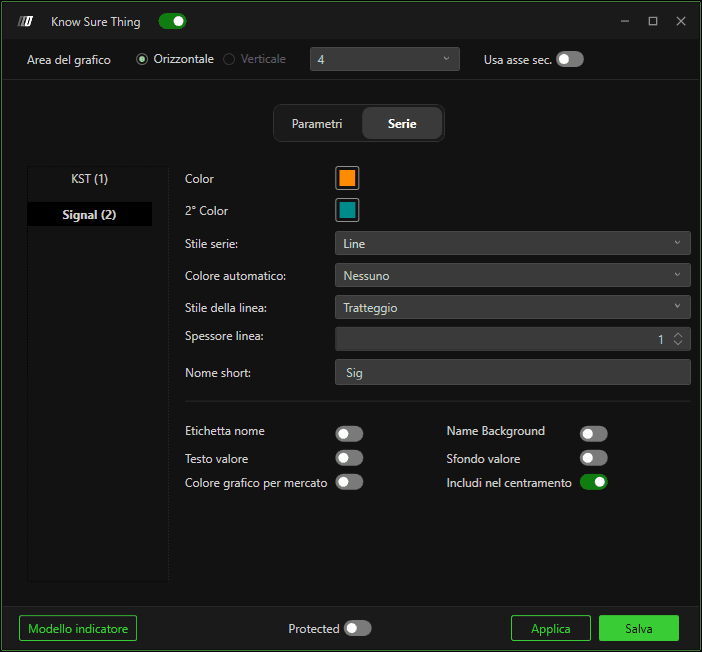
Segnale
Controlla l'aspetto della linea di segnale:
Colore
Stile linea
Larghezza
Visualizzazione etichetta
Opzioni di visualizzazione (entrambe le linee)
Etichetta nome – Mostra il nome dell'indicatore.
Etichetta valore – Mostra il valore corrente.
Sfondo nome – Sfondo dietro il nome.
Sfondo valore – Sfondo dietro il valore.
Includi nella centratura automatica – Include l'indicatore nella scalatura automatica.
Colore grafico per il marcatore – Usa il colore del grafico per i marcatori.
Come funziona
KST sopra lo zero → Impostazione di momentum rialzista.
KST sotto lo zero → Impostazione di momentum ribassista.
KST che incrocia al rialzo il Segnale → Possibile cambiamento rialzista.
KST che incrocia al ribasso il Segnale → Possibile cambiamento ribassista.