Indicatori
Updated:
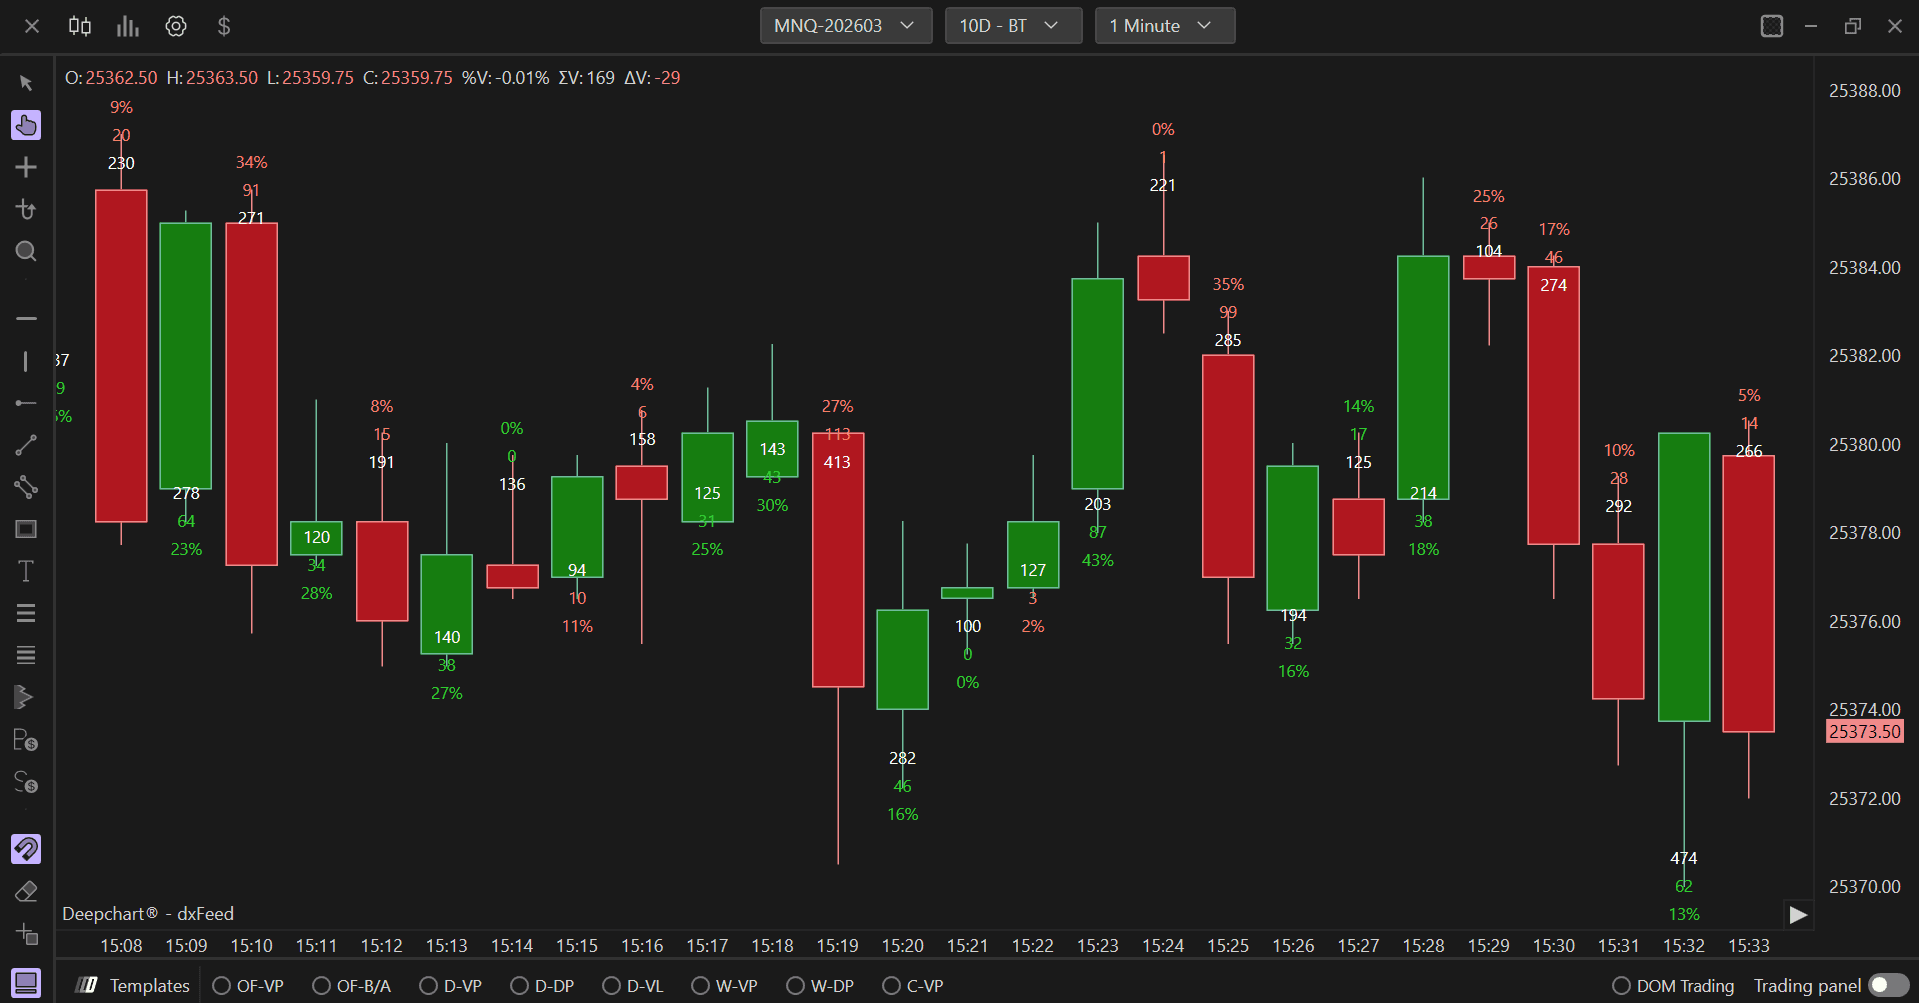
L'indicatore On Candle Stats visualizza statistiche dettagliate direttamente su ogni candela tramite caselle di testo. Mostra i volumi totali, il delta, il numero di trade e altri dati di microstruttura di mercato per ogni candela, fornendo ai trader informazioni complete sull'orderflow a colpo d'occhio.
Utilizzo delle Impostazioni
Cliccando sull'icona delle impostazioni dell'indicatore si aprirà la sua finestra di configurazione, all'interno della quale puoi effettuare diverse scelte riguardo alla funzionalità dell'indicatore stesso.
Impostazioni Dati
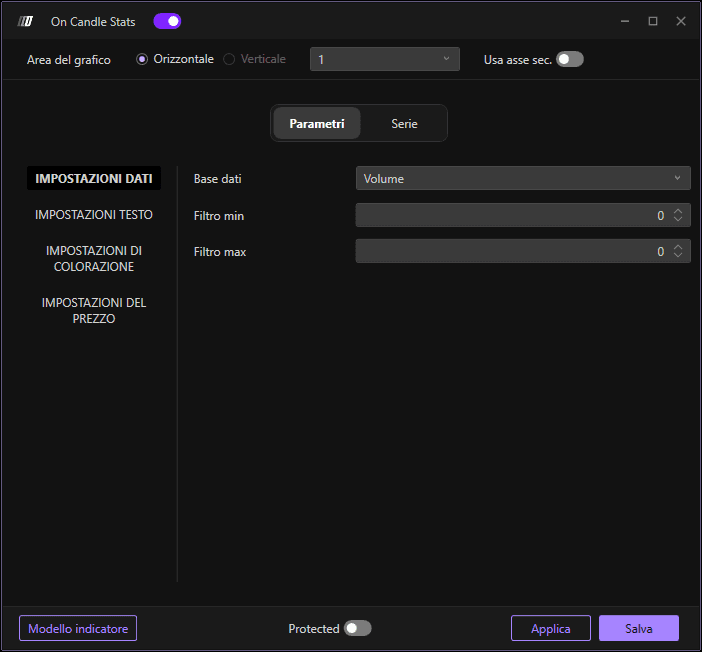
Dati di Input
Definisce quale database utilizzare per calcolare l'indicatore. Puoi scegliere tra:
Volume: Rappresenta il volume totale scambiato a ciascun livello di prezzo. Questo database è utile per comprendere l'intensità degli scambi e individuare i livelli di prezzo in cui si è concentrata la maggior parte dell'attività di mercato.
Ordini: Indica il numero di transazioni eseguite a ciascun livello di prezzo. Questo database è utile per comprendere la frequenza degli ordini e individuare i livelli di interesse nel mercato.
Volume Aggregato: Mostra il volume aggregato degli ordini combinando gli ordini effettuati sul livello di prezzo. Questa opzione offre una visione più accurata dei livelli di attività di trading raggruppando gli ordini eseguiti sullo stesso livello di prezzo.
Filtro Min
Consente di applicare un filtro minimo al database scelto. Verranno visualizzati solo i dati superiori a questa soglia.
Filtro Max
Consente di applicare un filtro massimo al database scelto. Se viene lasciato il valore 0, l'indicatore non applica alcun filtro massimo.
Impostazioni Testo
Dimensione Carattere
Ti consente di modificare la dimensione del testo visualizzato sulle candele.
Dimensione Carattere Più Piccola
Definisce la dimensione minima del testo. Questo garantisce che il testo rimanga leggibile anche su scale più piccole.
Formato Testo Automatico
Se attivato, consente di visualizzare il testo in formato automatico, raggruppando i numeri quando superano le migliaia (ad es. 1.234 invece di 1234).
Segno Assoluto
Se attivato, consente di visualizzare il testo in formato assoluto (senza segni +/-).
Impostazioni Colore
Opacità in Base al Rapporto
Abilita la regolazione dell'opacità in base a specifici rapporti.
Rapporto Massimo
Definisce il rapporto massimo di opacità. Questo controlla quanto sono visibili le caselle di testo.
Colora il Testo in Base al Delta
Se attivato, consente di colorare il testo in base al delta. Un delta positivo può essere visualizzato con un colore (di solito verde) e un delta negativo con un altro (di solito rosso).
Impostazioni Prezzo
Offset in Tick
Definisce, in termini di tick, la distanza tra la casella di testo e la candela. Questo aiuta a evitare che il testo si sovrapponga all'azione del prezzo.
Posizionamento Prezzo
Definisce dove posizionare la casella di testo rispetto al prezzo. Puoi scegliere tra:
High: Posiziona la casella di testo sul prezzo massimo della candela
Low: Posiziona la casella di testo sul prezzo minimo della candela
Center: Posiziona la casella di testo al centro della candela
Price Slope: Posiziona la casella di testo sui massimi nelle candele ribassiste e sui minimi nelle candele rialziste
Delta Sign: Posiziona la casella di testo sui massimi nelle candele con delta negativo e sui minimi nelle candele con delta positivo
Sottografici
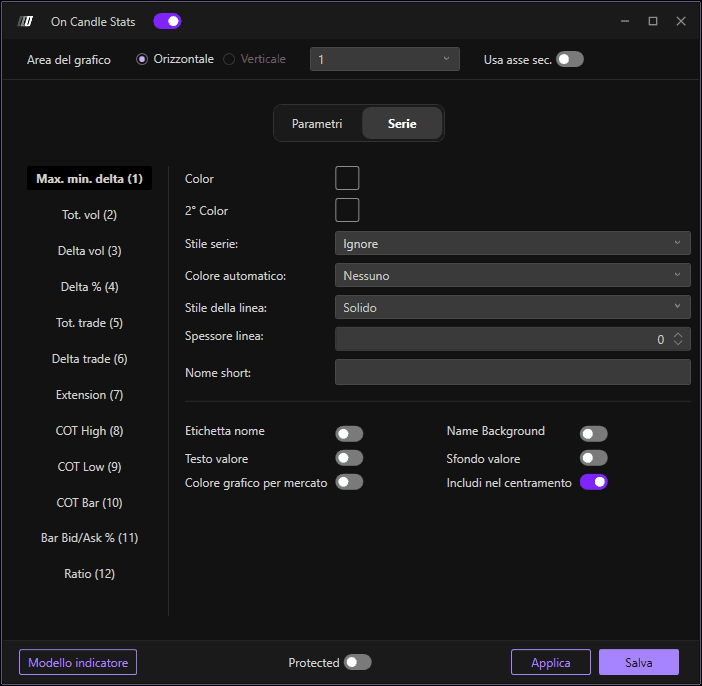
In questa sezione puoi abilitare o nascondere le serie principali dell'indicatore e cambiarne i colori di sfondo e del testo. Per abilitare una serie, fai clic su Stile Serie e seleziona Testo; per nasconderla, seleziona Ignora.
Delta Max./Min.: Mostra a sinistra il delta minimo e a destra il delta massimo raggiunti dalla candela.
Vol. Tot.: Mostra i volumi totali scambiati nella barra.
Vol. Delta: Mostra il delta della barra, ovvero il differenziale tra i volumi scambiati in Ask e i volumi scambiati in Bid.
Trade Tot.: Mostra il numero totale di trade eseguiti nella barra.
Trade Delta: Mostra il delta dei trade della barra, ovvero il differenziale tra i trade eseguiti in Ask e i trade eseguiti in Bid.
Estensione: Mostra l'estensione in tick (range) della candela.
COT High: Close Of Trade High—mostra il delta cumulato dall'ultima volta in cui la barra corrente ha fatto un minimo fino alla sua chiusura. In condizioni normali, il COT H sulle barre ribassiste tende a essere negativo; quando ciò non accade, segnala un possibile assorbimento da parte dei compratori.
COT Low: Close Of Trade Low—mostra il delta cumulato dall'ultima volta in cui la barra corrente ha fatto un massimo fino alla sua chiusura. In condizioni normali, il COT L sulle barre rialziste tende a essere positivo; quando ciò non accade, segnala un possibile assorbimento da parte dei venditori.
COT Bar: Mostra il COT High nelle barre rialziste o il COT Low nelle barre ribassiste.
Bid-Ask/Vol: Mostra il delta percentuale di ciascuna barra.
Ratio: Mostra il Ratio High nelle barre ribassiste e il Ratio Low nelle barre rialziste, indicando potenziali pattern di esaurimento.