Updated:
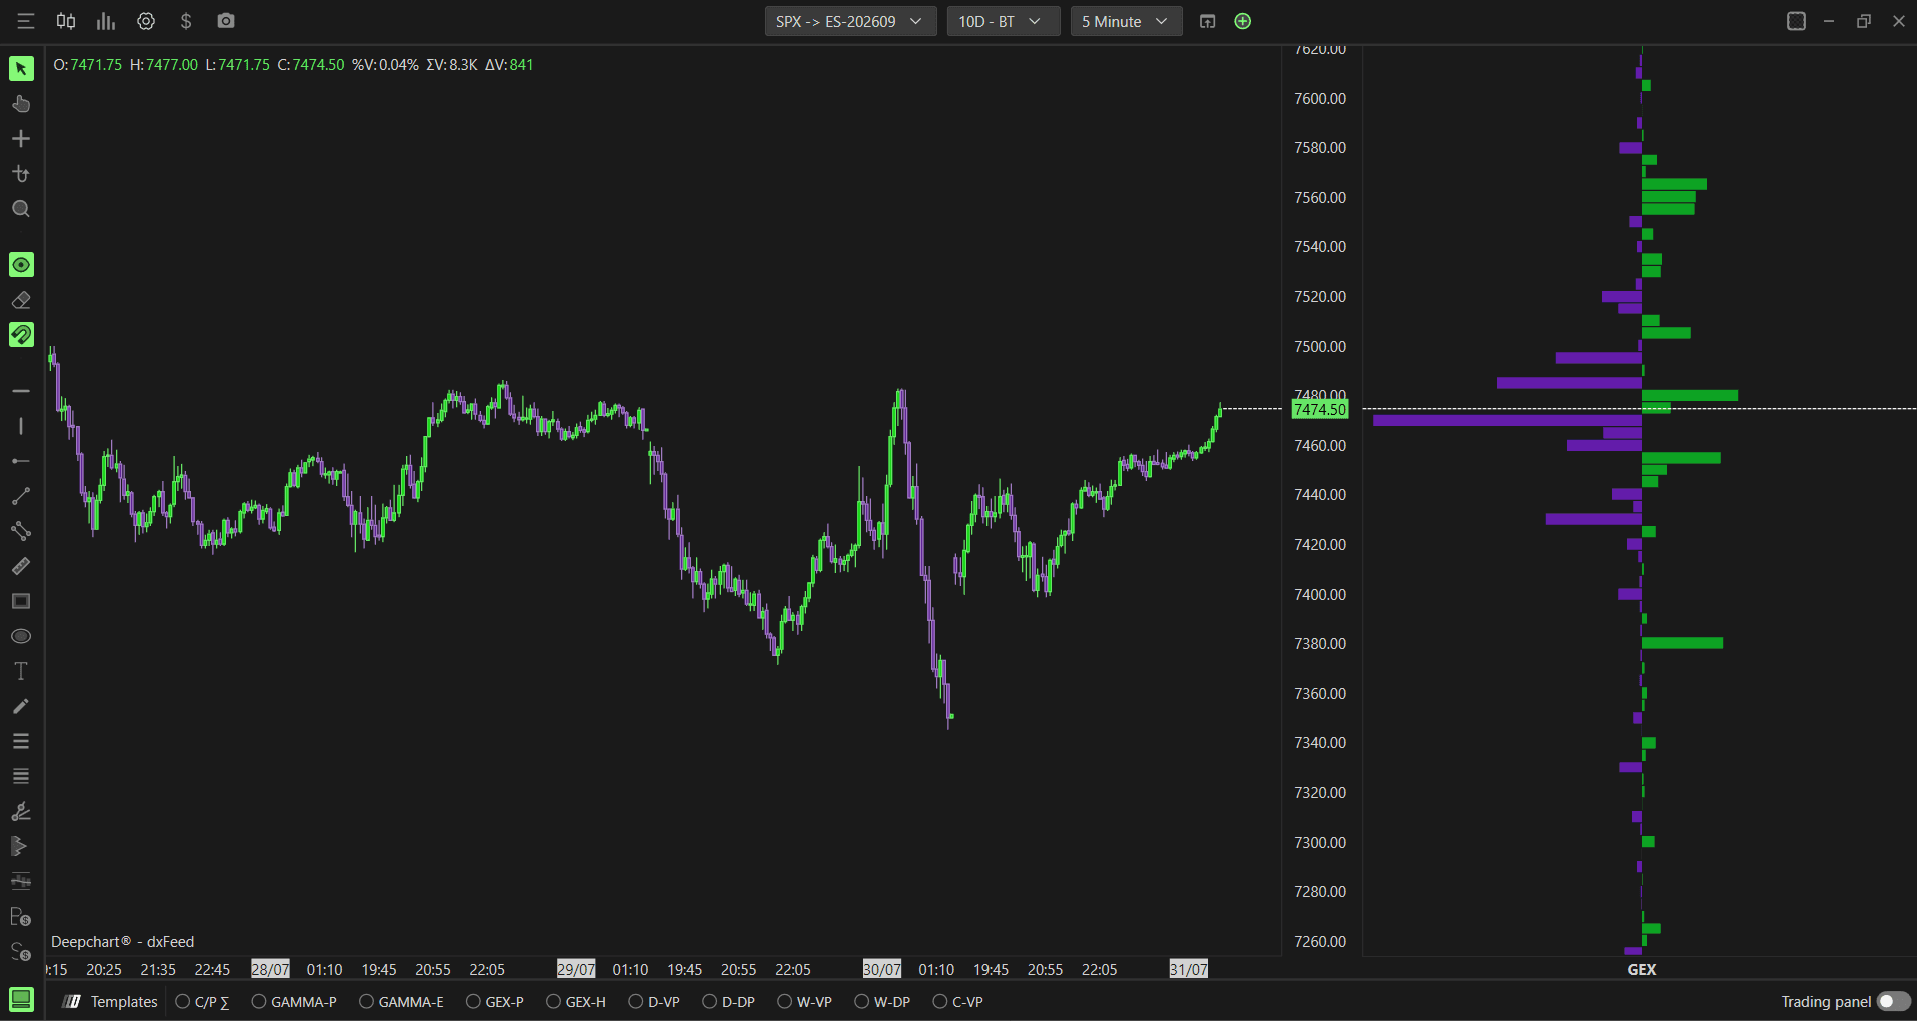
Option Gex Profile displays the real market maker gamma exposure (GEX) as a vertical profile panel on the right side of your chart, showing the distribution of dealer gamma exposure across all strike prices. It is similar to a volume profile but instead of volume, it shows where the most significant dealer gamma exposure exists - helping you identify key levels where dealer hedging activity is concentrated.
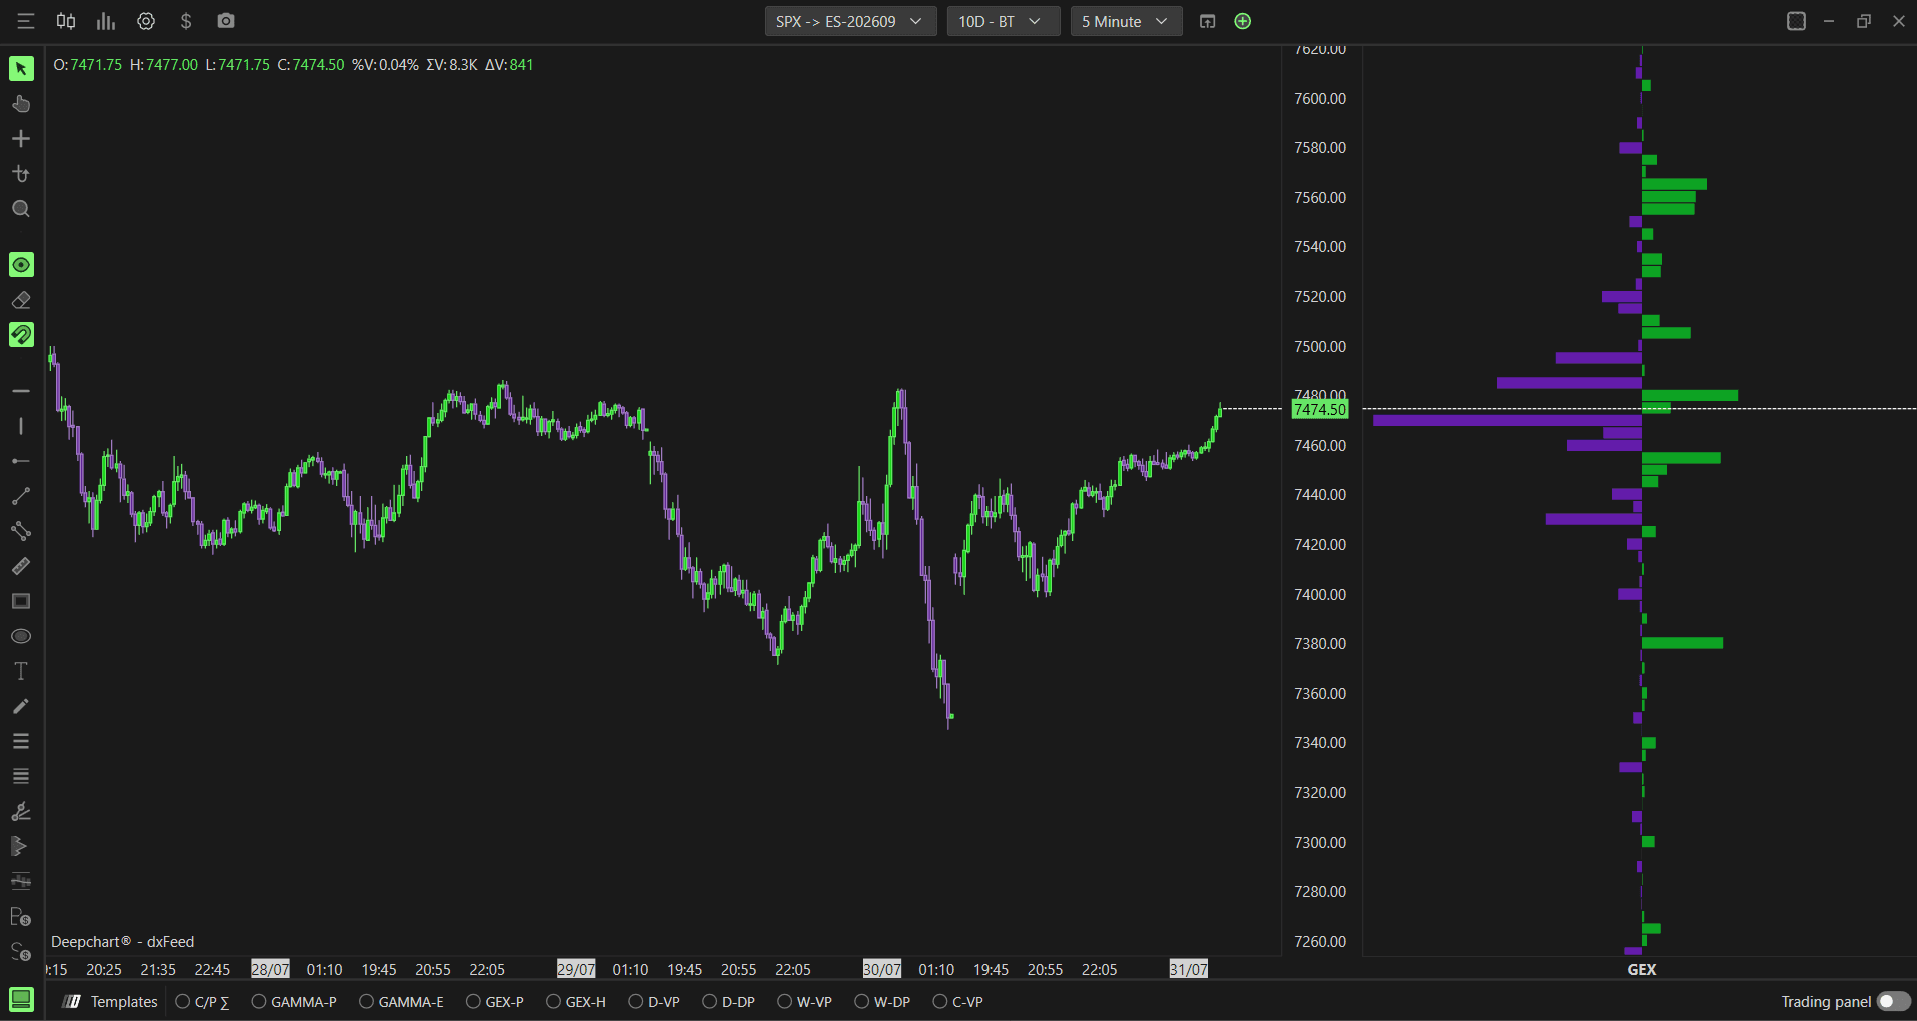
Note: Option Gex Profile is available on SPX only, as it requires real CBOE participant data.

How to Add Option Gex Profile
Method 1 - Via Indicator Tab
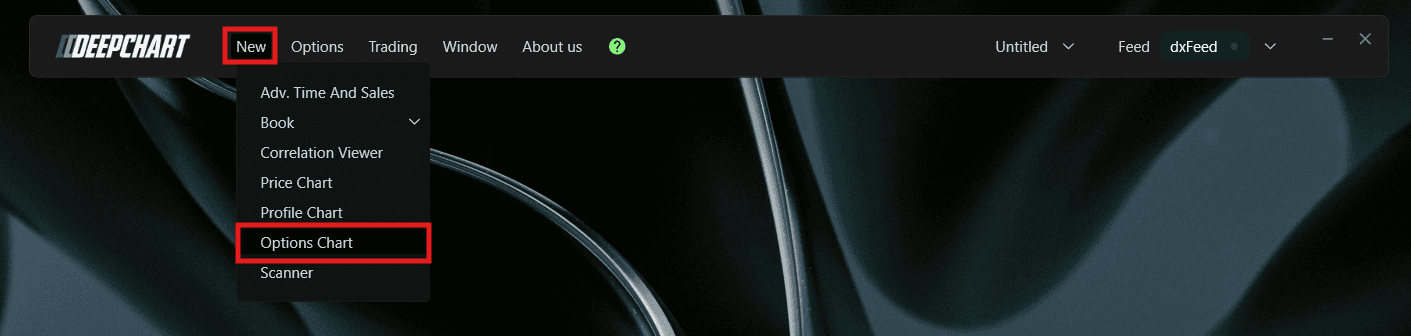
Go to New in the top menu
Click on Option Chart
A Select Instrument dialog will appear. Since Option Big Flows requires CBOE data, select SPX - Symbol: ES-CME, Exchange: CME
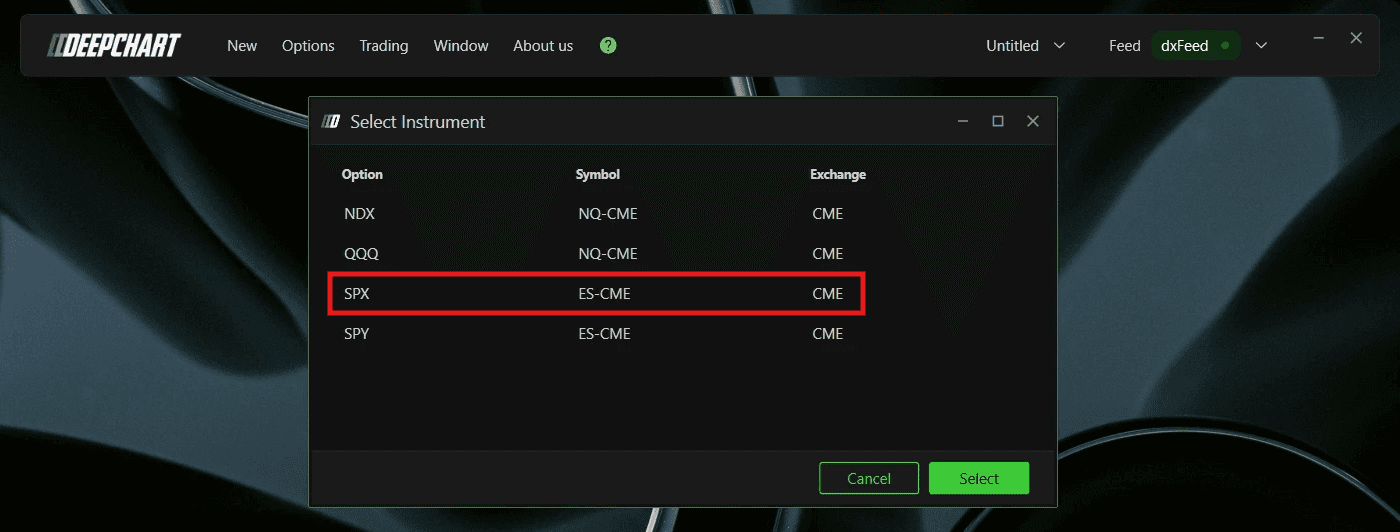
Click to open the chart
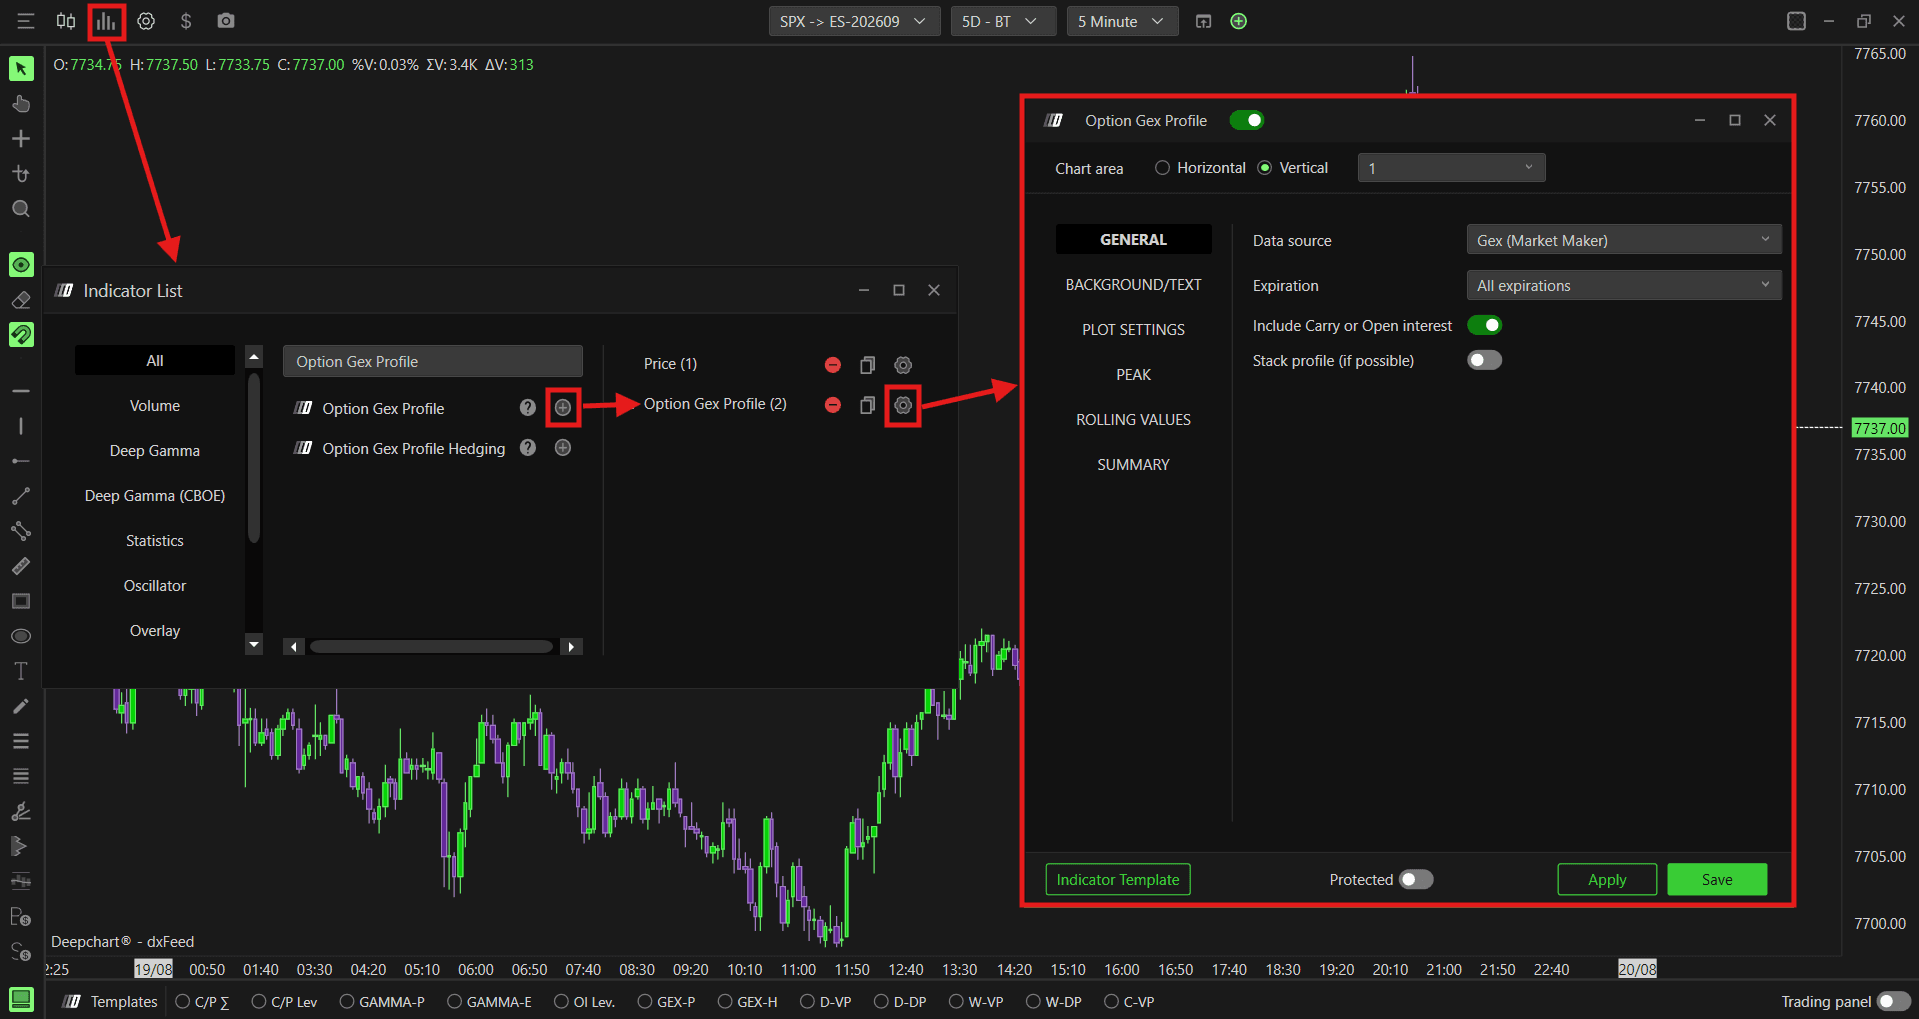
Once the Option Chart is loaded, click the Indicator Add button on the chart toolbar
Search for Option Gex Profile and click + to add it
Click the settings icon to open the configuration window
Method 2 - Via Templates Bar
Once the Option Chart is open, you can quickly enable the Option Gex Profile directly from the Templates bar at the bottom of the chart.
Locate the Templates bar at the bottom of the Option Chart
Click on GEX-P to instantly load the Option Gex Profile on your chart

Once the Option Gex Profile is enabled, you can access its settings at any time by right-clicking on the GEX-P tab in the Templates bar and selecting Settings.
Understanding the Profile
The Option Gex Profile can be viewed in two ways depending on the Data source selected:
Gex (default) - displays a single profile where green bars represent positive GEX (call side) and purple bars represent negative GEX (put side). The longer the bar, the stronger the dealer exposure at that strike
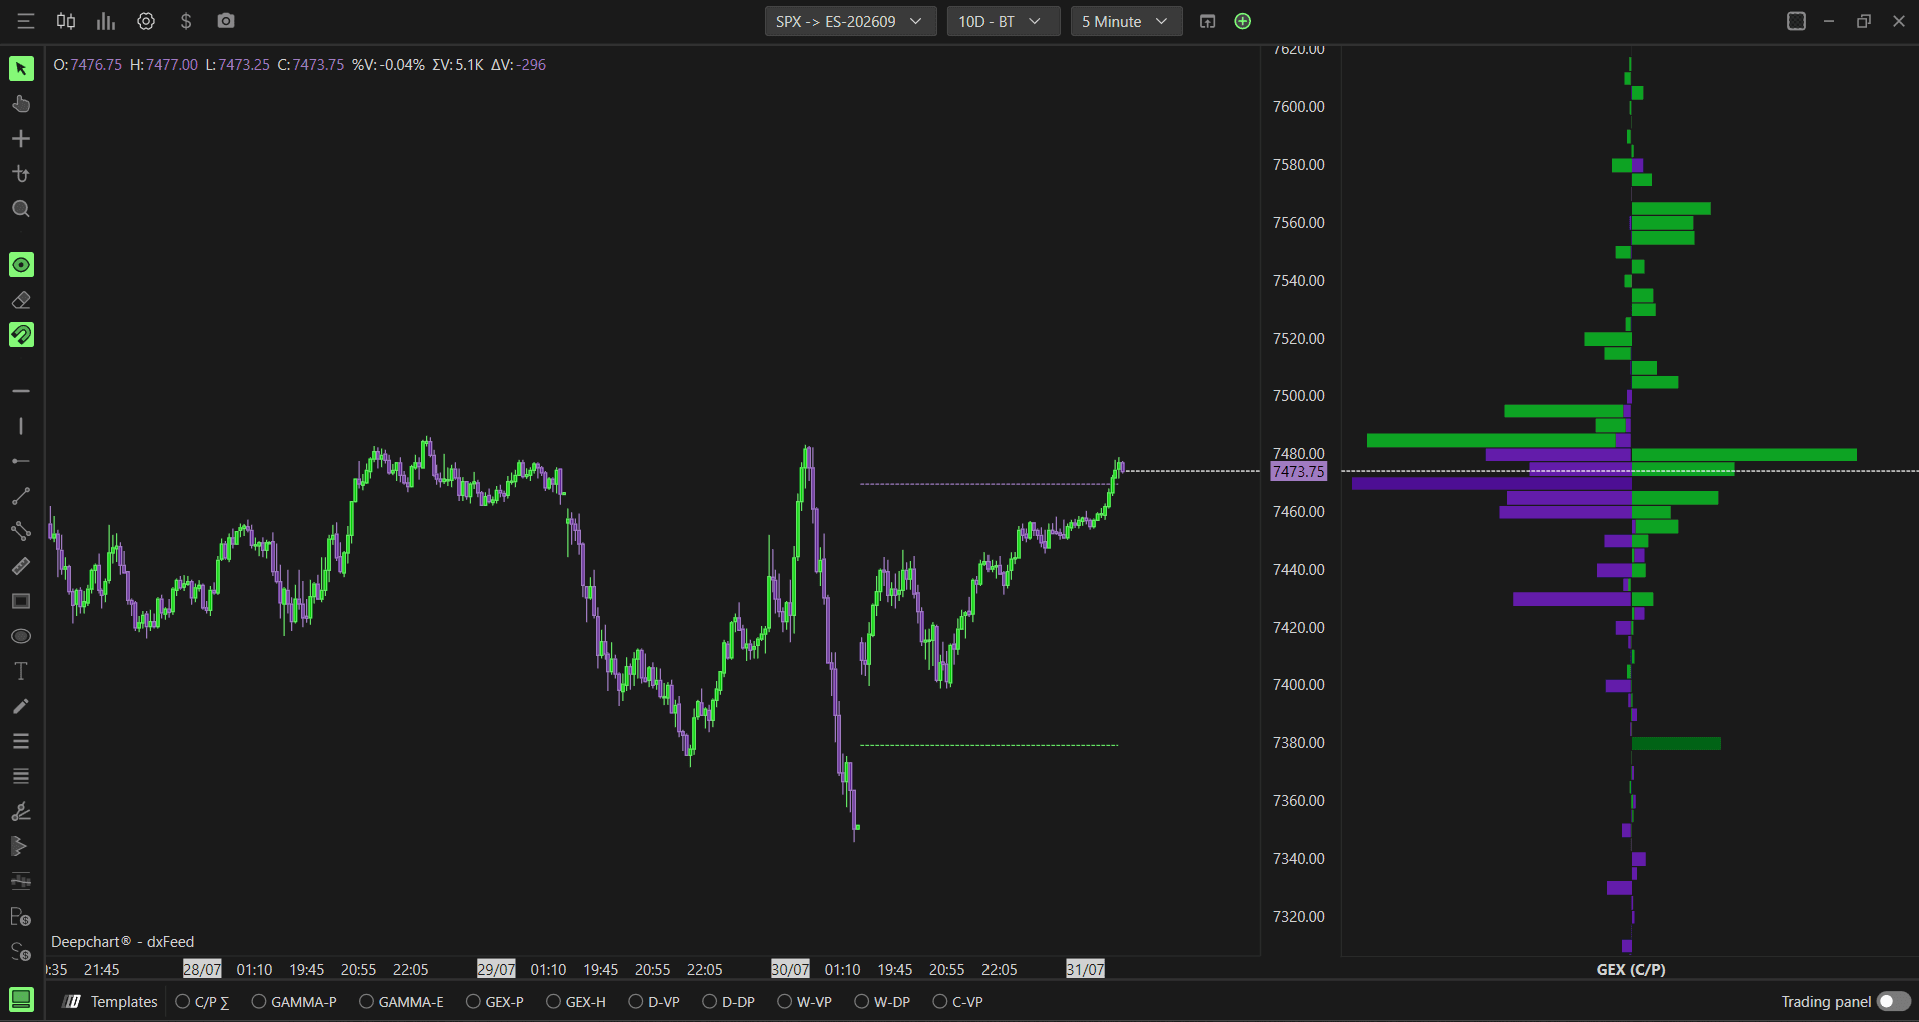
Gex split - displays the call and put GEX side by side from a center line. Green bars extend to the right showing call side exposure and purple bars extend to the left showing put side exposure. This gives you a clear visual comparison of where calls dominate versus where puts dominate at each strike level
Understanding Key Terms
Before choosing a data source, it helps to understand a few core options concepts:
Call - An option that gives the buyer the right to buy the underlying at a set price. Traders buy calls when they expect price to go up
Put - An option that gives the buyer the right to sell the underlying at a set price. Traders buy puts when they expect price to go down
Gamma - A measure of how much an option’s delta changes as price moves. High gamma means dealers need to hedge more aggressively as price approaches a strike
GEX (Gamma Exposure) - An estimate of the gamma exposure dealers are carrying at a given strike, combining volume with the gamma greek
DEX (Delta Exposure) - An estimate of the delta exposure dealers are carrying at a given strike, showing directional hedging pressure rather than gamma sensitivity
OI (Open Interest) - The total number of option contracts currently open and not yet closed or expired
OI-R (Real-Time Open Interest) - Since official exchange open interest is only released at end of day, DeepChart calculates open interest in real time from live CBOE buy and sell flow. For example, if there are 2 sells and 1 buy, there is a net open position of 1. This gives an up to date view of open interest without waiting for the exchange’s end of day figures
Market Maker Net Flow - The net delta flow generated specifically by market maker buy and sell activity, isolating dealer side positioning from overall market activity
Settings
General
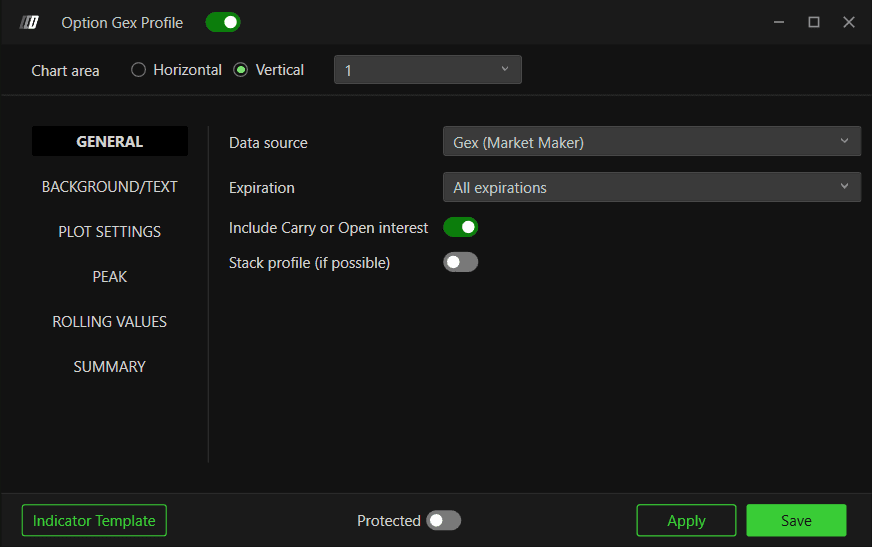
Data source - Choose what data is used to build the profile. Options available:
Gex (Market Maker) (default) - uses real CBOE reported market maker gamma exposure, showing net dealer exposure at each strike, also known as the “convexity ladder” on other platforms.
Use this when: you want the most reliable read on real dealer gamma hedging pressureGex (Market Maker C/P) - same real market maker gamma data, but split into separate call and put sides rather than shown as a single net value.
Use this when: you want to see call side and put side dealer exposure separately rather than netted togetherMarket Maker Net Flow - shows the net delta flow generated by market maker buy and sell activity.
Use this when: you want to isolate dealer side flow specifically, separate from overall market activityCall/Put OI-R - displays real time open interest for calls and puts.
Use this when: you want to see live standing positions without any gamma weightingDex (Market Maker) - uses real CBOE reported market maker delta exposure, also known as the “DEX ladder” on other platforms.
Use this when: you want to see dealer directional hedging pressure rather than gamma sensitivityGex (Call OI-R - Put OI-R) - calculates gamma exposure using real time open interest as the base instead of session volume, also known as “state” GEX on other platforms. Since DeepChart calculates this open interest directly from live CBOE flow, this version is more accurate than the same calculation on platforms without direct CBOE access.
Use this when: you want a structural view of gamma exposure based on live positioning, rather than one driven by today’s volume
Background/Text
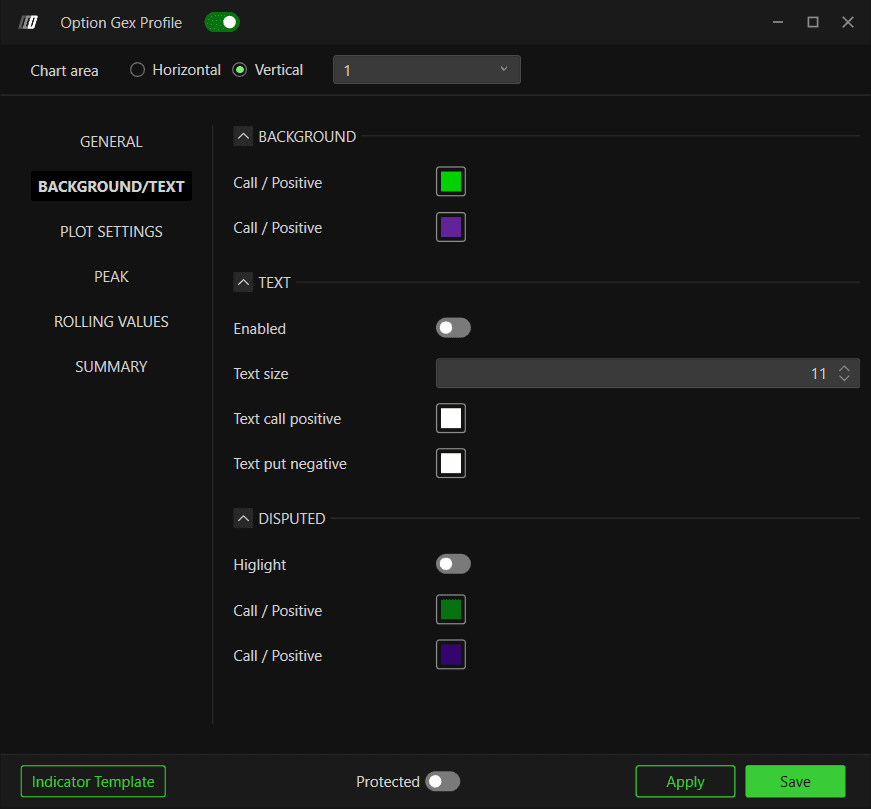
Background
Call / Positive - Set the color for the call side background. Default is green
Call / Positive (put side) - Set the color for the put side background. Default is purple
Text
Enabled - Toggle to show or hide text labels on the profile. Default is disabled
Text size - Set the font size for the text labels. Default is 11
Text call positive - Set the text color for call side labels. Default is white
Text put negative - Set the text color for put side labels. Default is white
Disputed
Highlight - When enabled, highlights strikes where the data is disputed or overlapping between call and put activity. Default is disabled
Call / Positive - Set the highlight color for the call side. Default is green
Call / Positive (put side) - Set the highlight color for the put side. Default is purple
Plot Settings
Width/Offset
Width type - Choose how the profile width is calculated. Options available:
Automatic (default) - DeepChart automatically sets the profile width based on the current chart view
Percentual period - sets the width as a percentage of the visible chart period
Window width - sets the width based on the current visible window
Fixed bars - sets a fixed number of bars for the profile width
Current Width - Set the width of the current session profile. Default is 10
Current Offset - Set the horizontal offset of the current session profile. Default is 0
Previous Width - Set the width of previous session profiles. Default is 15
Previous Offset - Set the horizontal offset of previous session profiles. Default is 0
Visual Appearance
Number of profile - Set how many session profiles are displayed on the chart. Default is 5
Vbp opacity - Set the opacity of the profile bars. Default is 90
Border width - Set the border width of the profile bars. Default is 1.00
Show above bars - When enabled, the profile is displayed on top of the price bars. Default is disabled
Visual style - Choose between Solid or Hollow profile bars. Default is Solid
Align to the right - When enabled, aligns the profile to the right side of the chart. Default is disabled
Always visible - When enabled, keeps the profile visible even when scrolling outside its range. Default is disabled

Peak
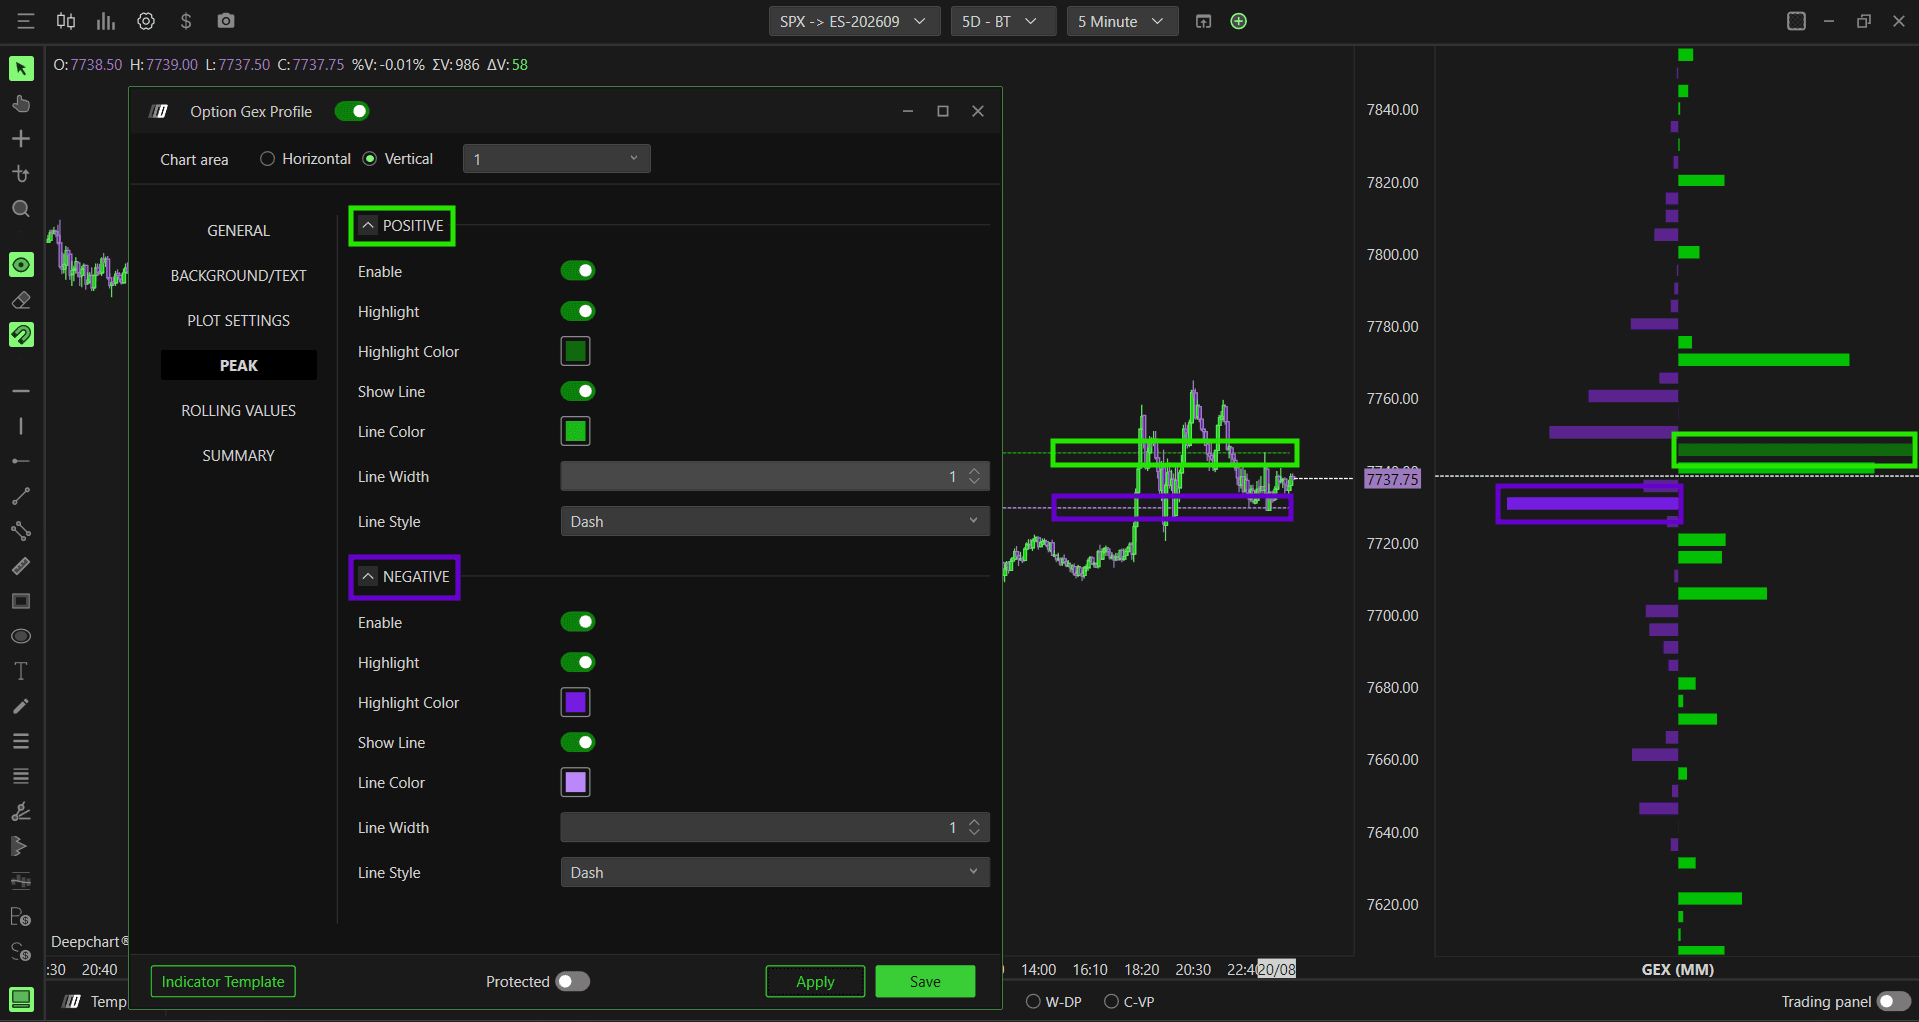
The Peak section highlights the highest and lowest GEX concentration points on the profile.
Positive (Call Side)
Enable - Toggle to show or hide the positive peak. Default is disabled
Highlight - When enabled, highlights the bar with the highest positive GEX on the profile. Default is disabled
Highlight Color - Set the highlight color. Default is green
Show Line - When enabled, draws a horizontal line at the peak positive GEX level. Default is enabled
Line Color - Set the line color. Default is green
Line Width - Set the line width. Default is 1
Line Style - Choose between Solid, Dash, Dot, Dash dot, or Dash dot dot. Default is Dash
Negative (Put Side)
Enable - Toggle to show or hide the negative peak. Default is disabled
Highlight - When enabled, highlights the bar with the highest negative GEX on the profile. Default is disabled
Highlight Color - Set the highlight color. Default is purple
Show Line - When enabled, draws a horizontal line at the peak negative GEX level. Default is enabled
Line Color - Set the line color. Default is purple
Line Width - Set the line width. Default is 1
Line Style - Choose between Solid, Dash, Dot, Dash dot, or Dash dot dot. Default is Dash
Rolling Values
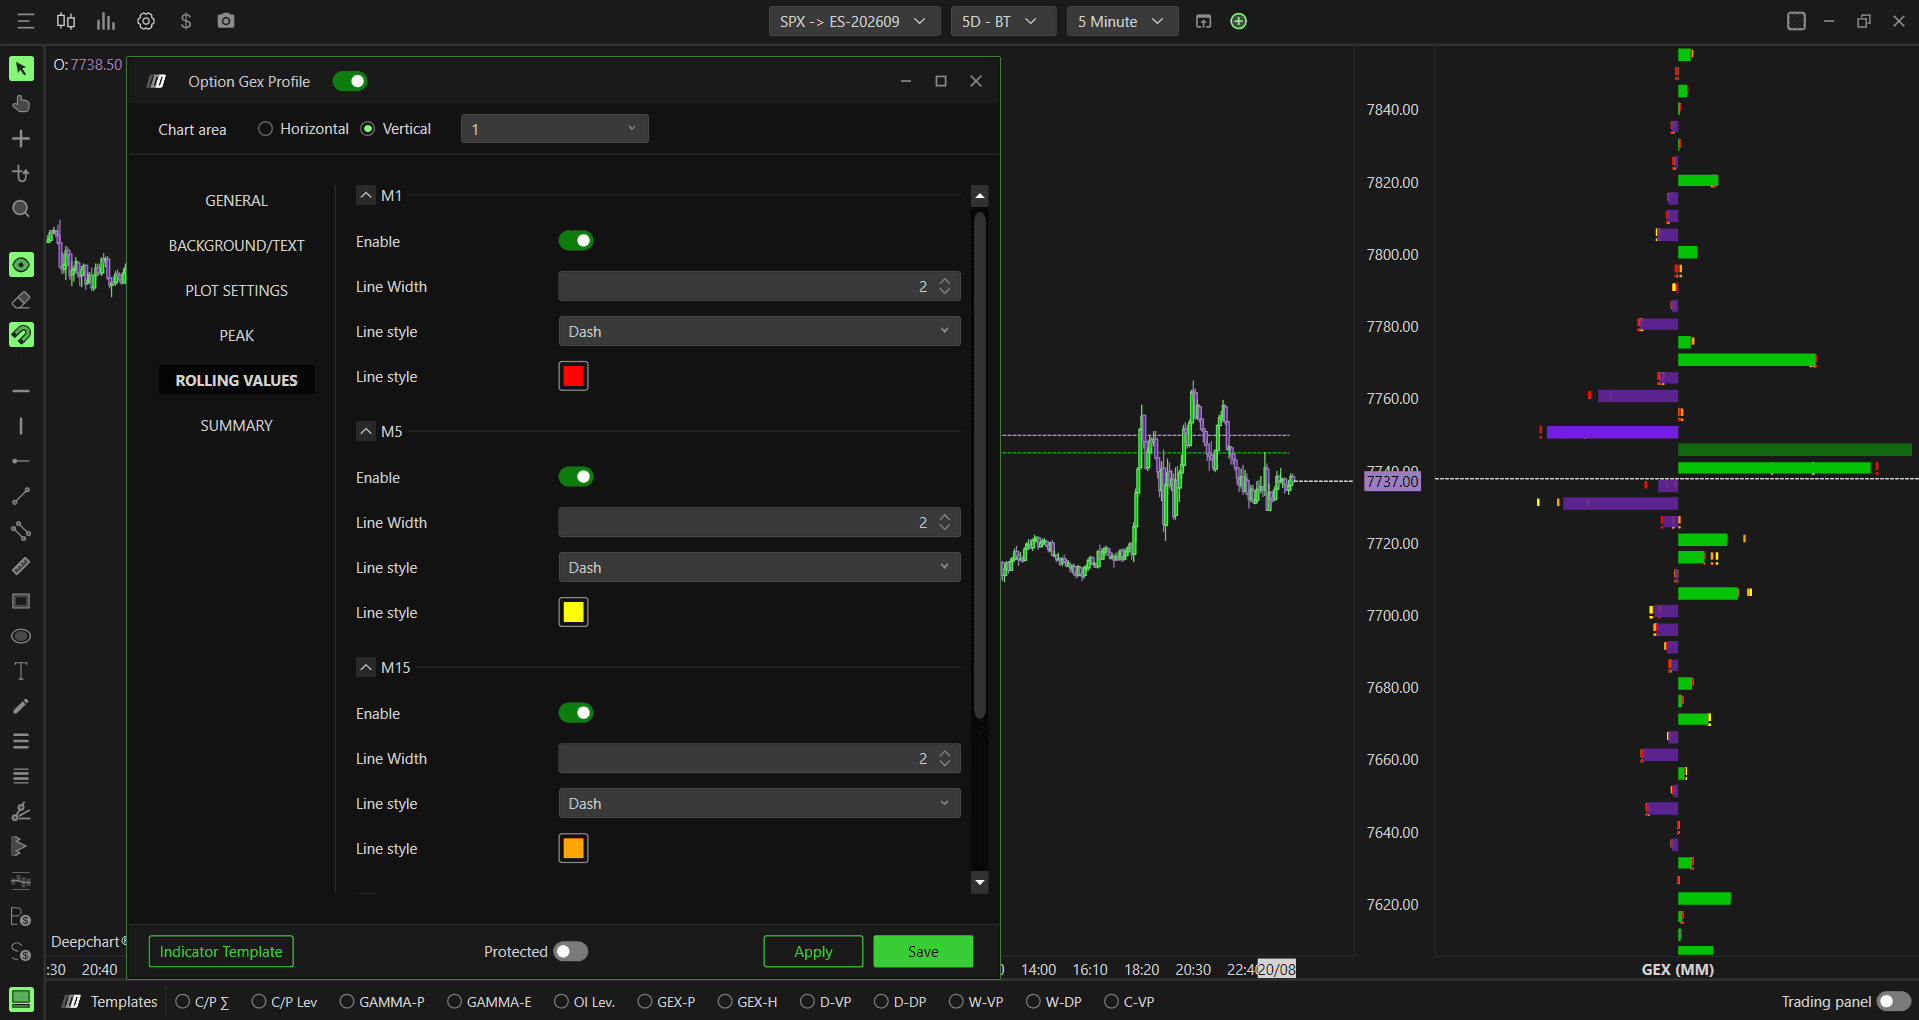
Rolling Values shows how the GEX profile looked at specific time intervals ago, plotted as lines on the current profile. This helps you see how the dealer gamma exposure has shifted over time during the session.
M1
Enable - Toggle to show or hide the 1 minute rolling value. Default is disabled
Line Width - Default is 1
Line Style - Choose between Solid, Dash, Dot, Dash dot, or Dash dot dot. Default is Dot
Line Style (color) - Set the color for this rolling value
M5
Enable - Toggle to show or hide the 5 minute rolling value. Default is disabled
Line Width - Default is 1
Line Style - Choose between Solid, Dash, Dot, Dash dot, or Dash dot dot. Default is Dot
Line Style (color) - Set the color for this rolling value
M15
Enable - Toggle to show or hide the 15 minute rolling value. Default is disabled
Line Width - Default is 1
Line Style - Choose between Solid, Dash, Dot, Dash dot, or Dash dot dot. Default is Dash
Line Style (color) - Set the color for this rolling value
M30
Enable - Toggle to show or hide the 30 minute rolling value. Default is disabled
Line Width - Default is 1
Line Style - Choose between Solid, Dash, Dot, Dash dot, or Dash dot dot. Default is Solid
Line Style (color) - Set the color for this rolling value
Summary
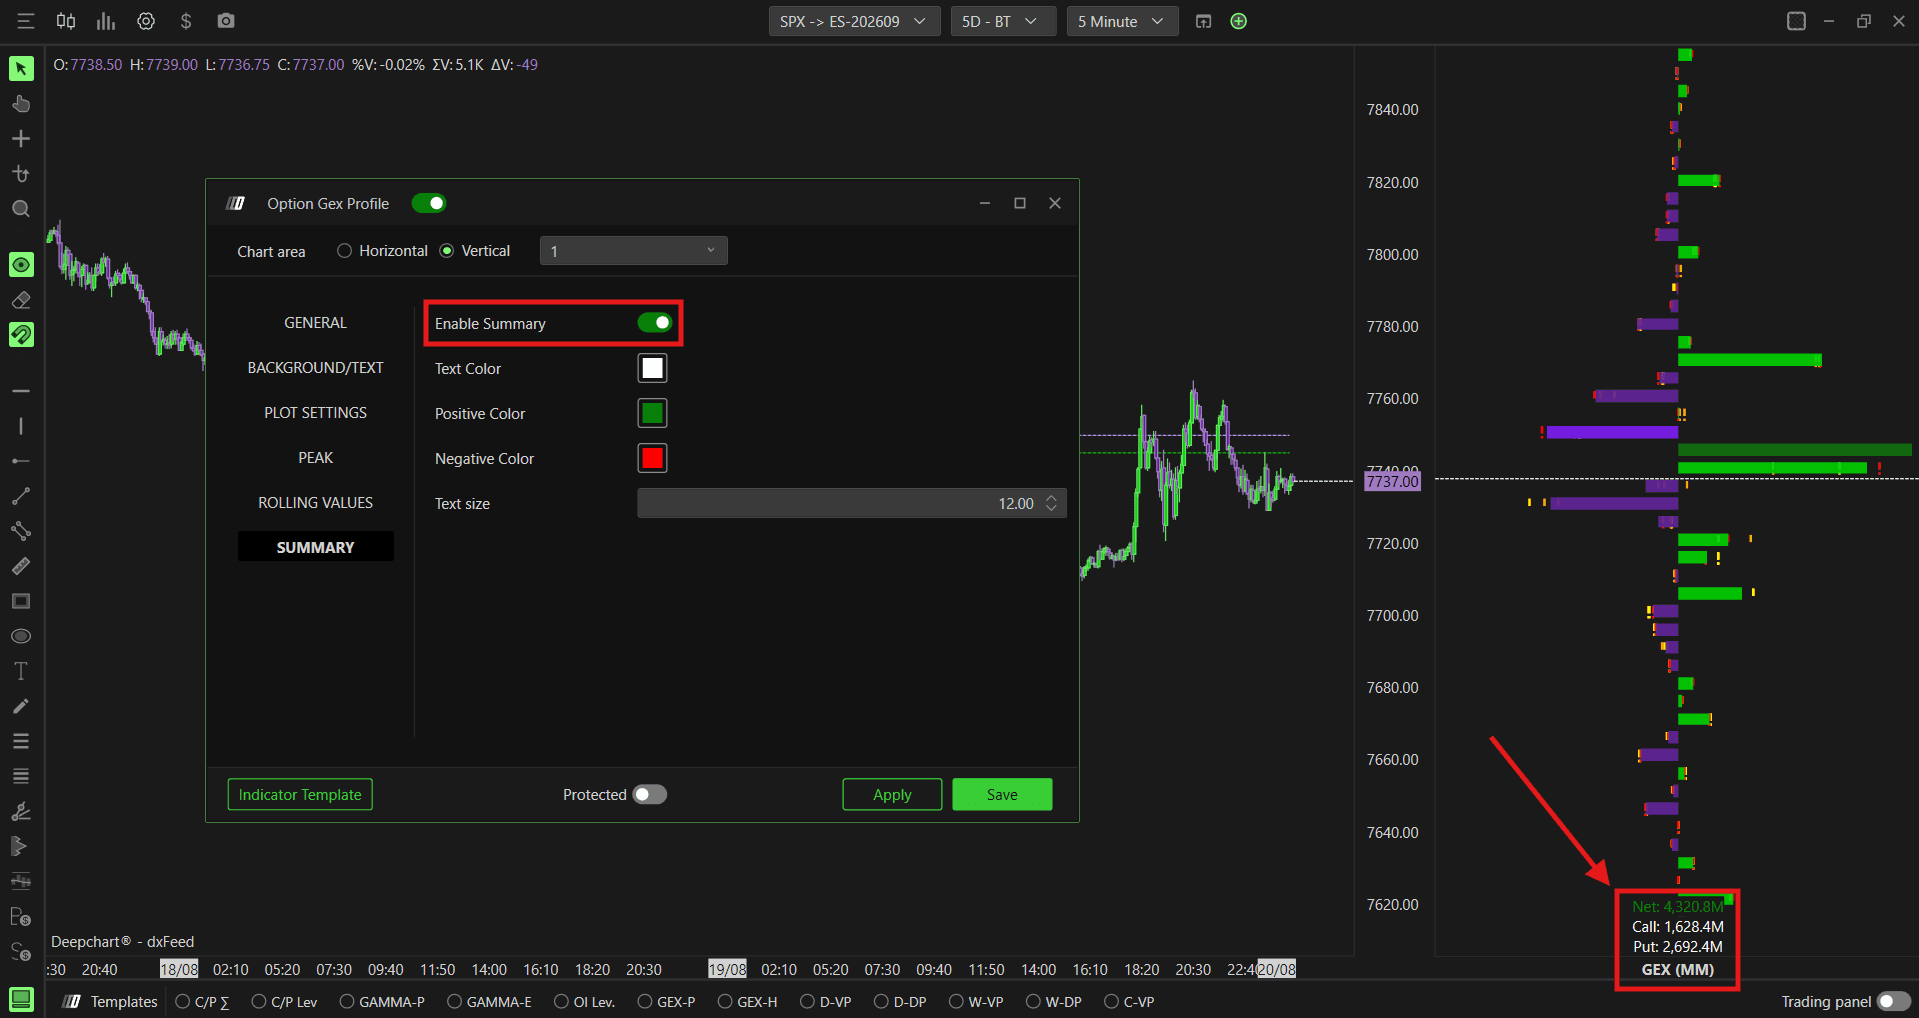
The Summary section displays running total values directly on the chart, based on your selected Data source, giving you a quick net read without scanning the full profile.
Enable Summary - Toggle to show or hide the summary values on the chart. Default is disabled
Text Color - Set the color for the summary text. Default is white
Positive Color - Set the color for positive summary values. Default is green
Negative Color - Set the color for negative summary values. Default is red
Text size - Set the font size for the summary text. Default is 12.00
Example - How to Use Option Gex Profile
Once added to your chart, the Option Gex Profile appears as a vertical panel on the right side. Here is a simple way to read it:
Start with the auction itself. Use volume profile and price action to identify where the market has accepted or rejected value, and where key structural levels already sit. This gives you the context of what the market is actually doing before you bring options data into the picture
Then overlay the Gex Profile to see where dealer positioning is concentrated relative to those levels. When a significant strike lines up with a level the market has already shown interest in, it adds weight to that area, but it does not guarantee a reaction. Price can slow down and reverse there, or it can push straight through, the auction can resolve either way
Confirm what is actually happening with order flow tools like Big Flows or a footprint chart. Watch for exhaustion or absorption to judge whether a level is holding, or continued aggression to judge whether it is likely to break
The profile supports several data sources, gamma exposure, delta exposure, net flow, and open interest, each highlighting a different type of dealer positioning. Switching between them changes what you are measuring, but the overall approach stays the same, use it as context alongside the auction, not as a standalone signal
Backtest and forward test how price behaves around these levels over time. Markets have their own rhythm, and building a feel for how a specific level type reacts in different conditions takes repeated observation, not a single rule
Any Questions?
Our support team is available 24/7 and ready to help you with any question.
When reaching out, please include:
Screenshot (if any)
Briefly describe the assistance or support you require
DeepCharts Live Support - Chat with our agents directly using the live chat box on www.deepcharts.com, or click here for 24/7 Live Chat for immediate access.
Email Support - Reach us at support@deepcharts.com - please note that email responses may take a little longer than a live support chat.
