Updated:
Option Summary displays the net gamma exposure (GEX) for the session as an oscillator, showing whether the market is in a positive or negative gamma regime at any given moment. It also includes an optional marker feature that highlights the price chart itself with colored bands, making regime shifts easy to spot without switching between panels.
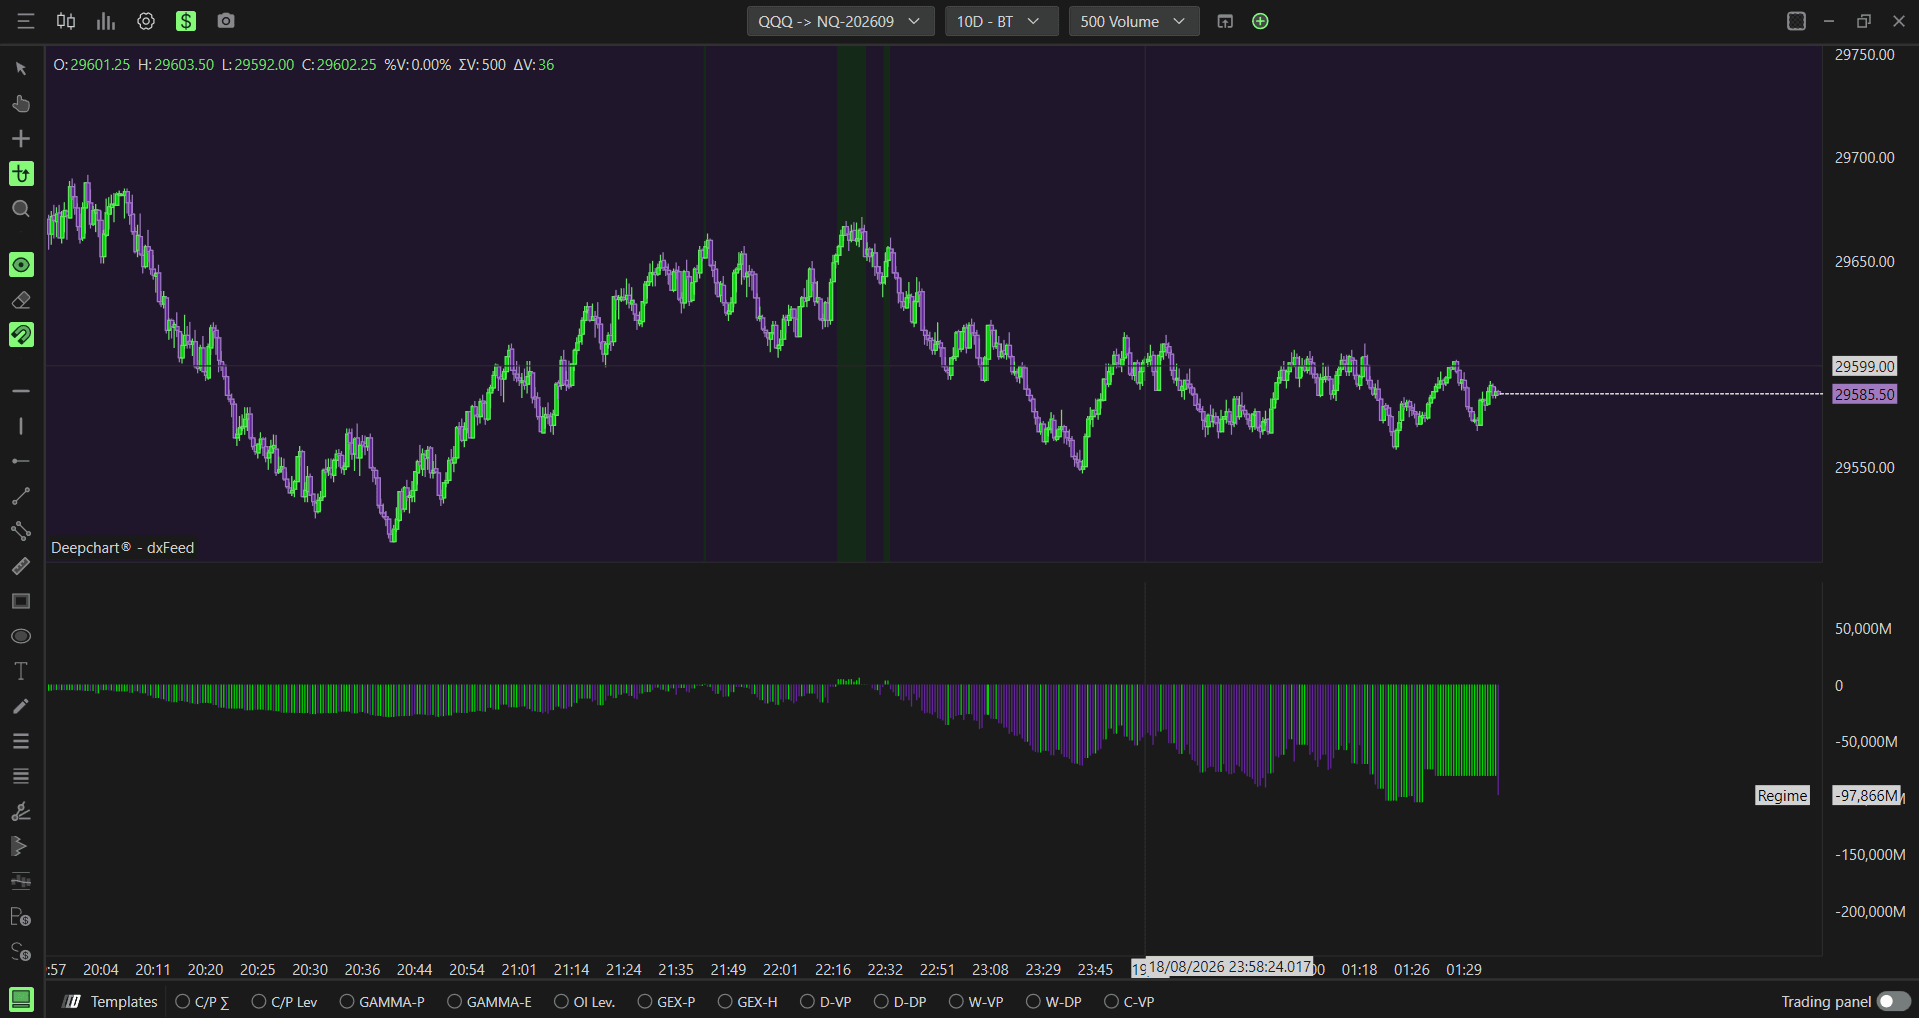
Note: Option Summary is available on NDX, QQQ, SPY, and SPX.

How to Add Option Summary
Go to New in the top menu
Click on Option Chart
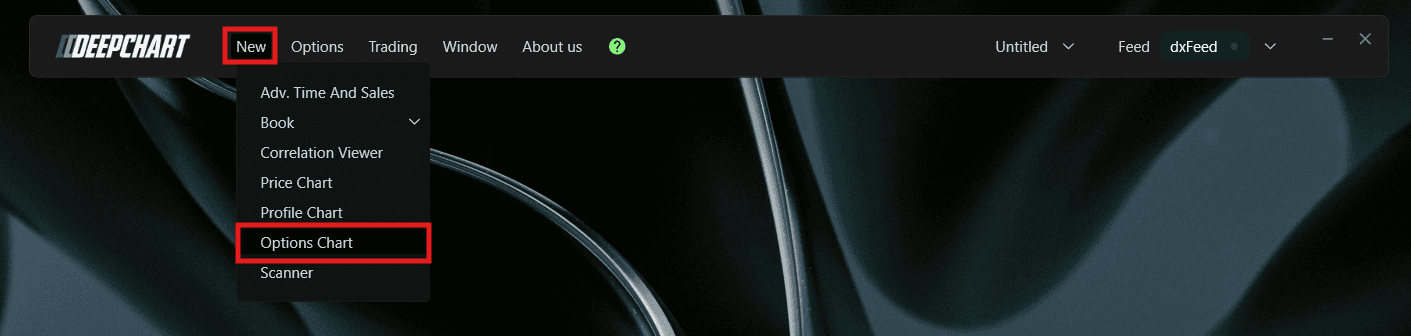
A Select Instrument dialog will appear with the following options:
NDX - Symbol: NQ-CME, Exchange: CME
QQQ - Symbol: NQ-CME, Exchange: CME
SPX - Symbol: ES-CME, Exchange: CME
SPY - Symbol: ES-CME, Exchange: CME
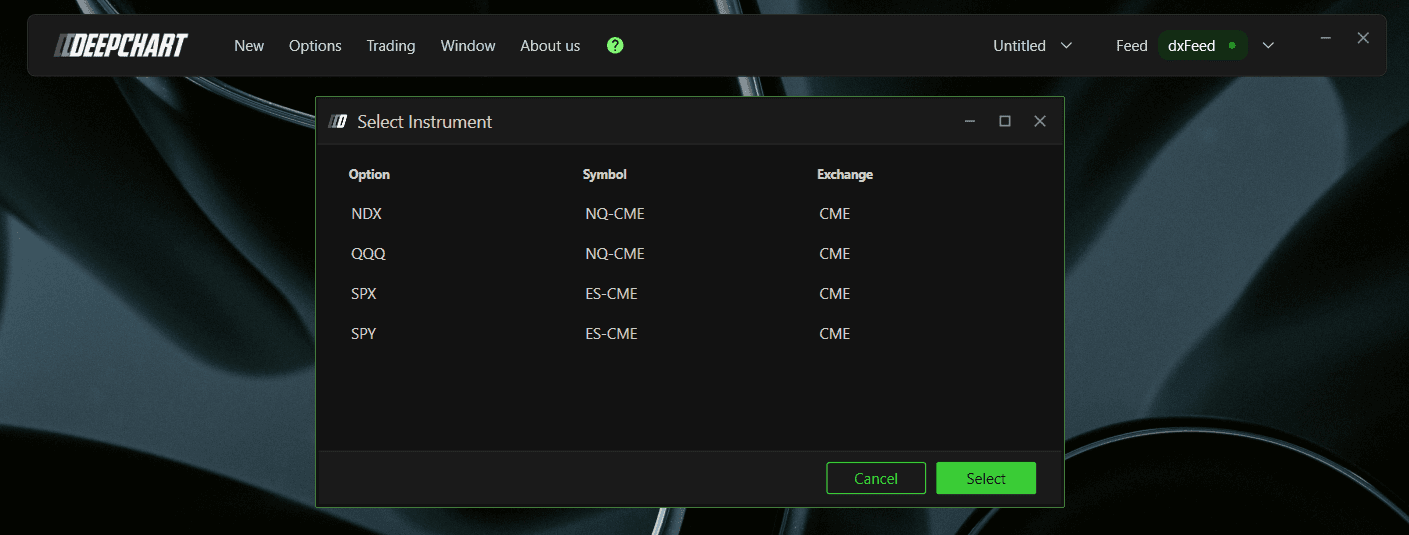
Select your preferred instrument and click to open the chart
Once the Option Chart is loaded, click the Indicator Add button on the chart toolbar
Search for Option Summary and click + to add it
Click the settings icon to open the configuration window
Understanding the Indicator
Option Summary plots a single oscillator below your price chart, showing the net gamma exposure for the session. Green bars indicate a positive gamma regime, where dealers are more likely to dampen price moves. Purple bars indicate a negative gamma regime, where dealers are more likely to amplify price moves.
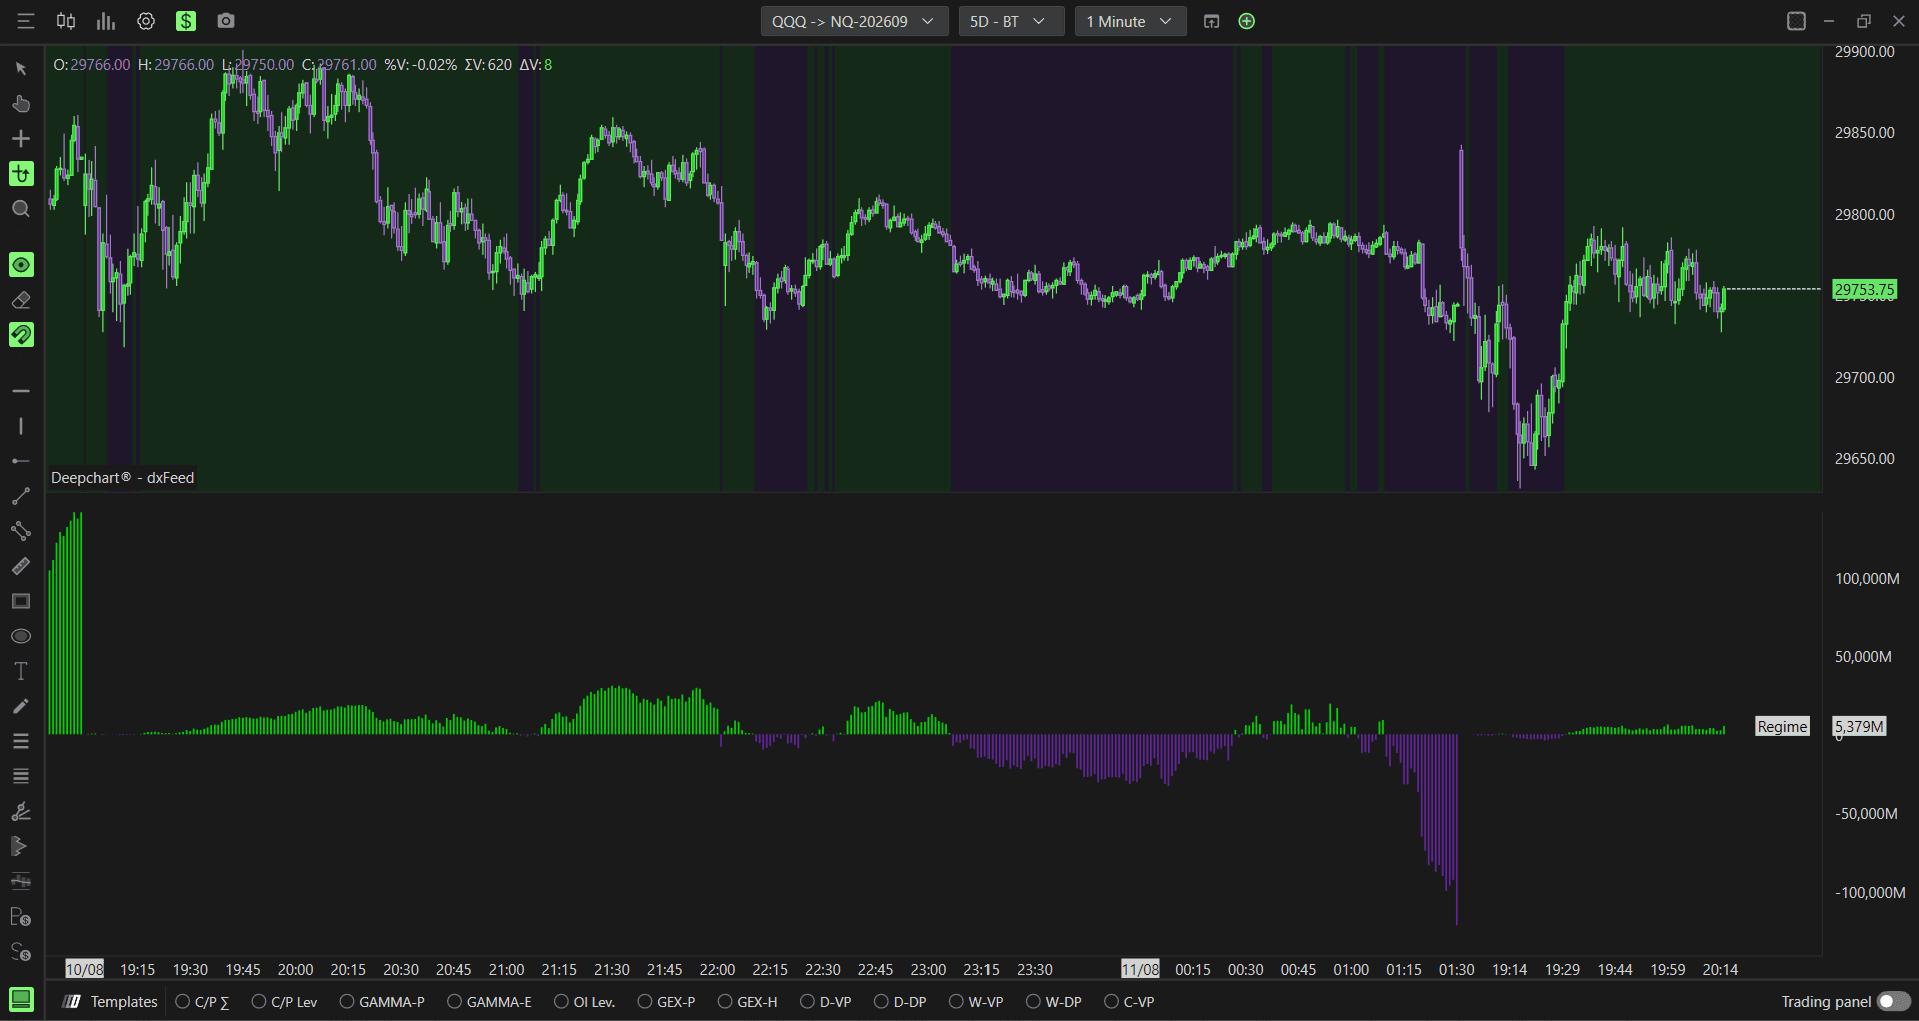
If the Marker feature is enabled, the same regime information is also painted directly onto the price chart as colored background bands, so you can read the regime at a glance without looking at the oscillator panel below.
Understanding Key Terms
Before choosing a data source, it helps to understand a few core options concepts:
Call - An option that gives the buyer the right to buy the underlying at a set price. Traders buy calls when they expect price to go up
Put - An option that gives the buyer the right to sell the underlying at a set price. Traders buy puts when they expect price to go down
Gamma - A measure of how much an option’s delta changes as price moves. High gamma means dealers need to hedge more aggressively as price approaches a strike, which is why gamma concentrations often act as support or resistance
GEX (Gamma Exposure) - An estimate of the gamma exposure dealers are carrying at a given strike, combining volume with the gamma greek to show where dealer hedging pressure is likely to be strongest
Settings
General
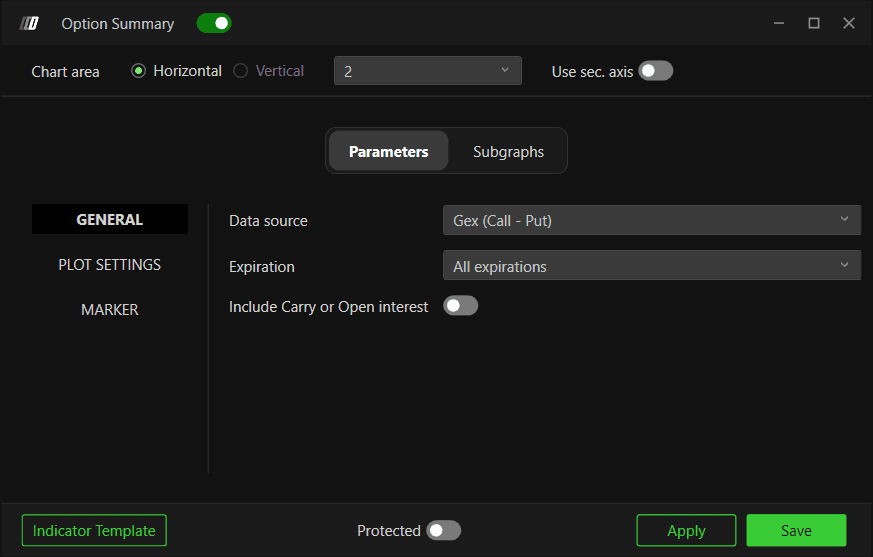
Data source - Gex (Call - Put) is the only data source available for Option Summary. It calculates net gamma exposure by taking call side gamma minus put side gamma at each strike, using the standard assumption that market makers are long calls and short puts. This gives you a single net value representing the overall gamma regime for the session, useful for a quick read on whether the market is in a positive or negative gamma regime without needing to look at individual strikes
Expiration - Filter the calculation by expiration. Options available: 0 DTE, <= 1d, <= 7d, <= 31d, <= 91d, All expirations. Default is All expirations
Include Carry or Open Interest - When enabled, includes open interest carried over from previous sessions into the calculation, giving you a broader view of total positioning. When disabled, only the current session data is considered. Default is disabled
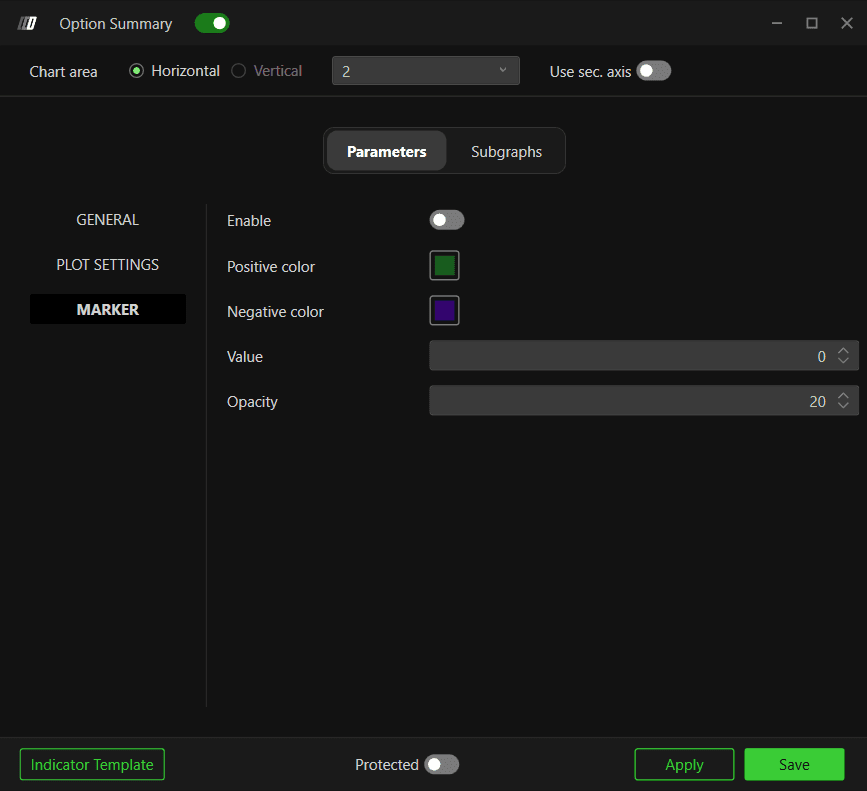
Marker
The Marker feature paints colored background bands directly on the price chart to highlight regime shifts, separate from the oscillator panel below the chart.
Enable - Toggle to show or hide the marker bands on the price chart. Default is disabled
Positive color - Set the background color for positive gamma regime periods. Default is green
Negative color - Set the background color for negative gamma regime periods. Default is purple
Value - Set the threshold value that triggers the marker to change color. Default is 0
Opacity - Set the transparency of the marker bands. Default is 20
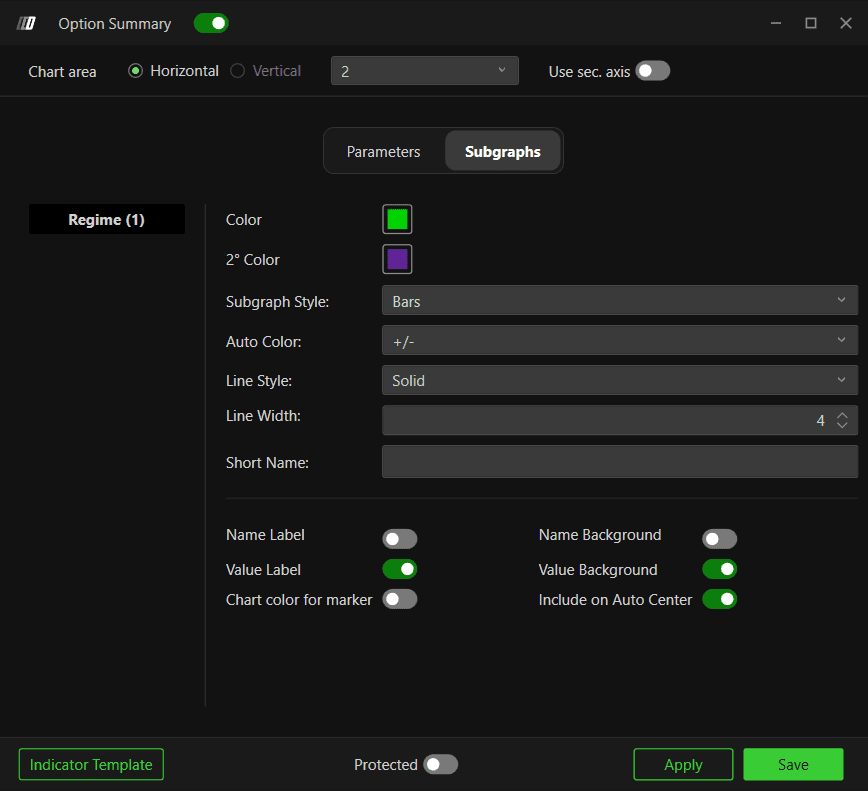
Subgraphs
Regime (1)
Color - Default is green
2° Color - Default is purple
Subgraph Style - Choose between Line, Bars, or Ignore. Default is Bars
Auto Color - Options: None, Slope, +/-. Default is +/-
Line Style - Choose between Solid or Dash. Default is Solid
Line Width - Default is 4
Short Name - Set a custom label for this series
Name Label - Toggle visibility of the name label. Default is disabled
Value Label - Toggle visibility of the value label. Default is enabled
Name Background - Toggle the name label background. Default is disabled
Value Background - Toggle the value label background. Default is enabled
Chart color for marker - Enable to use chart color for markers. Default is disabled
Include on Auto Center - Enable to include this series in auto centering. Default is enabled
Example - How to Use Option Summary
Once added to your chart, you will see a bar oscillator plotted below the price chart, along with optional colored bands on the price chart itself if the Marker feature is enabled. Here is a simple way to use it:
When the oscillator is green and the market is in a positive gamma regime, expect price action to be more compressed. Breakouts are more likely to fade and get pulled back toward the range
When the oscillator turns purple and the market shifts into a negative gamma regime, expect more volatile and directional price action, since dealer hedging tends to amplify moves in this regime
Watch for the moment the oscillator crosses from positive to negative or vice versa. This transition often lines up with a shift in market character and can be a useful cue to adjust your trading approach for the session
Enable the Marker feature if you want the regime to be visible directly on the price chart without needing to check the oscillator panel separately
Any Questions?
Our support team is available 24/7 and ready to help you with any question.
When reaching out, please include:
Screenshot (if any)
Briefly describe the assistance or support you require
DeepCharts Live Support - Chat with our agents directly using the live chat box on www.deepcharts.com, or click here for 24/7 Live Chat for immediate access.
Email Support - Reach us at support@deepcharts.com - please note that email responses may take a little longer than a live support chat.
