Indicatori
Updated:
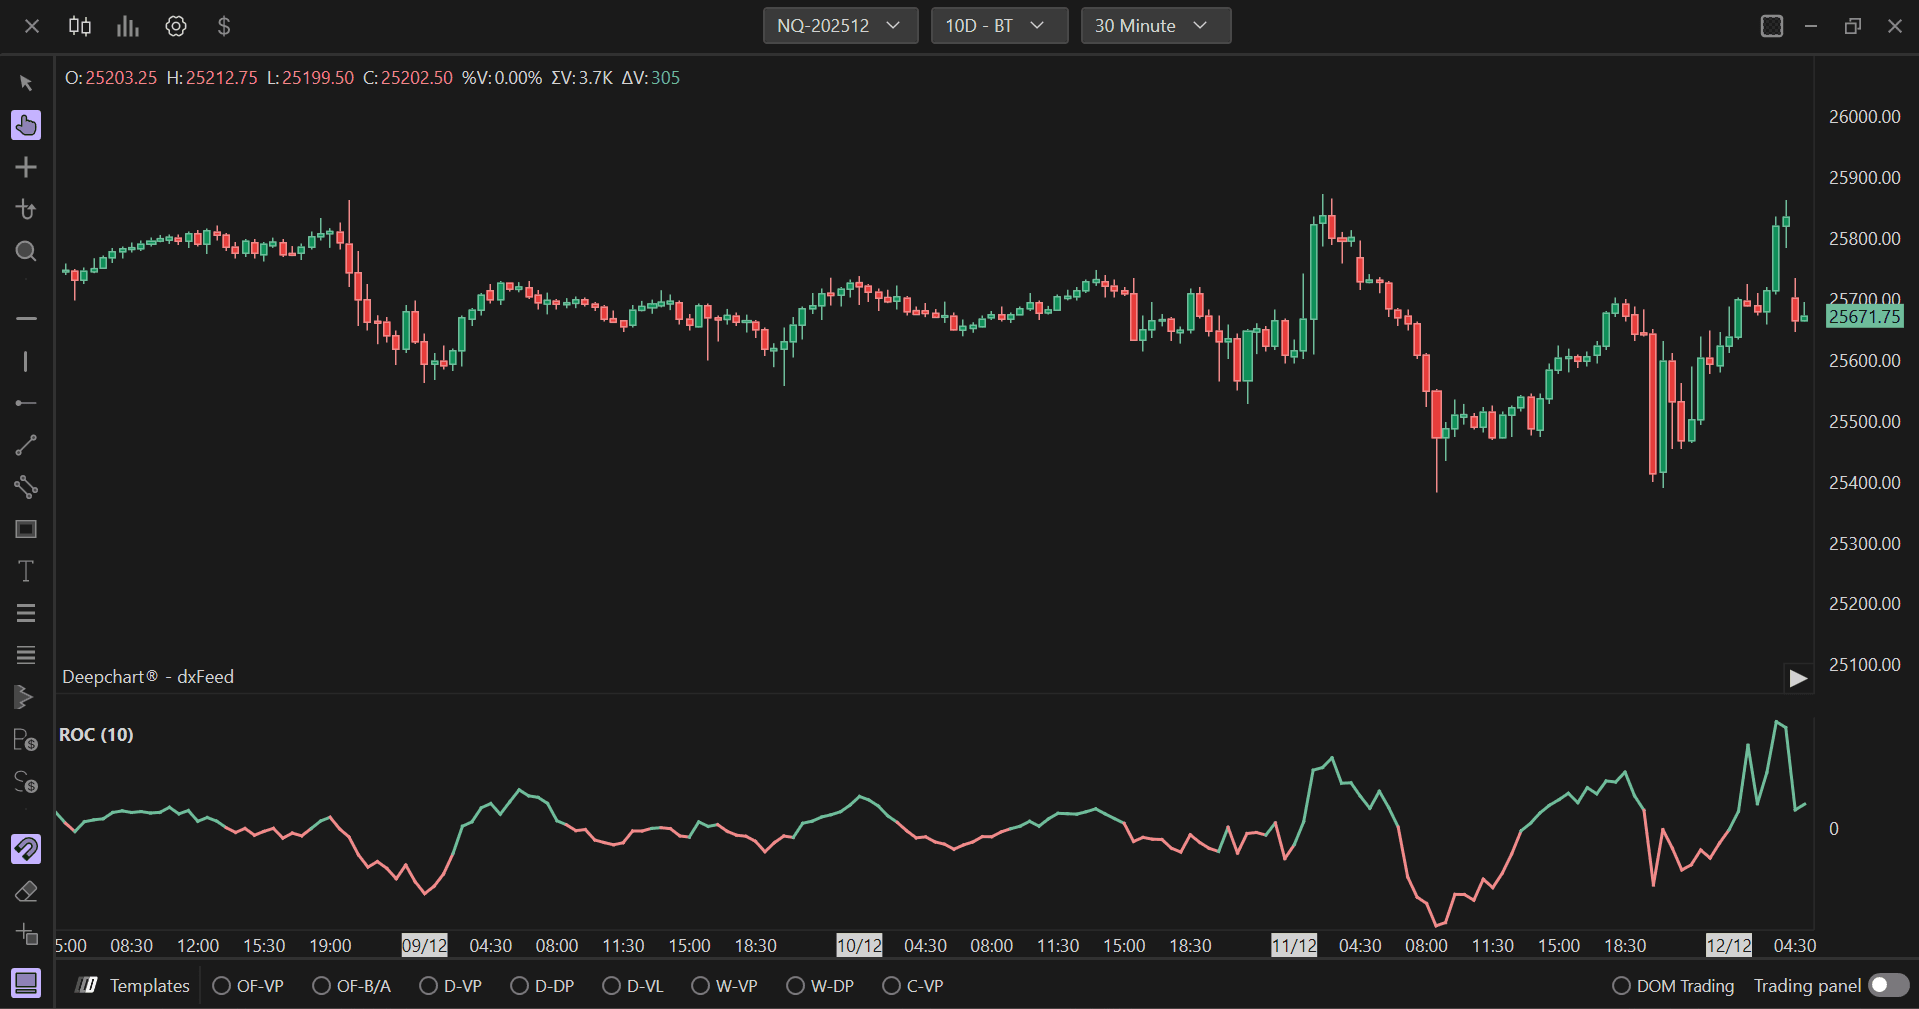
L ROC (Rate of Change) è un indicatore di analisi tecnica che misura la variazione percentuale del prezzo di un asset in un dato periodo di tempo.
Viene utilizzato per determinare la velocità con cui il prezzo sta cambiando, fornendo così indicazioni sulla forza o debolezza di un trend in corso. È un indicatore di momentum che può segnalare possibili inversioni di prezzo, condizioni di ipercomprato o ipervenduto e confermare la direzione di un trend.
Utilizzo delle impostazioni
Facendo clic sull'icona delle impostazioni dell'indicatore si aprirà la finestra di configurazione, all'interno della quale potrai effettuare diverse scelte relative al funzionamento dell'indicatore.
Parametri
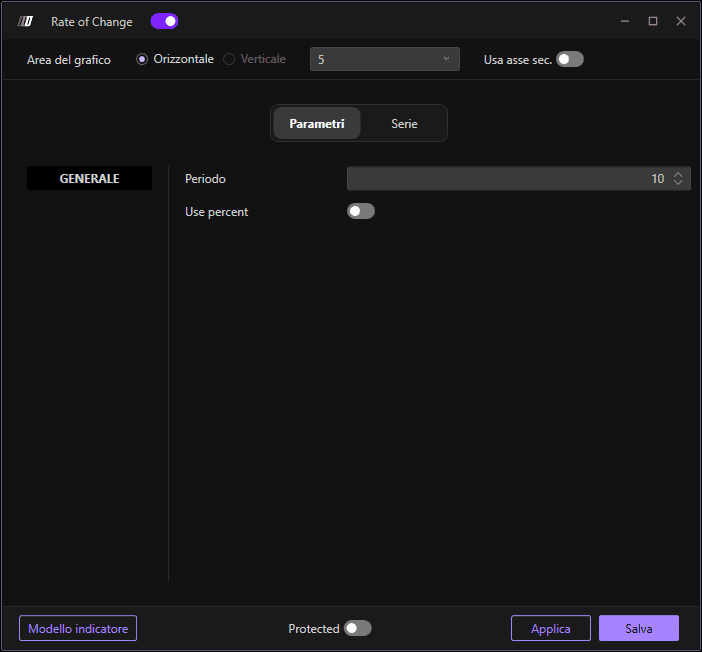
Nella sezione Parametri puoi modificare:
Periodo: Il numero di periodi utilizzati per il calcolo del ROC (predefinito: 10)
Usa percentuale: Attiva per visualizzare il ROC come valore percentuale o come variazione assoluta
Subgrafici
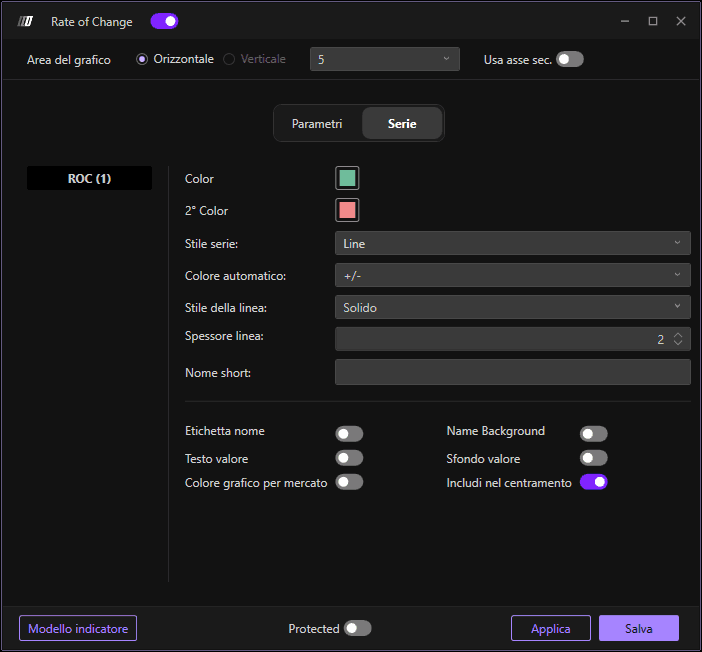
Nella sezione Subgrafico puoi modificare lo stile e i colori del ROC:
Colore ROC: Imposta il colore della linea ROC
Colore secondario: Imposta un colore secondario opzionale
Stile del subgrafico: Scegli lo stile di visualizzazione
Stile della linea: Definisci lo stile della linea
Spessore della linea: Definisci lo spessore della linea dell'indicatore
Usa asse secondario: Opzione per visualizzare su un asse secondario