Indicatori
Updated:
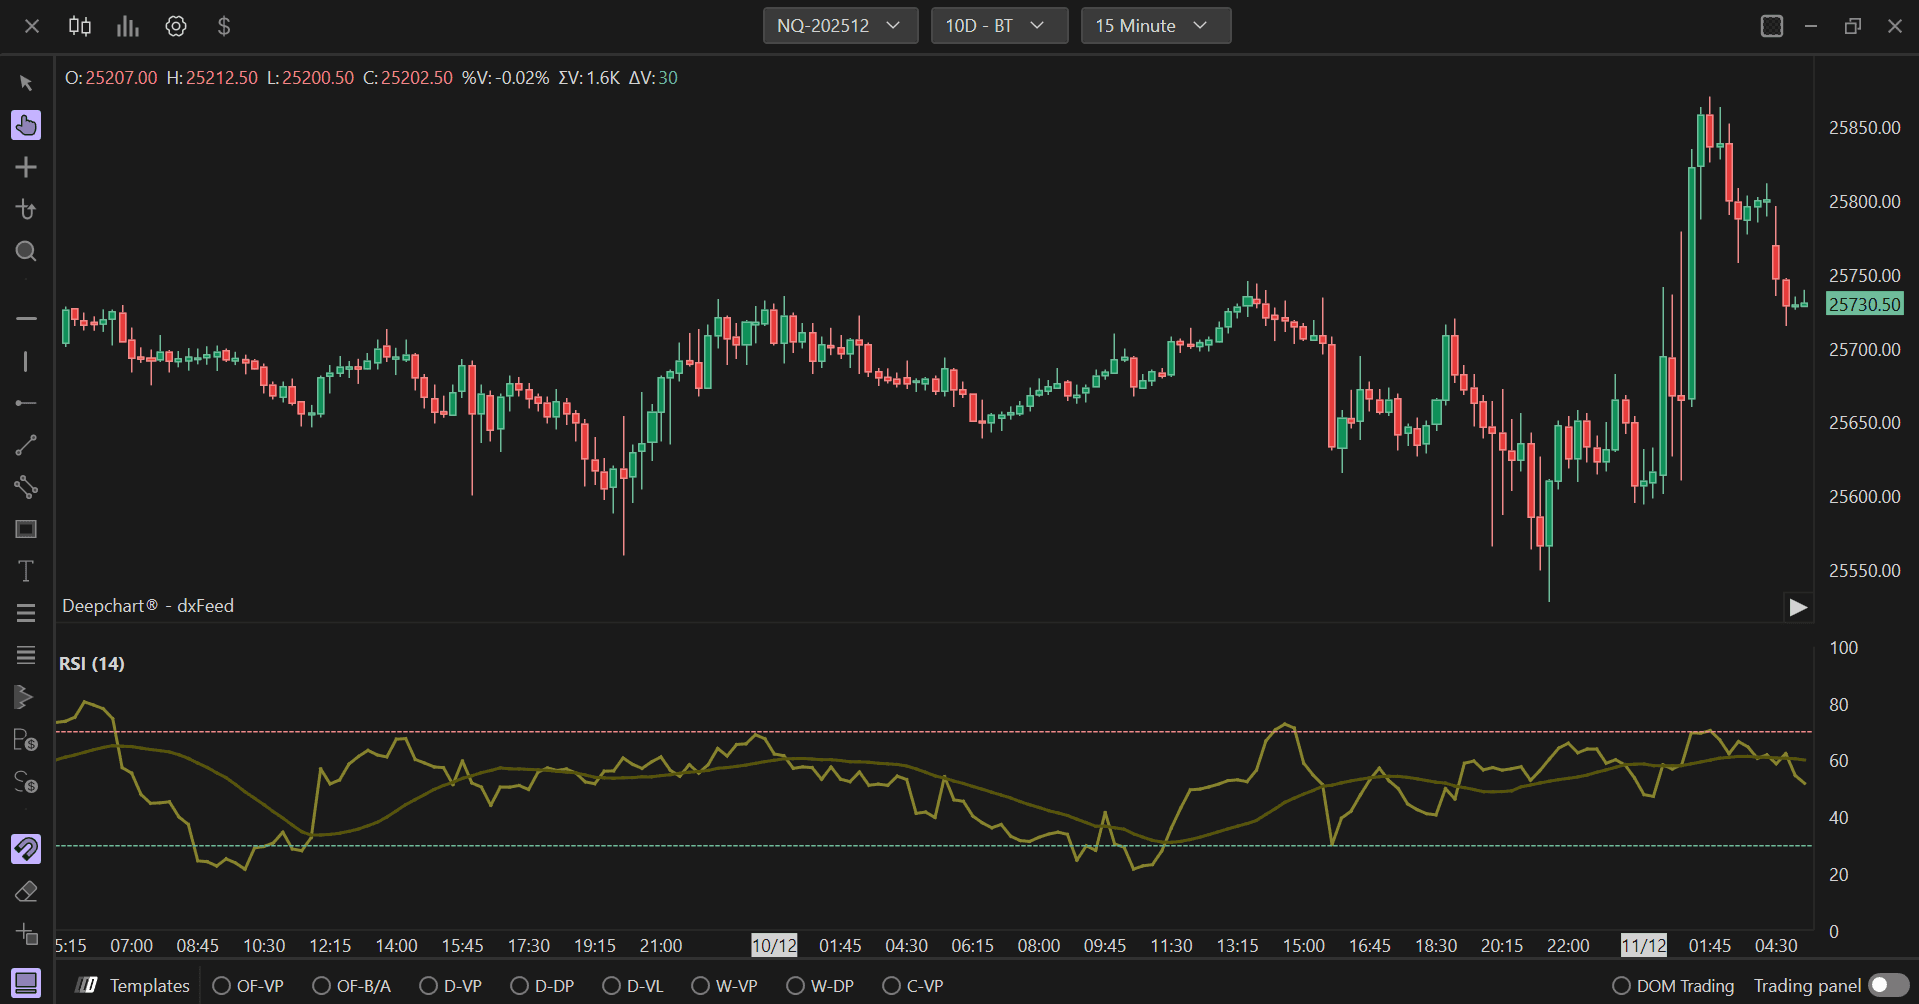
L' RSI (Indice di Forza Relativa) è uno degli indicatori di analisi tecnica più popolari e viene utilizzato per misurare la forza o la debolezza del prezzo di un asset in un dato periodo di tempo.
L'RSI è un indicatore di momentum sviluppato da J. Welles Wilder e varia su una scala da 0 a 100. Il suo scopo principale è identificare condizioni di ipercomprato o ipervenduto, che possono indicare un'inversione o una fase di consolidamento del prezzo. L'indicatore RSI confronta il valore assoluto dell'aumento del prezzo in un dato periodo di tempo con il suo livello di ribasso nello stesso periodo. Il risultato del calcolo viene mostrato sotto forma di curva sul grafico, con valori compresi tra 0% e 100%.
Utilizzo delle impostazioni
Facendo clic sull'icona delle impostazioni dell'indicatore si aprirà la relativa finestra di configurazione, all'interno della quale è possibile effettuare diverse scelte riguardo al funzionamento dell'indicatore.
Parametri
La sezione Parametri è suddivisa in alcune sottosezioni:
Generale
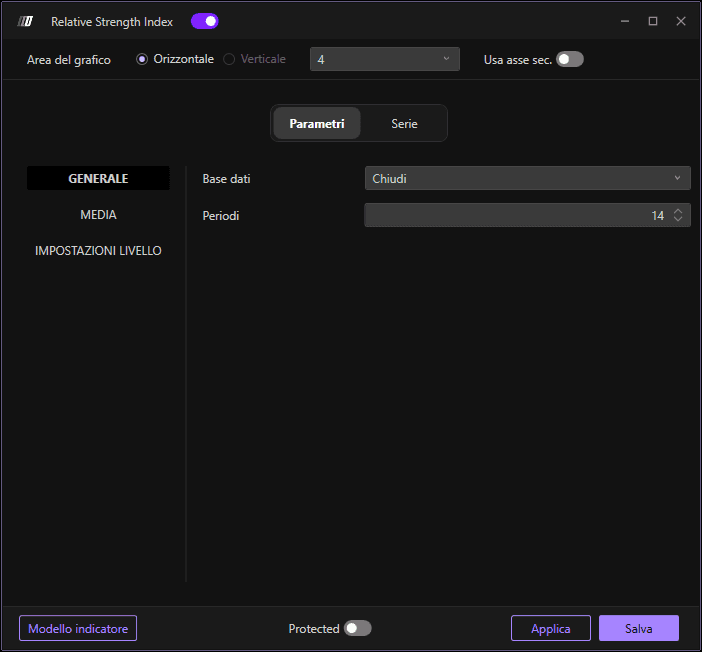
Consente di selezionare:
Dati di input: I dati di prezzo da utilizzare per il calcolo
Lunghezza: Il numero di periodi per il calcolo dell'RSI (predefinito: 14 )
Media
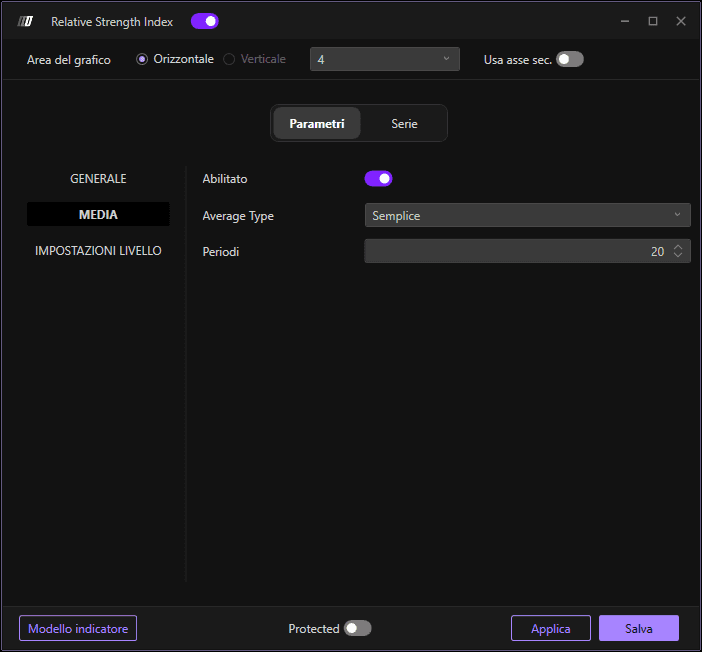
Consente di:
Abilita: Attiva o disattiva la media
Tipo di media: Scegli il metodo di media
Lunghezza: Imposta il numero di periodi per la media (predefinito: 20)
Impostazioni livelli
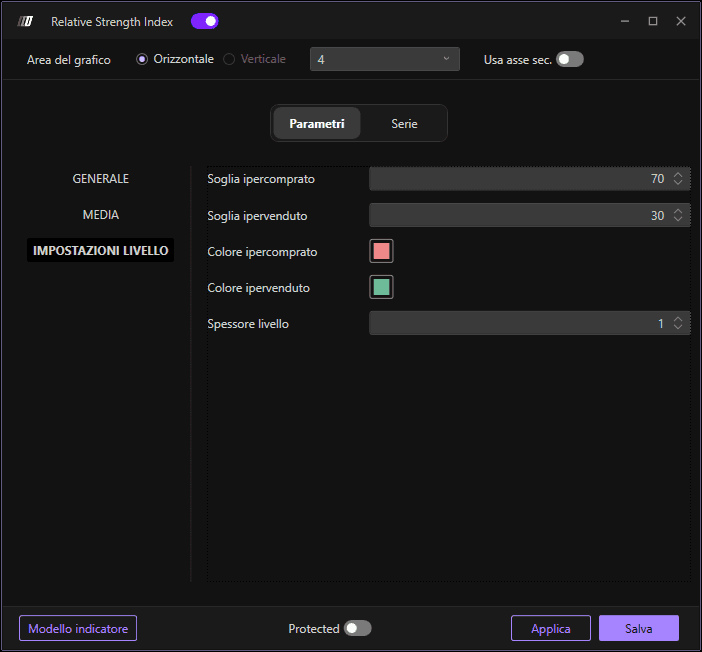
Consente di modificare i valori e lo stile:
Livello di ipercomprato: Imposta il livello di ipercomprato (predefinito: 70)
Livello di ipervenduto: Imposta il livello di ipervenduto (predefinito: 30)
Colore ipercomprato: Colore della linea di soglia dell'ipercomprato
Colore ipervenduto: Colore della linea di soglia dell'ipervenduto
Larghezza livello: Definisci la larghezza delle linee di soglia (predefinito: 10)
Sottografico
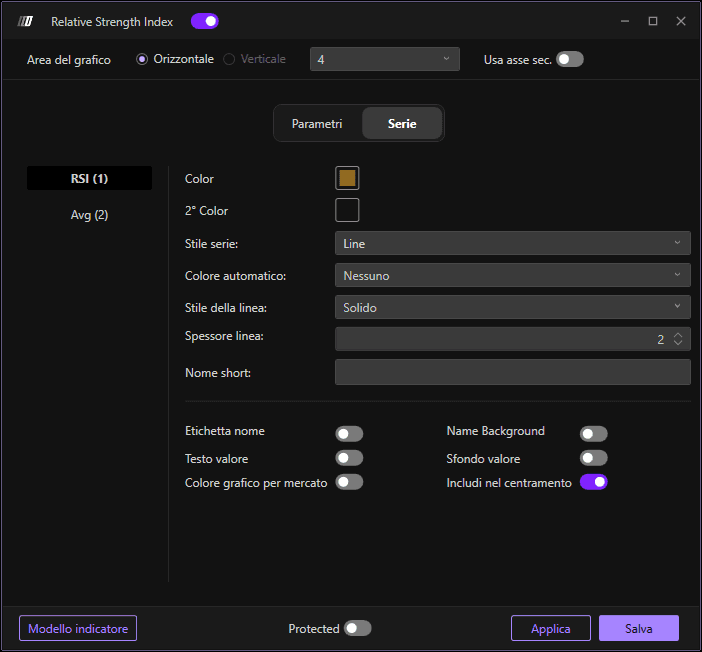
Nella sezione Sottografico, è possibile modificare i colori e lo stile del grafico RSI e della sua media:
Colore RSI: Imposta il colore della linea RSI
Colore media: Imposta il colore della linea della media
Colore secondario: Imposta un colore secondario opzionale
Stile sottografico: Scegli lo stile di visualizzazione
Stile linea: Definisci lo stile della linea
Larghezza linea: Definisci la larghezza delle linee dell'indicatore
Usa asse secondario: Opzione per visualizzare su un asse secondario