Indicators
Updated:
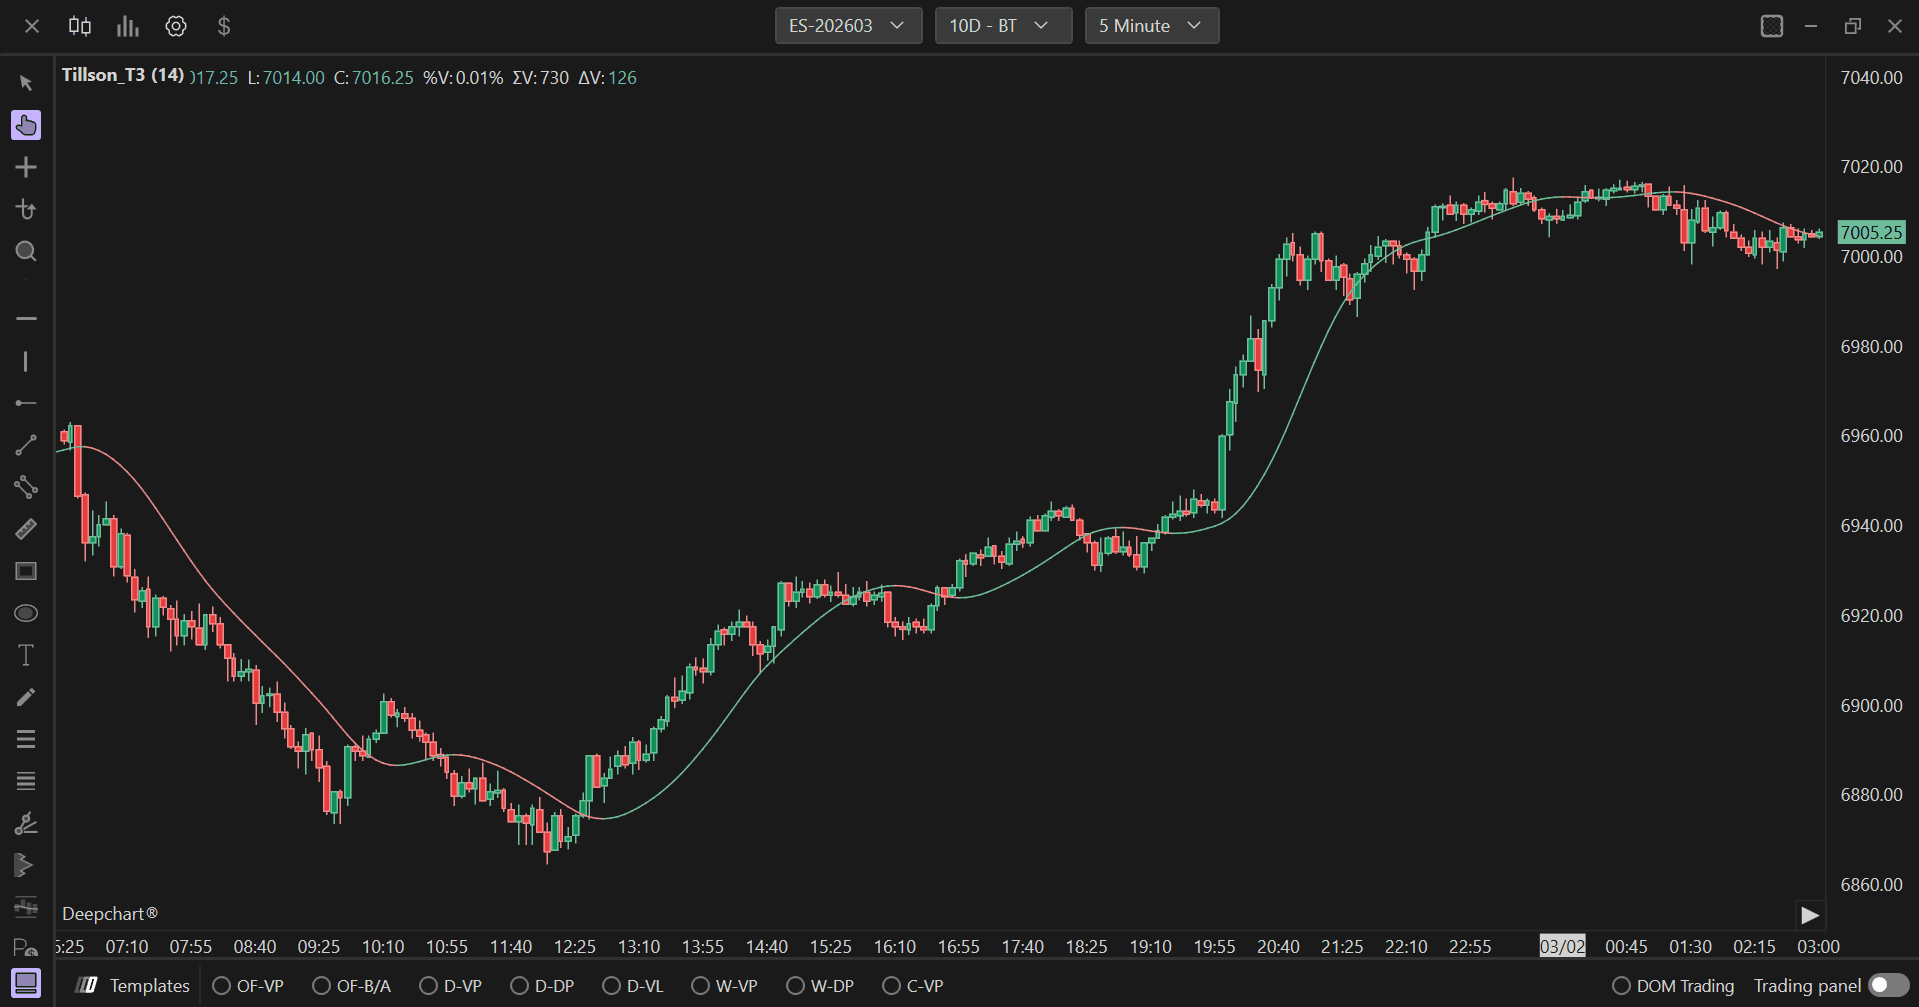
The Tillson T3 is an advanced smoothing indicator developed by Tim Tillson that provides superior lag reduction compared to traditional moving averages. It uses a sophisticated multi-stage exponential moving average calculation combined with a volume factor to create a highly responsive yet smooth trend-following indicator. The T3 indicator reduces noise while maintaining close tracking of price movements, making it particularly useful for identifying trend direction and potential entry/exit points with minimal delay.
Settings of Use
Clicking on the indicator's settings icon will open its configuration window, within which it will be possible to make several choices regarding the functionality of the indicator itself.
General
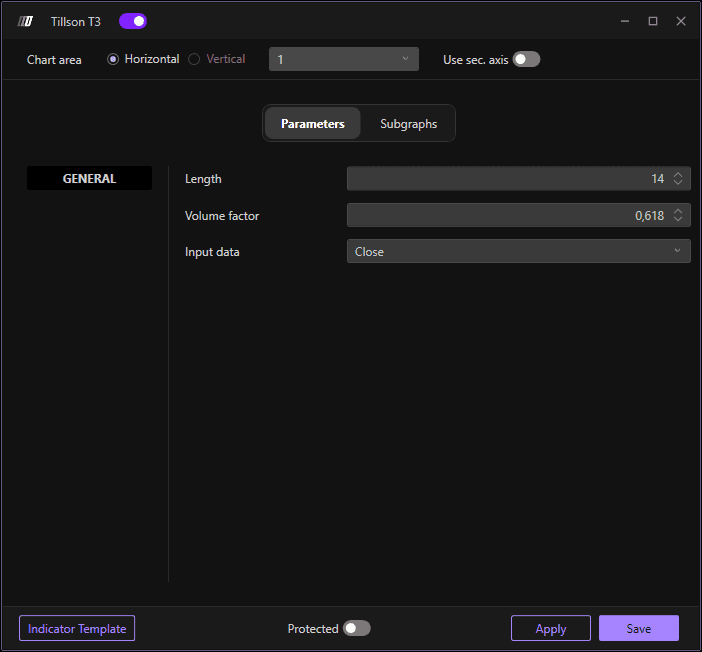
Length
Defines the period length for the T3 calculation. The default value is 14. This parameter determines how many bars are used in the smoothing process. The length should be adjusted based on your trading timeframe and the volatility of the instrument being analyzed.
Volume factor
Controls the smoothing characteristics of the T3 indicator. The default value is 0.618 (derived from the golden ratio). This parameter ranges typically between 0 and 1, affecting how aggressively the indicator smooths price data. Lower values (closer to 0) provide more smoothing and lag reduction, creating a more responsive indicator that closely tracks price movements. Higher values (closer to 1) increase smoothing strength, producing a smoother line that filters out more noise but may lag price action more. The default value of 0.618 provides an optimal balance between responsiveness and smoothness for most trading applications.
Input data
Specifies which price data point is used for the T3 calculation. The available options are:
High: Uses the high price of each bar, which may be more sensitive to upward price movements and breakouts.
Low: Uses the low price of each bar, which may be more sensitive to downward price movements and breakdowns.
Open: Uses the opening price of each bar, reflecting the initial price at which the bar began trading.
Close: Uses the closing price of each bar (default), which is typically considered the most important price point as it represents where the market settled for that period.
Volume: Uses volume data instead of price, creating a volume-weighted T3 indicator for analyzing volume trends.
The default "Close" setting is most commonly used as closing prices generally provide the most reliable signals for trend following and momentum analysis.
Subgraphs
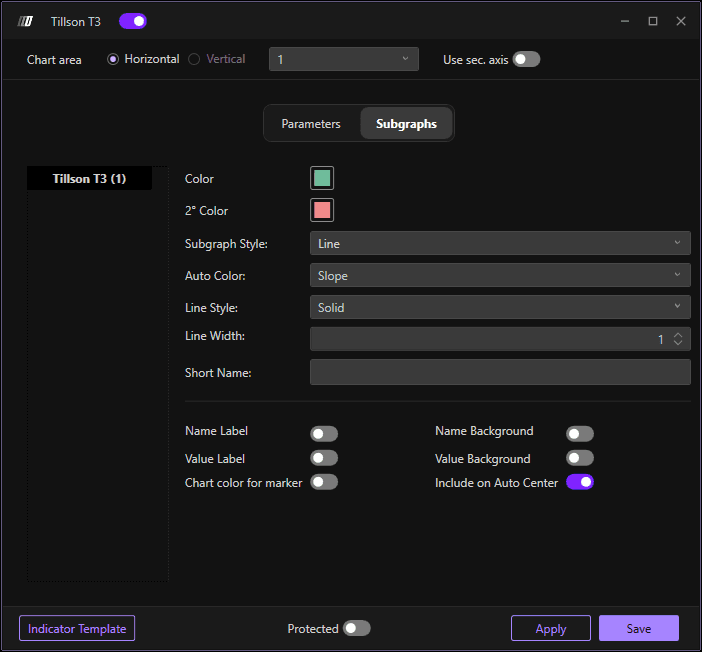
Color
Sets the primary color for the bullish Tillson T3 line.
2° Color
Sets the secondary color for the bearish Tillson T3 line,
Subgraph Style
Defines how the Tillson T3 data is displayed on the chart. The default is "Line" which shows the indicator as a smooth, continuous line connecting all calculated T3 values.
Auto Color
Determines the automatic coloring logic for the T3 line. Set to "Slope" to automatically change the line color based on whether the indicator is rising or falling.
Line Style
Sets the visual style of the T3 line. The default is "Solid" for a continuous, unbroken line that clearly shows the indicator's progression. Other option include dash which can be useful for distinguishing the T3 from other indicators when multiple tools are displayed on the same chart panel.
Line Width
Adjusts the thickness of the Tillson T3 line. The default value is 1. Increasing this value makes the line more prominent and easier to see, especially on larger screens or when presenting charts to others.
Short Name
Allows you to set a custom short name or label for the indicator that will appear on the chart legend.