Deep Indicators
Updated:
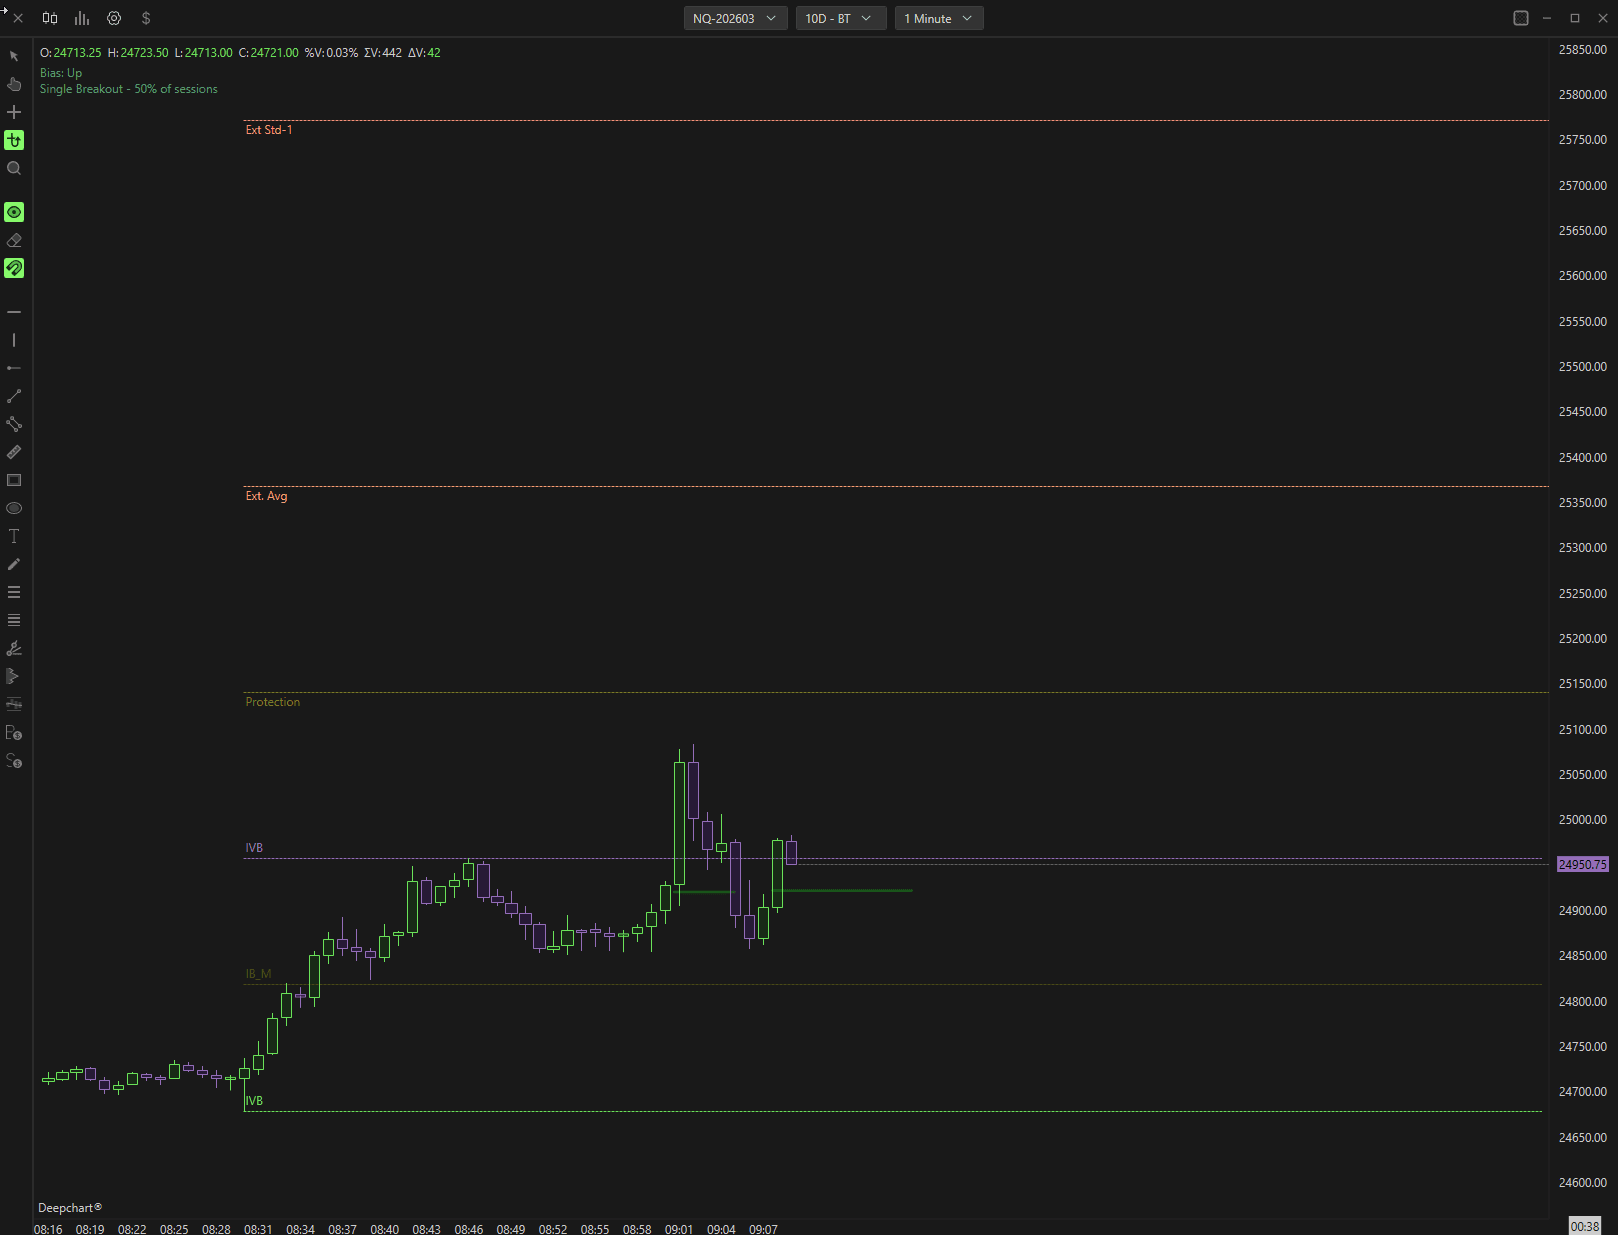
The indicator analyzes years of historical data and automatically plots high-probability projection, protection, and exit levels based on statistical probability calculations. Its objective is to provide traders with a structured, data-driven approach to the RTH opening range.
1. How to Apply the Indicator
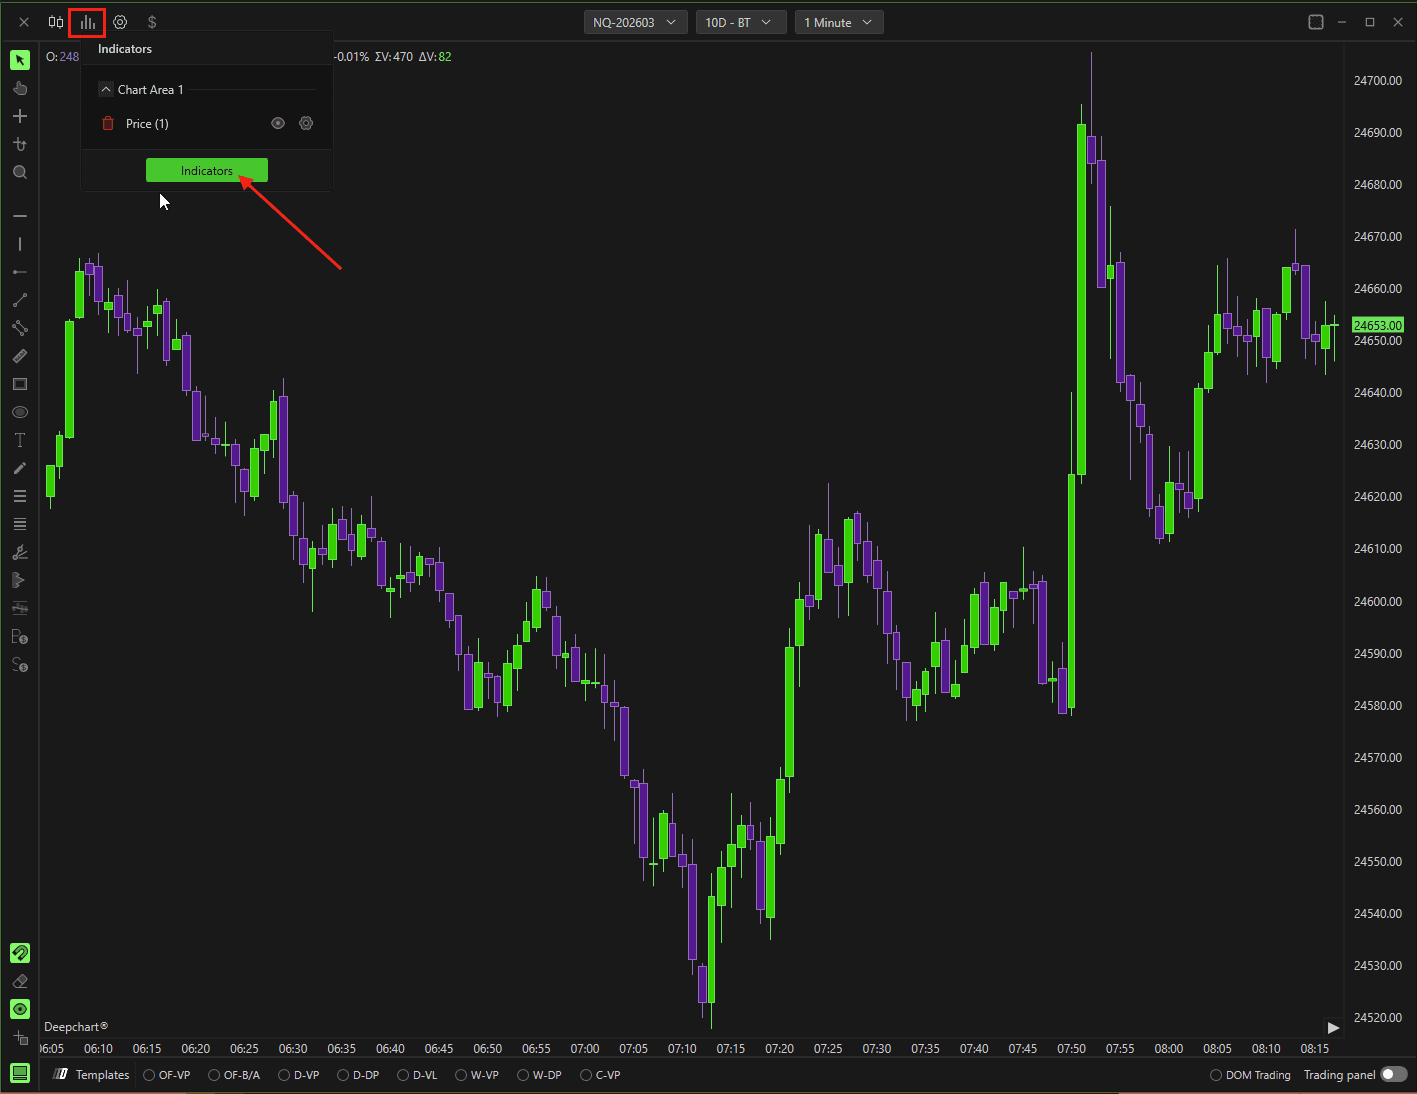
Open the Indicator List on your chart.
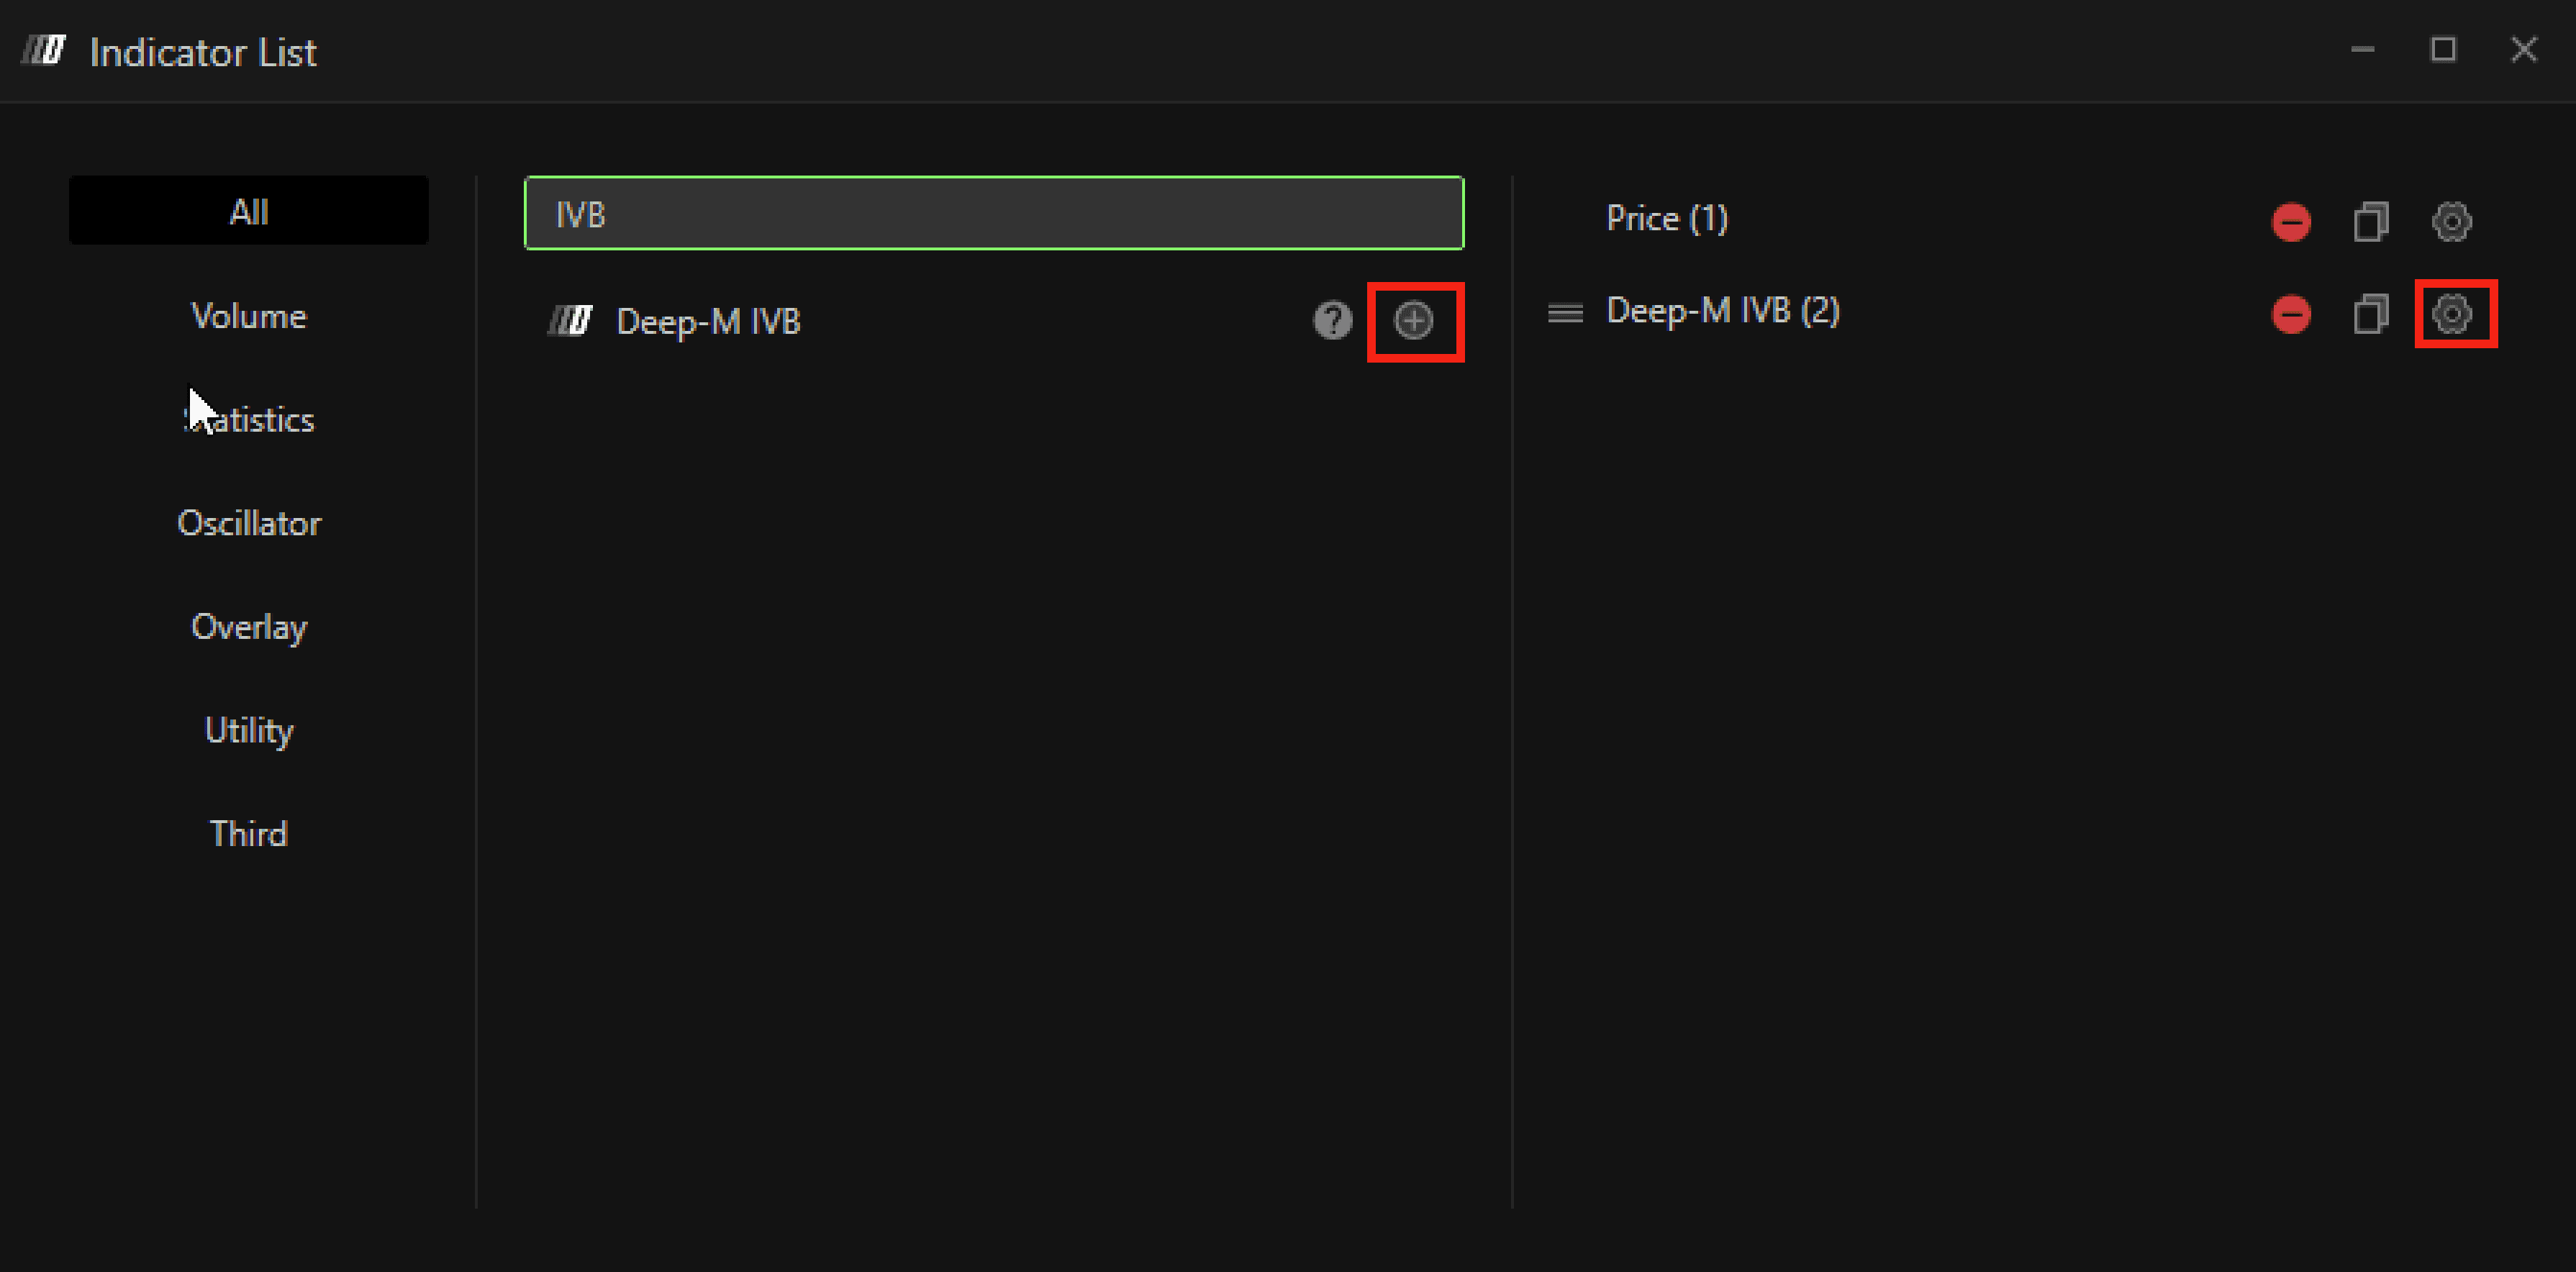
Search for Deep-M IVB.
Click + to apply it to your chart.
Open the Settings icon to configure the indicator if needed.
2. Settings
General Settings
Deep-M IVB is designed as a predefined, ready-to-use system, so configuration is intentionally minimal.
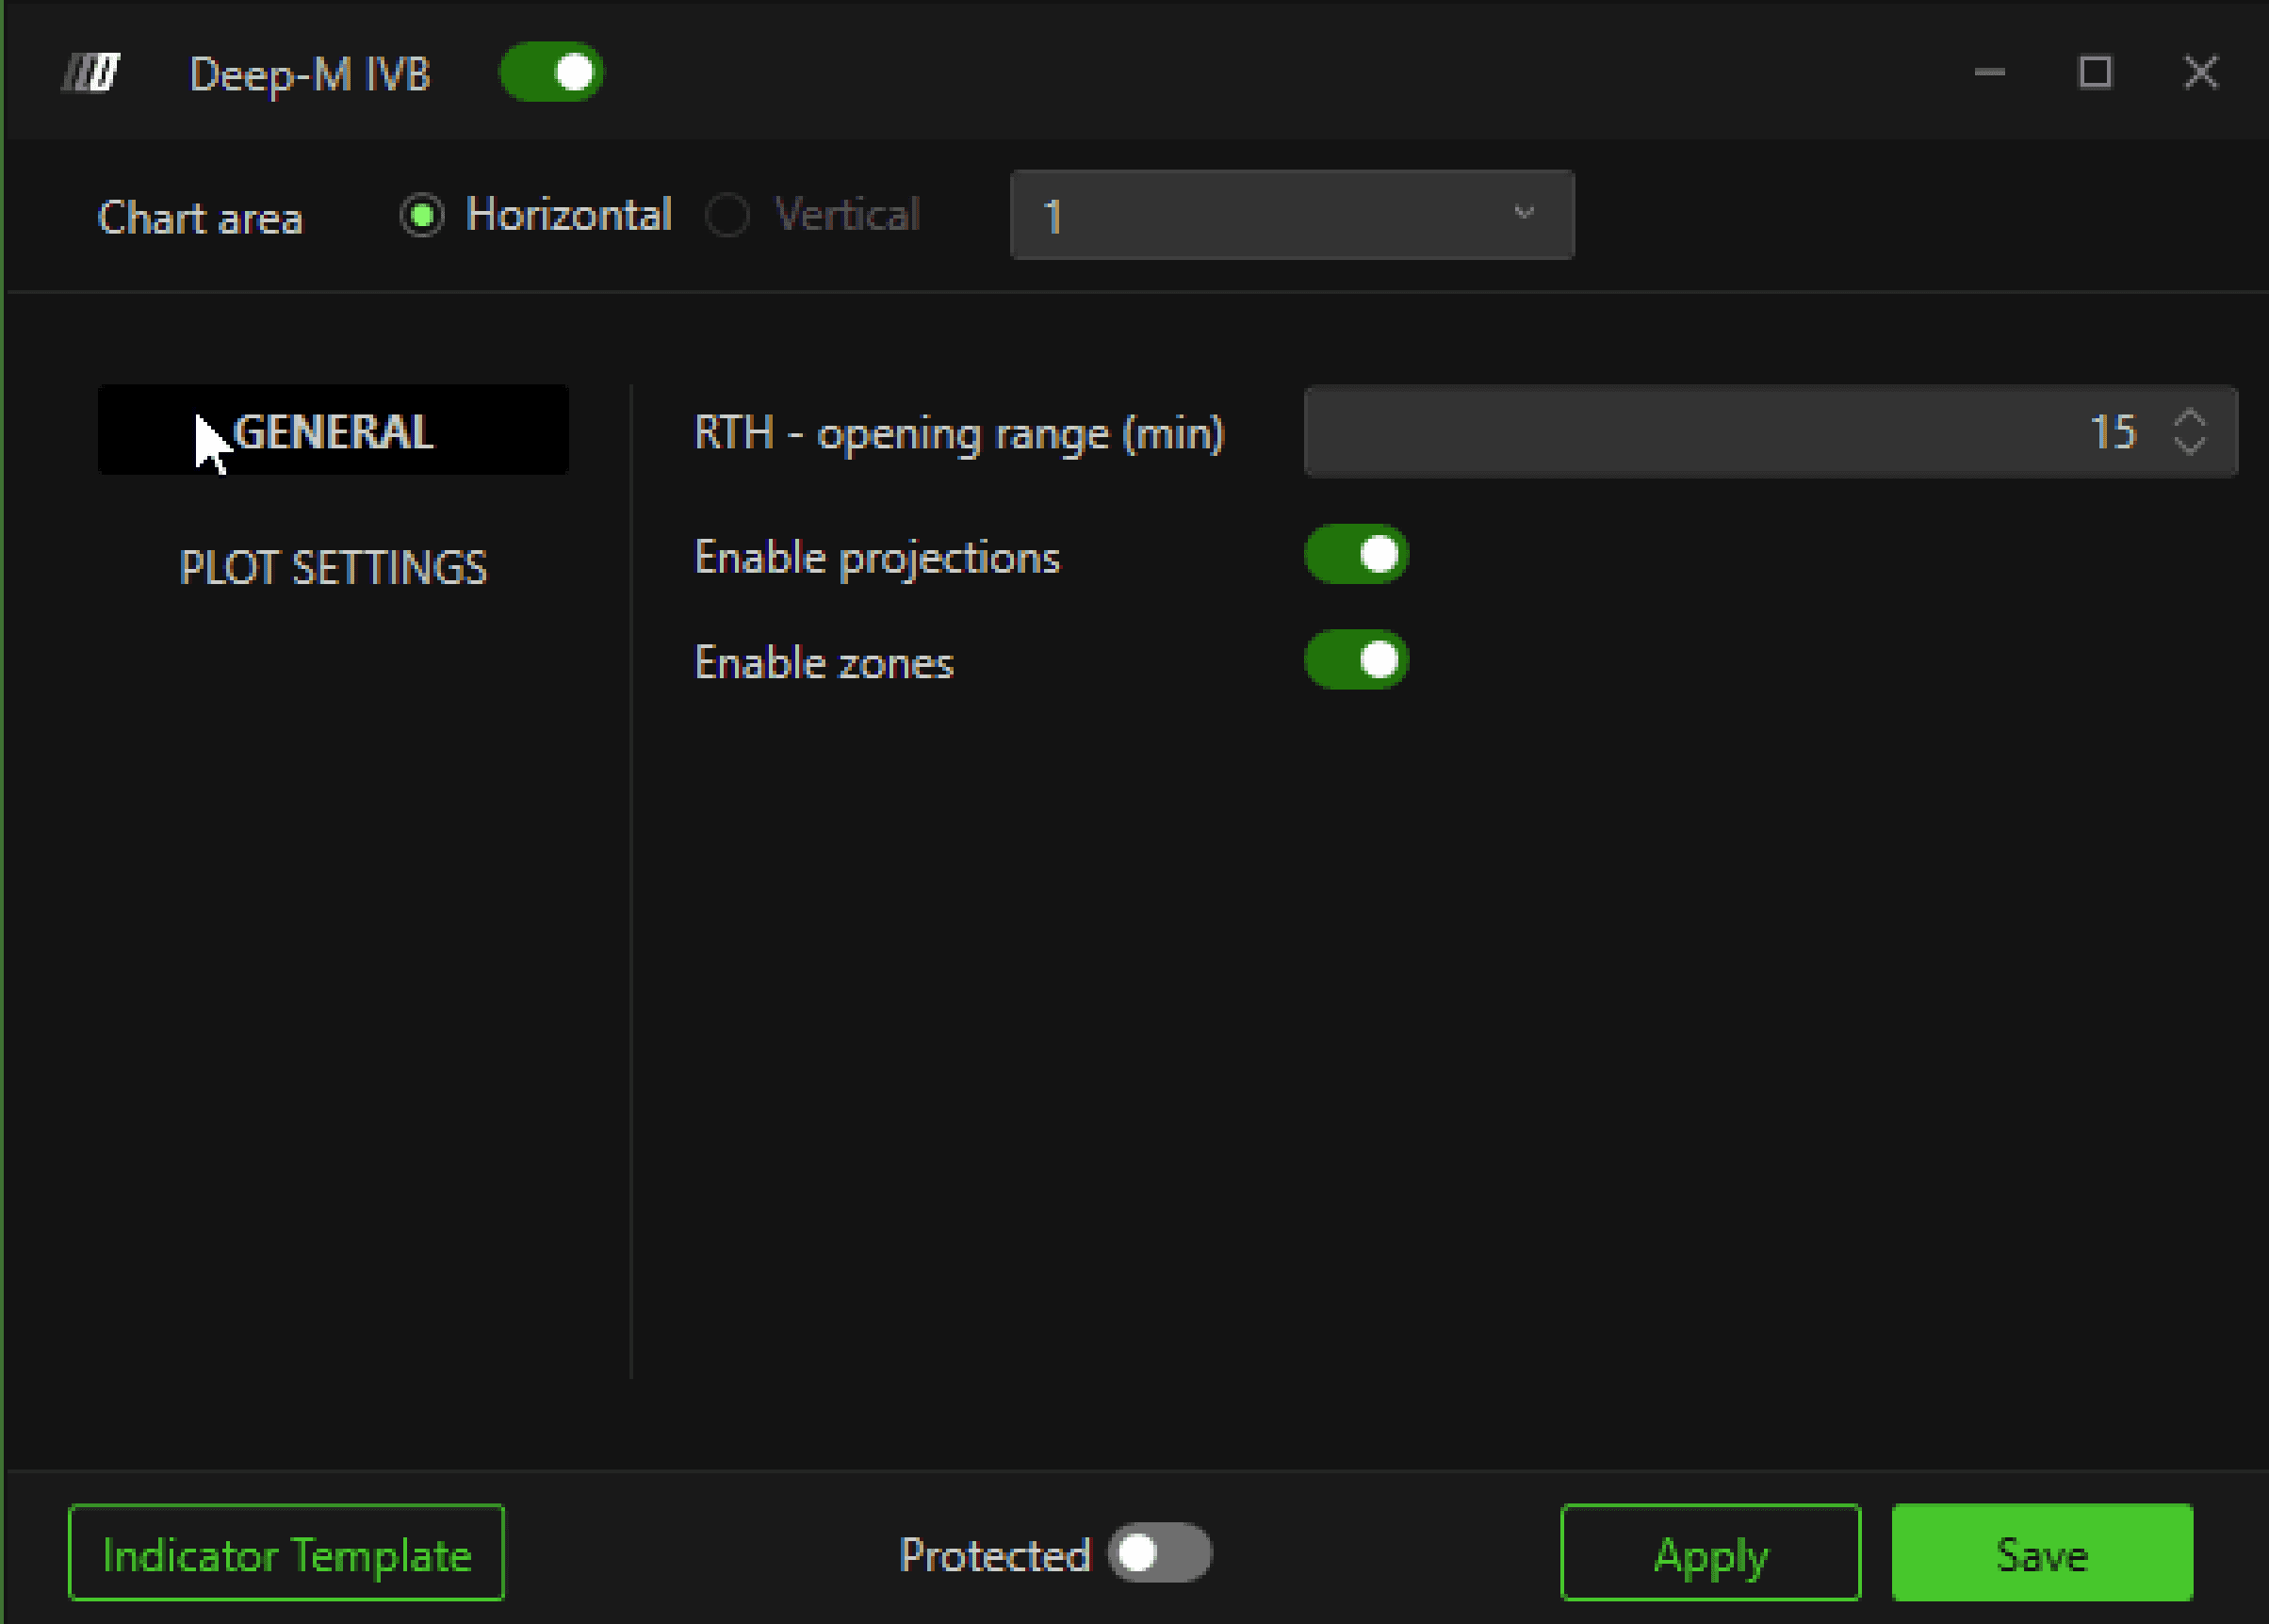
RTH Opening Range (Min)
Defines the number of minutes used to calculate the opening range.
Common values:
15 minutes
30 minutes (recommended by the team)
60 minutes
The selected duration determines the High, Low, and Mid levels that define the ORB structure.
Enable Protection
When enabled, the indicator plots protection and exit levels after the range is broken.
These levels are statistically derived and represent:
High-probability targets
Structured protection zones
Logical exit areas
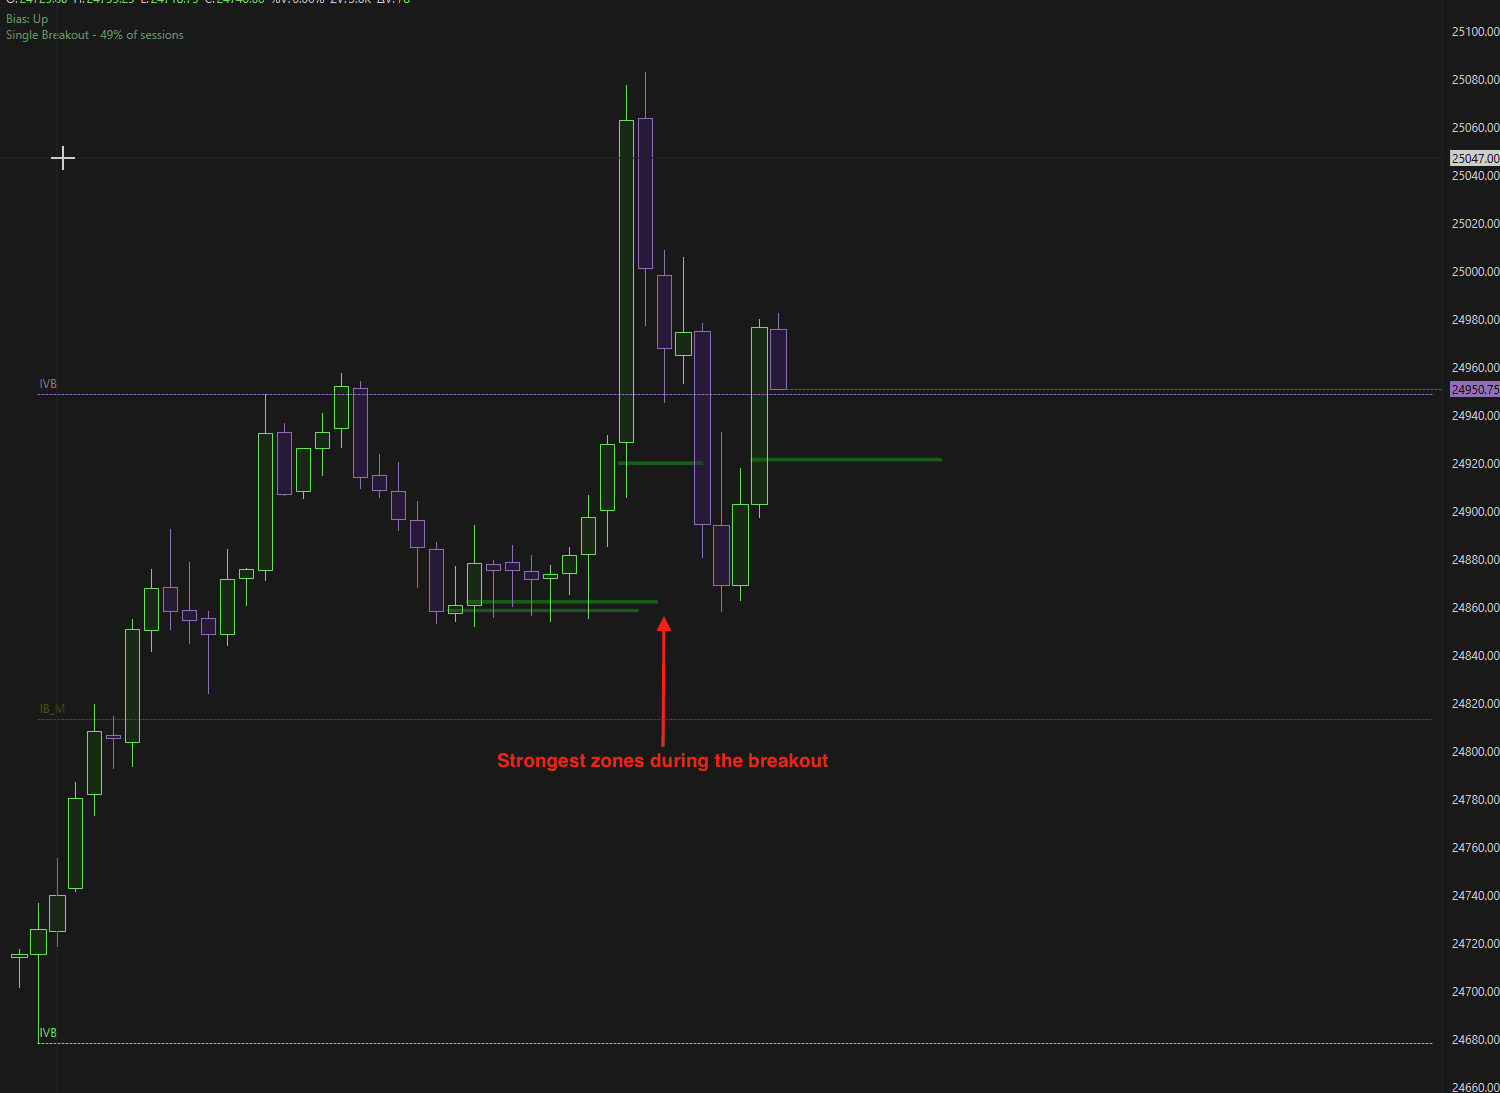
Enable Zones
When activated, this setting highlights the strongest reaction zones during a breakout.
These zones represent high-probability areas where:
Price may react
Momentum may slow
Partial exits may be considered
3. Plot Settings
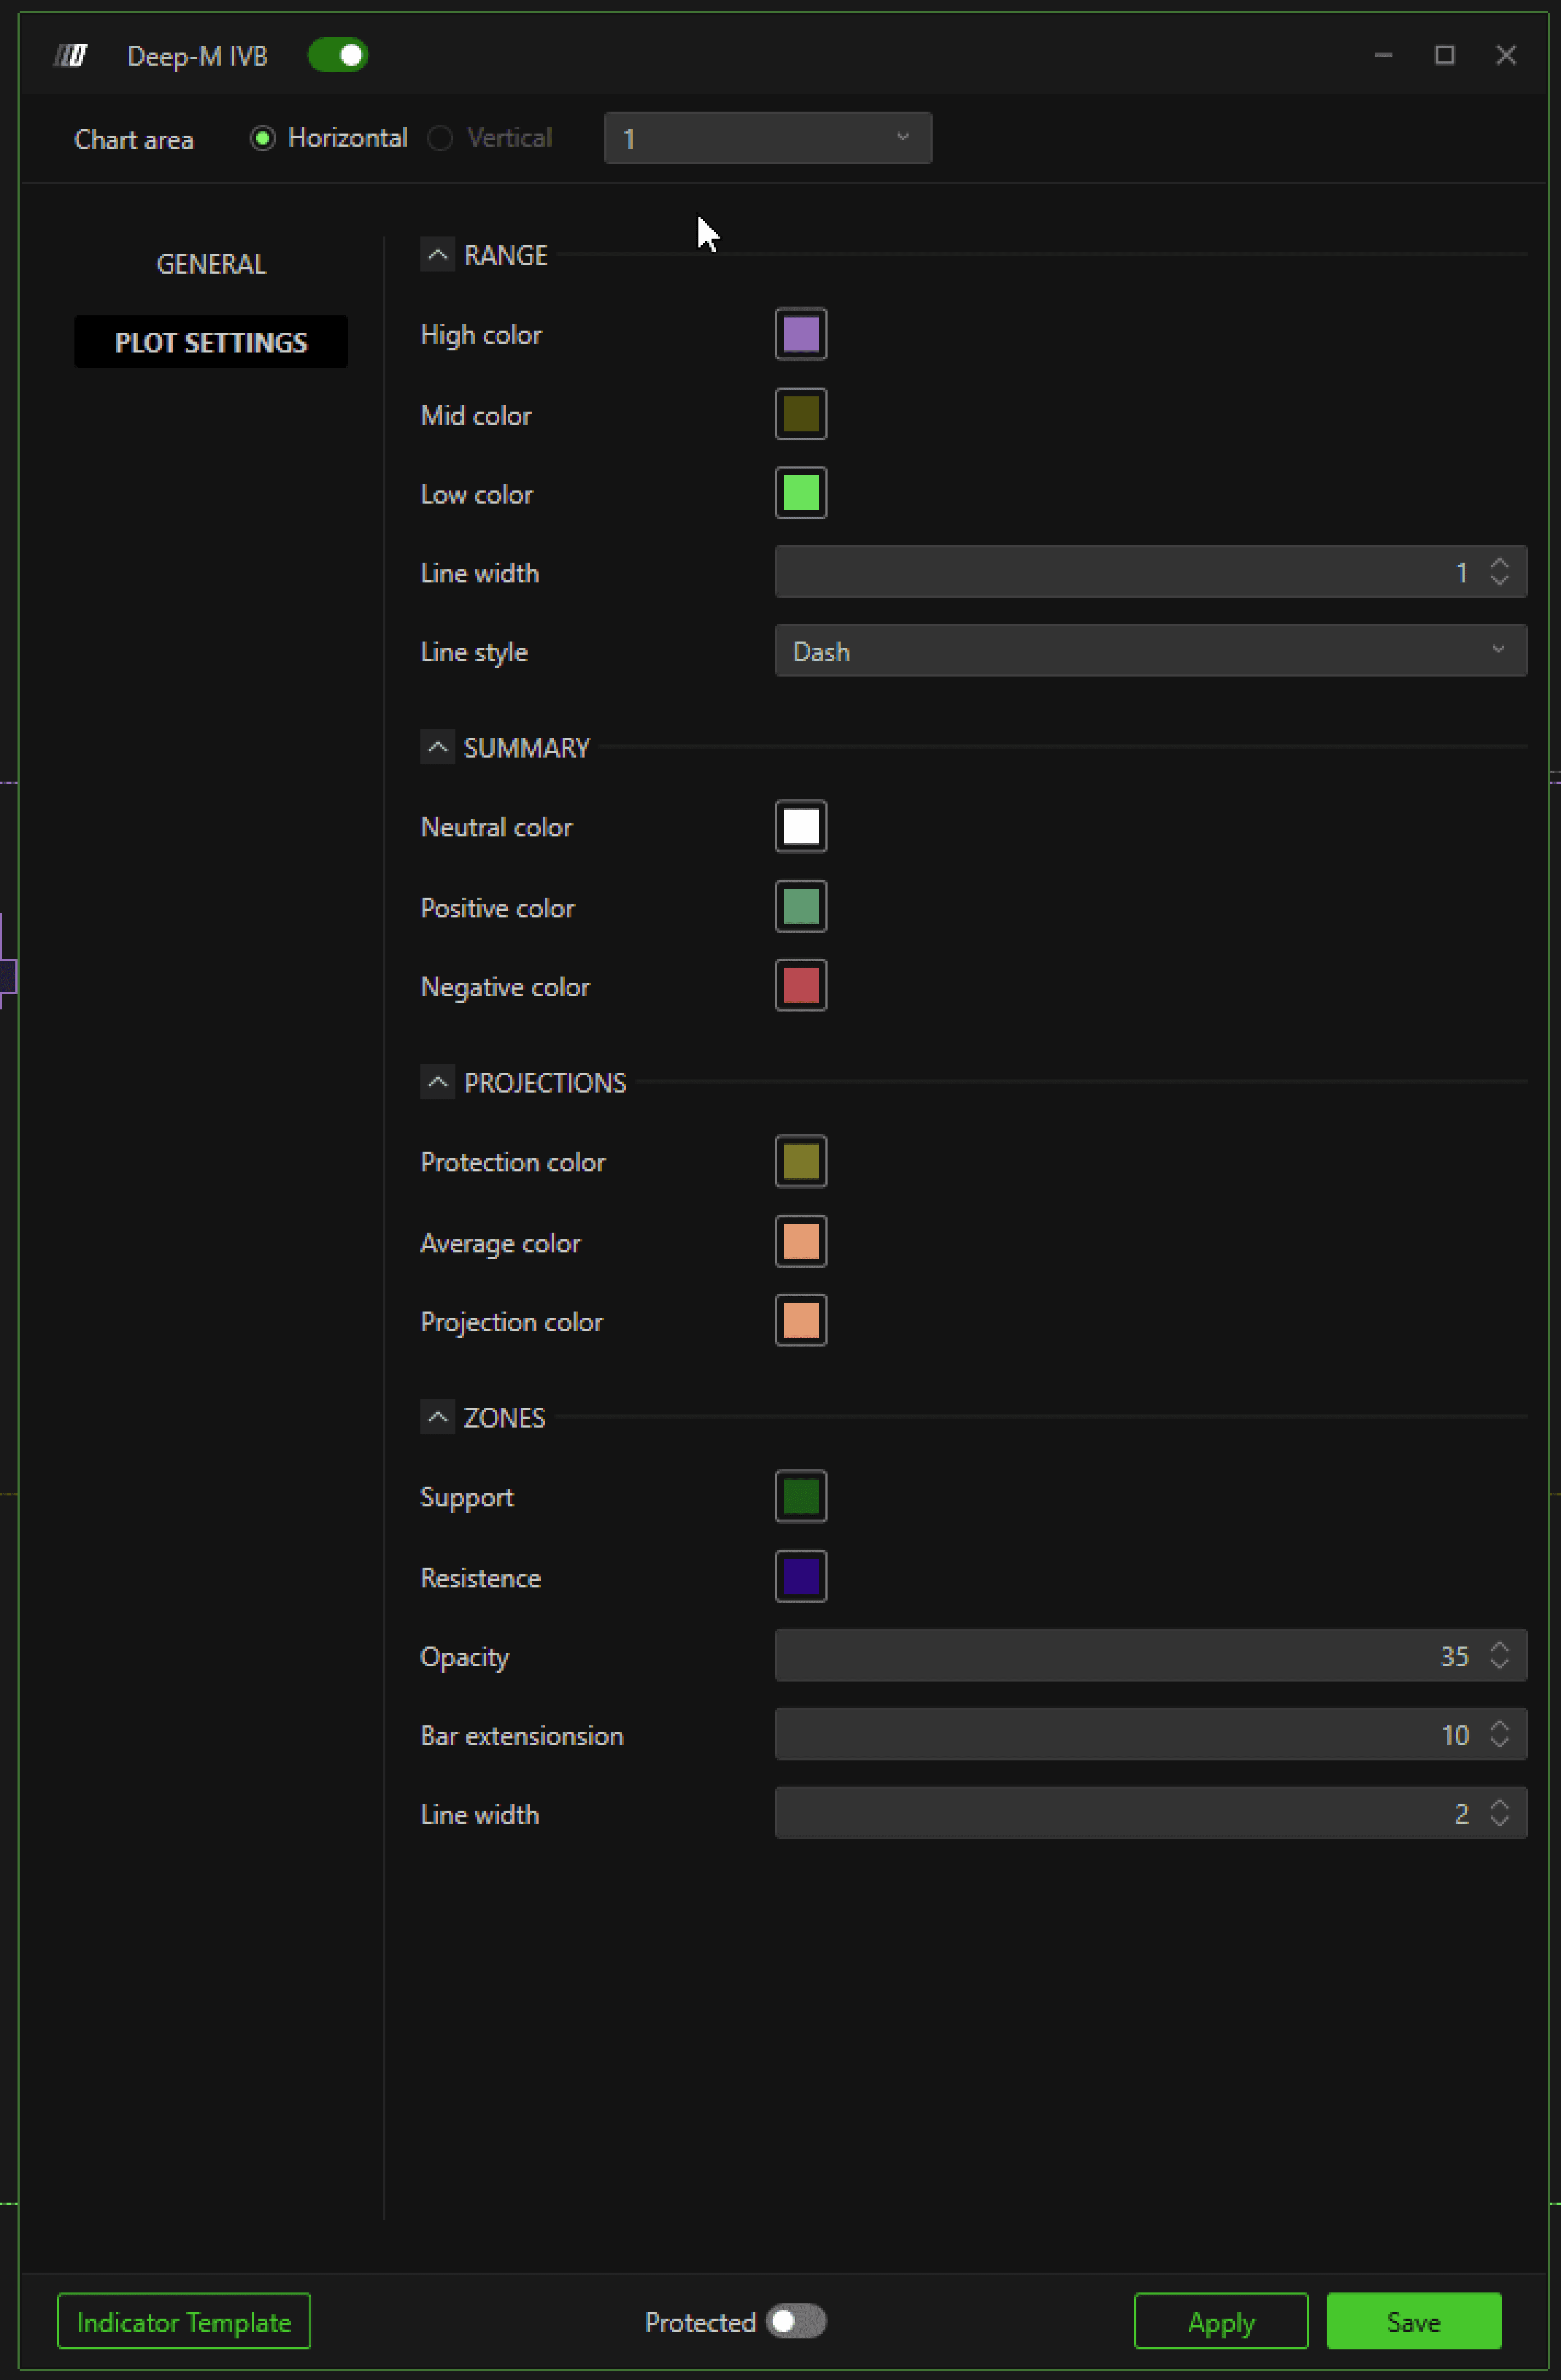
Range
These settings control the visual appearance of the opening range.
High Color – Color of the range high line
Mid Color – Color of the midpoint line
Low Color – Color of the range low line
Line Width – Thickness of the lines
Line Style – Solid, dashed, or other styles
4. Summary Panel
The summary appears in the top-left corner of the chart and provides the daily bias.
Summary Colors
Neutral Color – When daily bias is neutral
Positive Color – When daily bias is bullish
Negative Color – When daily bias is bearish
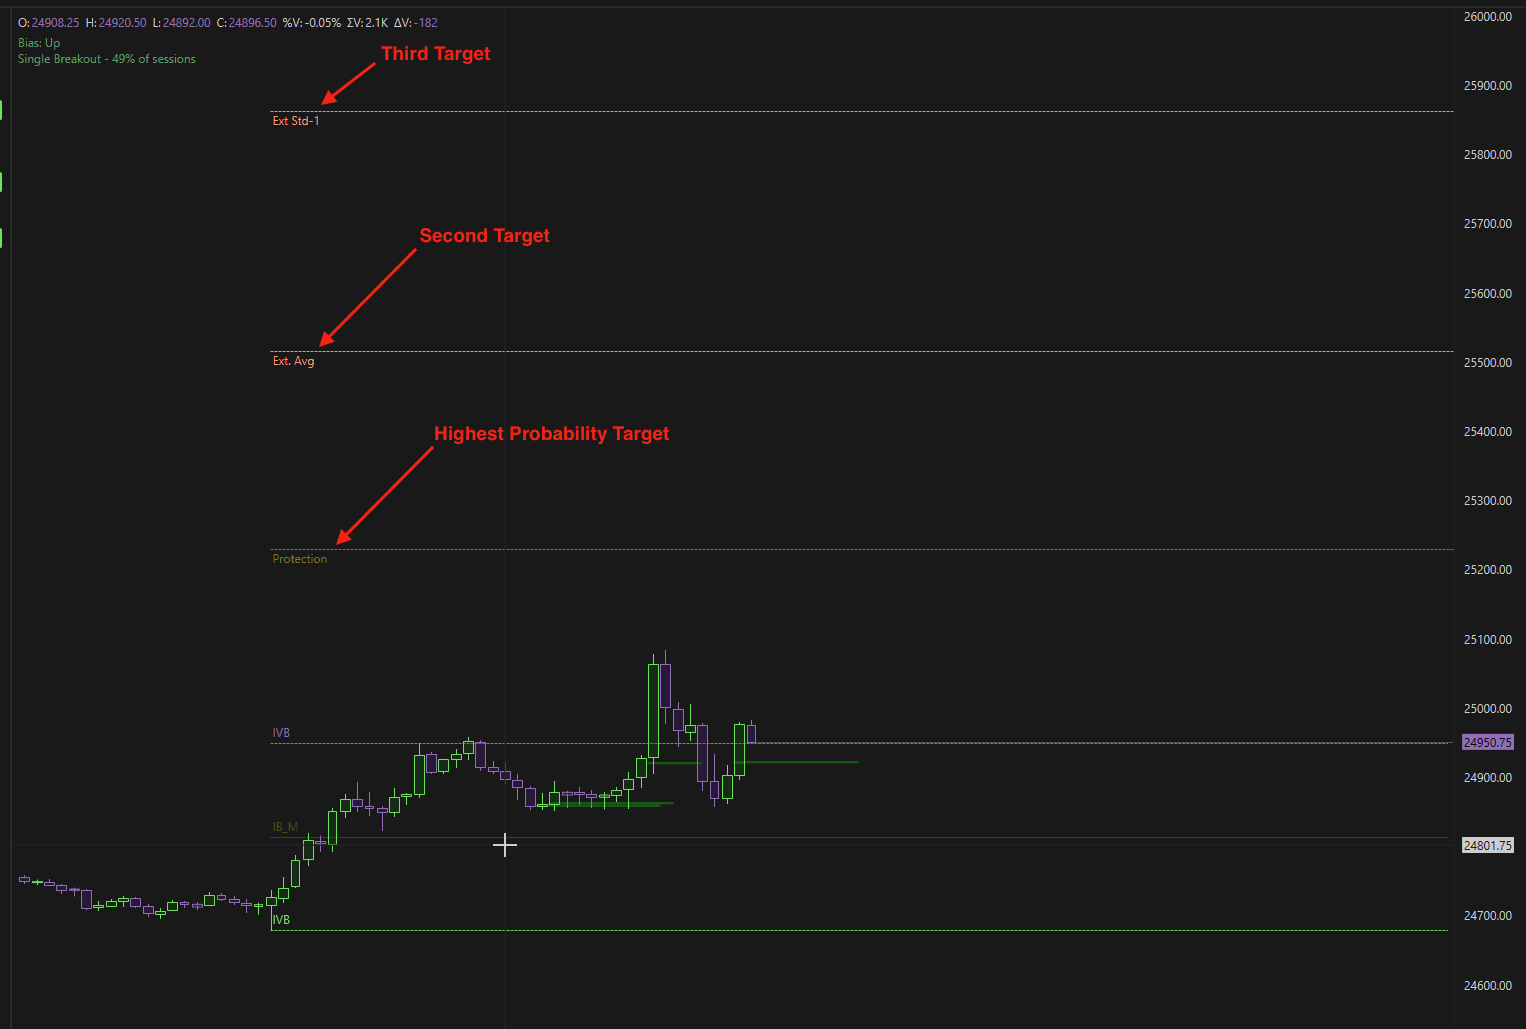
5. Projections
These settings control the appearance of statistically derived target levels.
Protection Color – Highest probability target of the day
Average Color – Second target (Ext. Avg)
Projection Color – Third and final target (Ext. Std-1)
These levels are generated using historical probability models.
5. Zones Customization
The Zones section allows full visual customization of breakout reaction zones.
Support
Color of bullish breakout zones.
Resistance
Color of bearish breakout zones.
Opacity
Adjust transparency of the zone.
Bar Extension
Defines how many candles forward the zone will be drawn.
Example: If set to 10, the zone will extend for the next 10 candles.
Line Width
Defines the border thickness of the zone.
Summary
Deep-M IVB transforms the traditional Opening Range Breakout strategy into a data-driven, probability-based trading framework.
It provides:
Automated opening range calculation
Predefined projection and protection levels
Reaction zones during breakouts
Clear daily bias summary
Minimal configuration with professional structure
By combining ORB structure with historical statistical modeling, Deep-M IVB helps traders approach breakout sessions with clarity, structure, and measurable probabilities.