Deep Indicators
Updated:
Deep Pattern Builder is the most advanced indicator within the DeepCharts suite. It enables you to build fully customized trading logic using relational conditions and to automatically backtest those conditions through the built-in simulation engine.
To properly understand this indicator, we must first understand the core concepts behind condition building and how multiple conditions are combined to form complex trading logic.
1. Understanding Condition Logic
Each condition in Deep Pattern Builder is built using:
Input Types
Mathematical Operators
Logical Operators
Condition Combine Modes
Let’s break these down step by step.
Input Types
There are three types of inputs:
1. Reference
This input type allows you to reference different components of a candle, including:
Open, Close, High, Low, Bid Volume, Bid NT, Ask Volume, Ask NT, Total Volume, Total NT, Delta Volume, Delta NT, Low–High Ticks, Open–Close Ticks, POC Price %, POC Total Volume, POC on Shadow, Cumulative Delta Volume.
2. Indicator
This input type allows you to dynamically fetch values from another indicator applied to your chart (explained later in this article).
3. Constant
A predefined numerical value that you manually enter.
Mathematical Operators
The available mathematical operators are:
+(Addition)(Subtraction)
x(Multiplication)/(Division)
Logical Operators
Logical operators define the relationship between two calculated values:
>Greater Than>=Greater Than or Equal To=Equal To<>Not Equal To<Less Than<=Less Than or Equal To
Building Simple Conditions
Let’s begin with a simple example using constant inputs.
Assume:
Input A = 40
Input B = 30
We can evaluate:
A > B → True
A < B → False
A = B → False
A <> B → True
A >= B → True
A <= B → False
You can use up to four inputs in a single condition:
Example:
A + B > C + D
A − B < C + D
With four inputs and operator combinations, hundreds of logical structures can be created.
Example Using Candle Data
Now let’s apply the same logic using real market data.
Assume:
A = Open (Reference input)
B = Close (Reference input)
Condition:
A − B = 10
If a candle opens at 100 and closes at 90:
100 − 90 = 10
The condition becomes True.
This means we just defined a rule that detects a 10-tick bearish candle. Based on this condition, we can plot a marker (circle, square, etc.) on the chart.
Example Using Another Indicator
We can also fetch values from another indicator.
For example:
A = Delta from Deep Stats
Condition:
A = -30
This condition becomes true whenever a candle has −30 delta, indicating aggressive selling. A marker can then be plotted on the chart whenever this occurs.
2. Combining Multiple Conditions
Deep Pattern Builder allows combining multiple conditions using:
OR
AND
AND + OR (Advanced)
OR Combination
If:
Condition 1 = True
Condition 2 = False
Combination = Condition1 OR Condition2
Result = True
(Only one condition needs to be true.)
AND Combination
Combination = Condition1 AND Condition2
Result = True only if both conditions are true.
Advanced Combination Example
You can combine up to four conditions:
Combination = (Condition1 OR Condition2) AND (Condition3 OR Condition4)
If:
Condition1 = True
Condition2 = False
Condition3 = False
Condition4 = False
Then:
(True AND False) OR (False AND False)
False AND False
Result = False
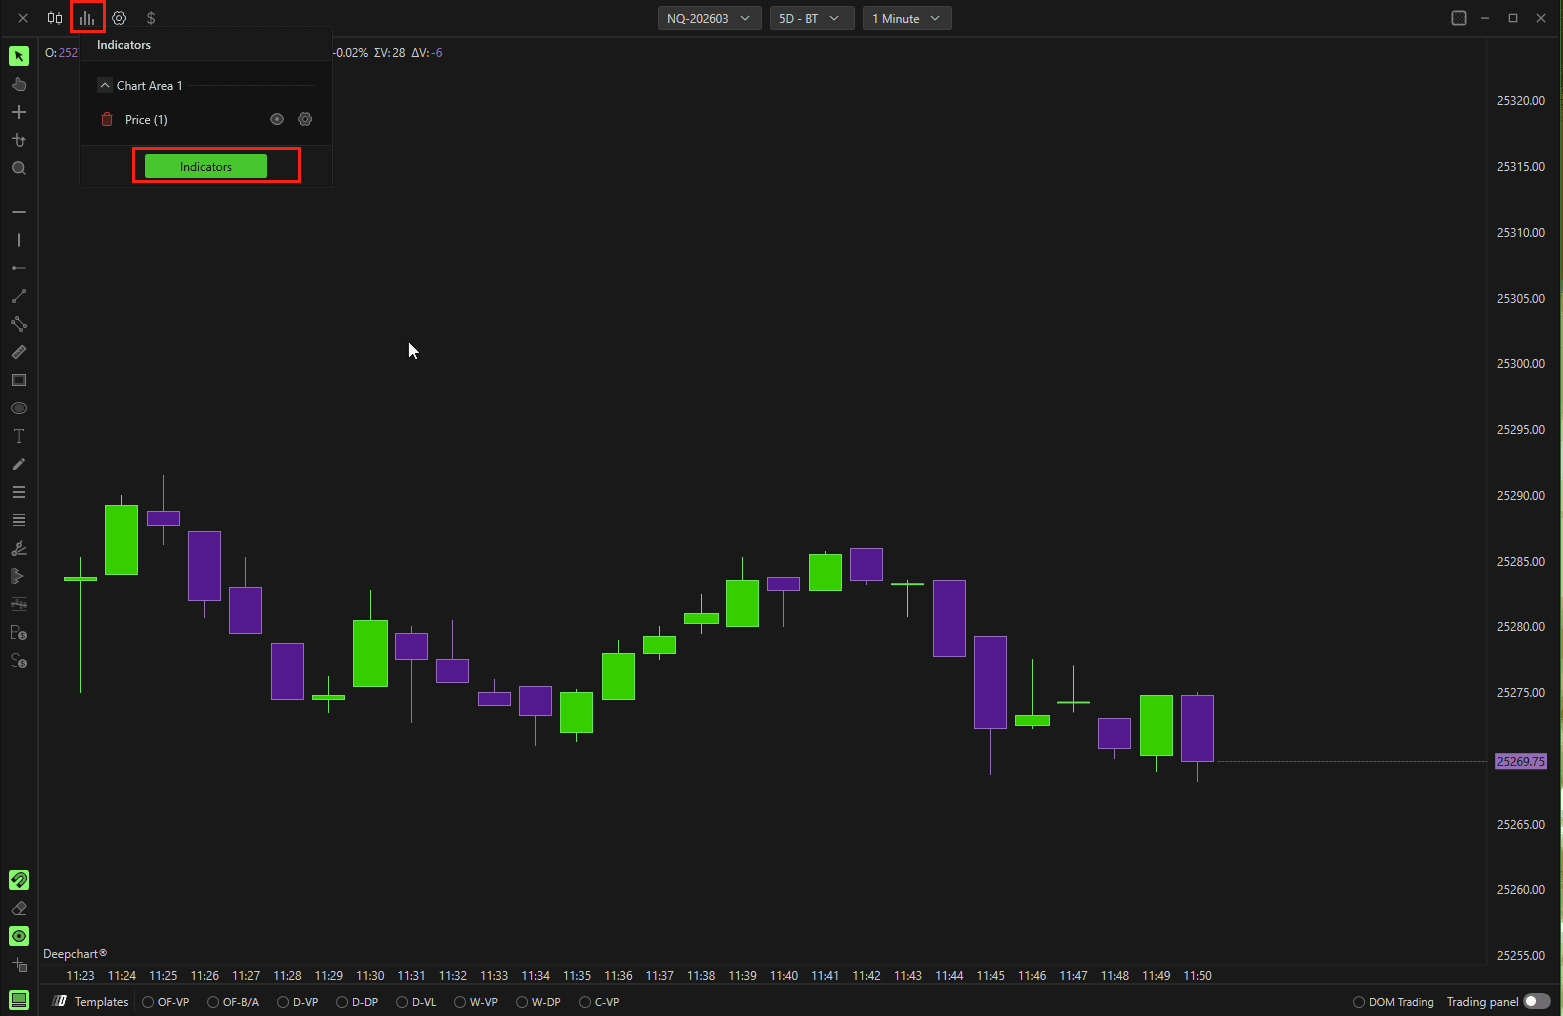
3. How to Apply Deep Pattern Builder
First, apply the Deep Trades indicator to your chart.
Click the Indicator icon on your chart.
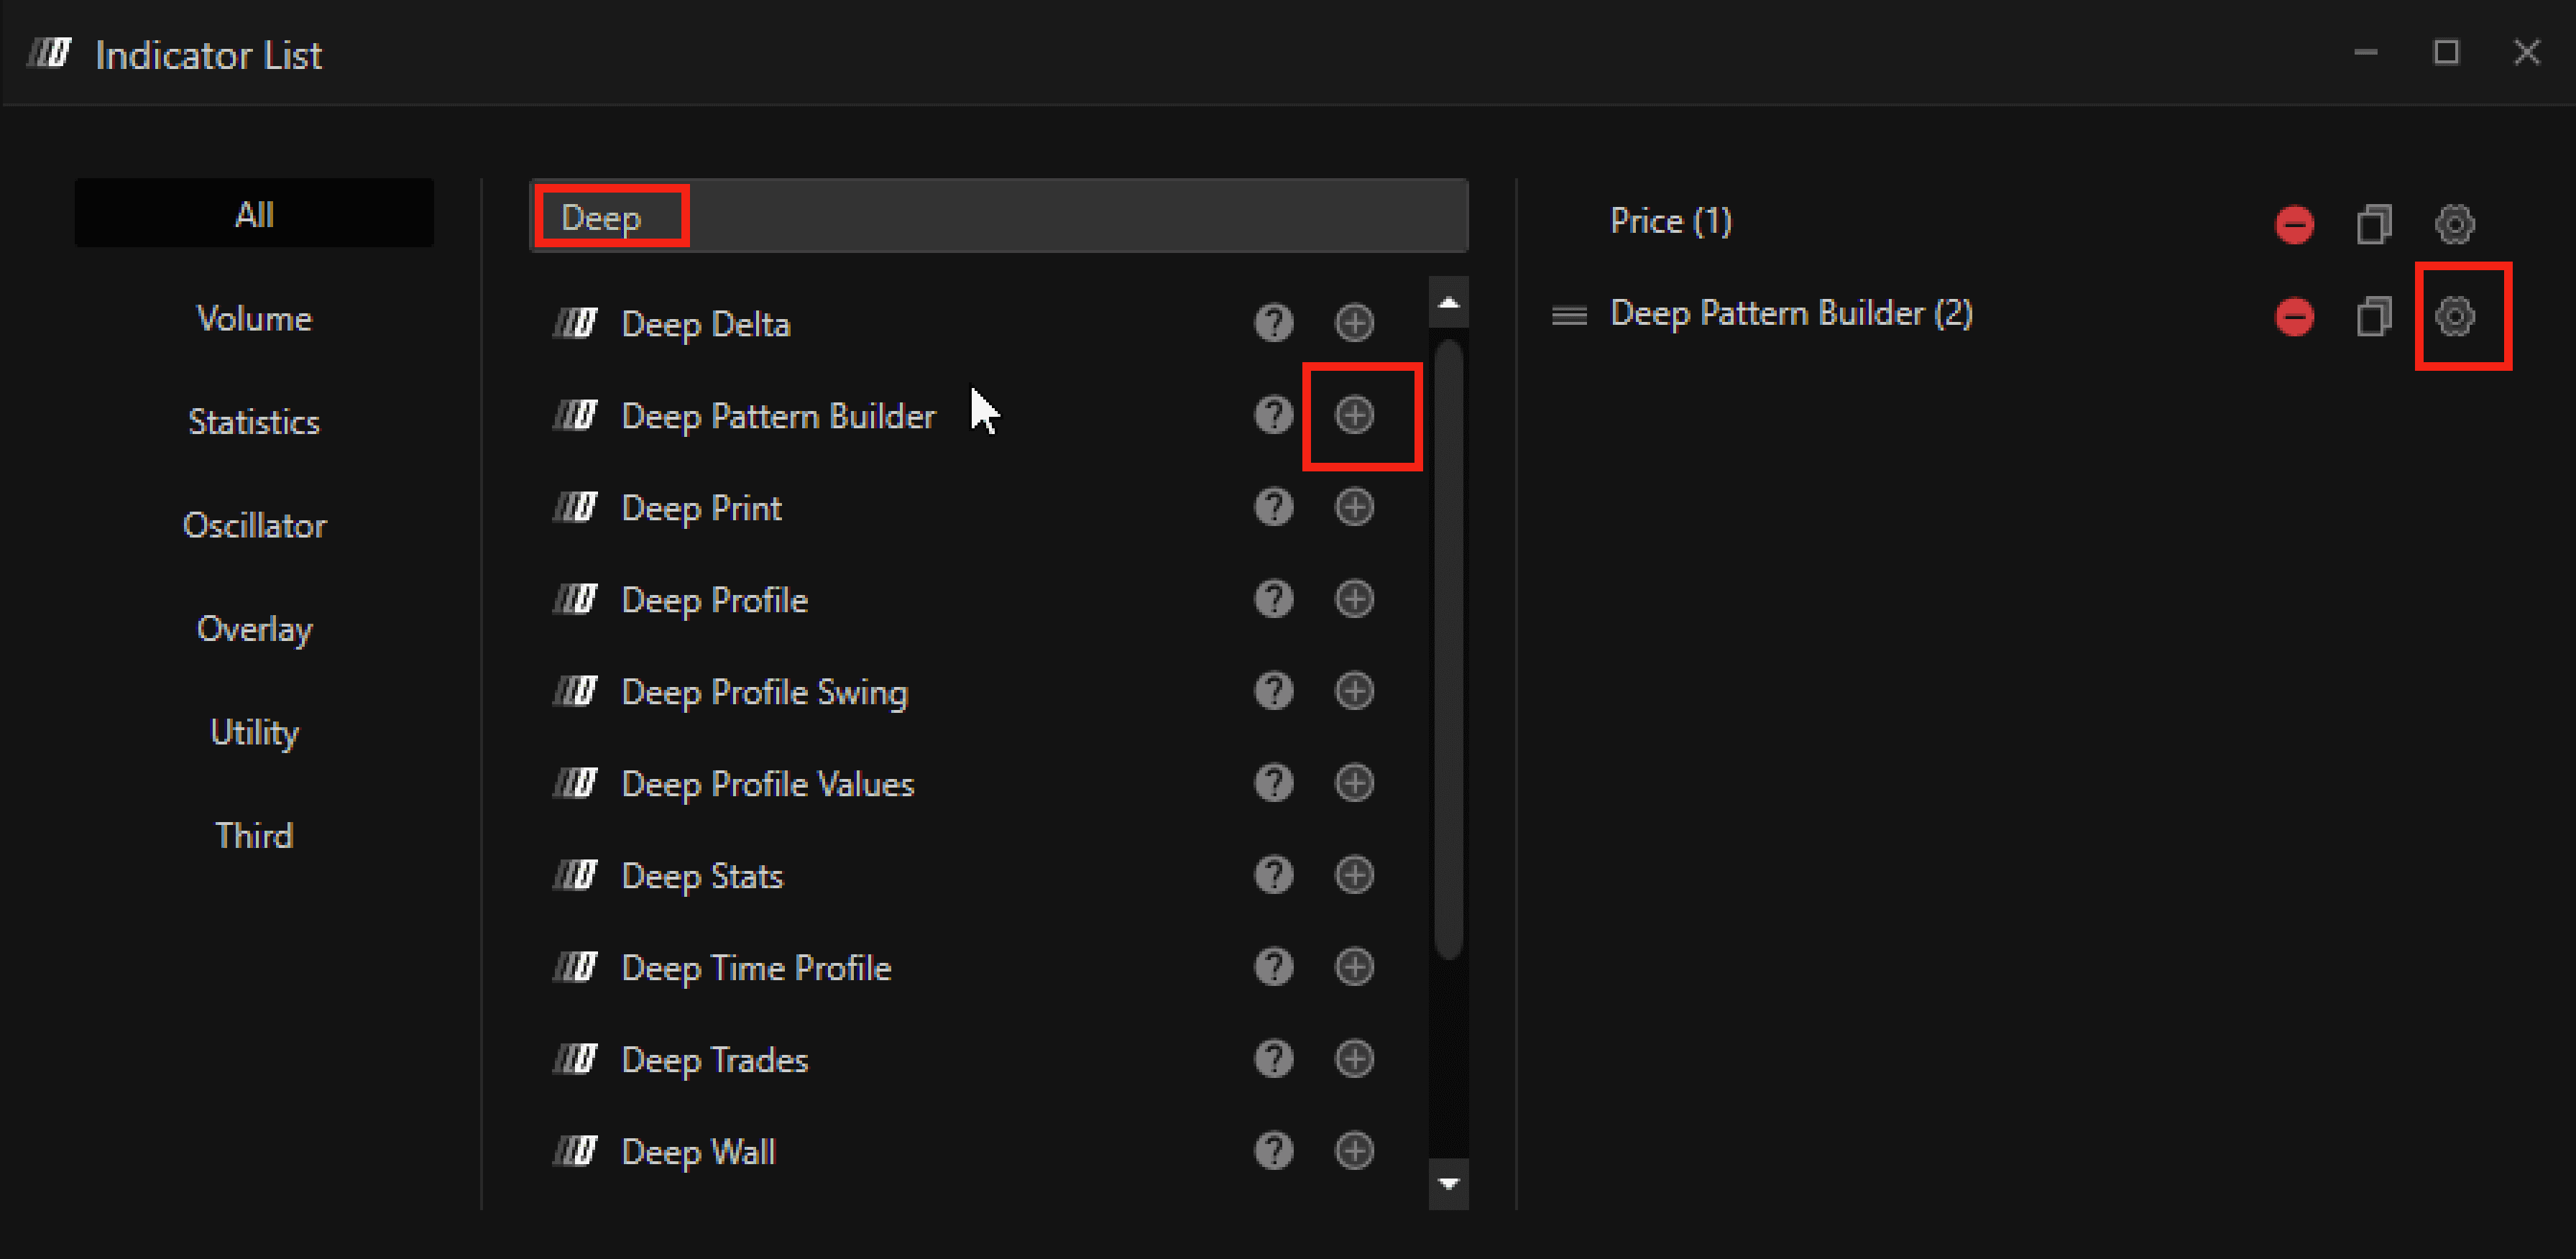
Search for Deep Pattern Builder.
Click the + button to add it.
Click the Settings icon to configure it.
4. Settings Explained (Step by Step)
Condition Section
There are 4 Conditions you can set
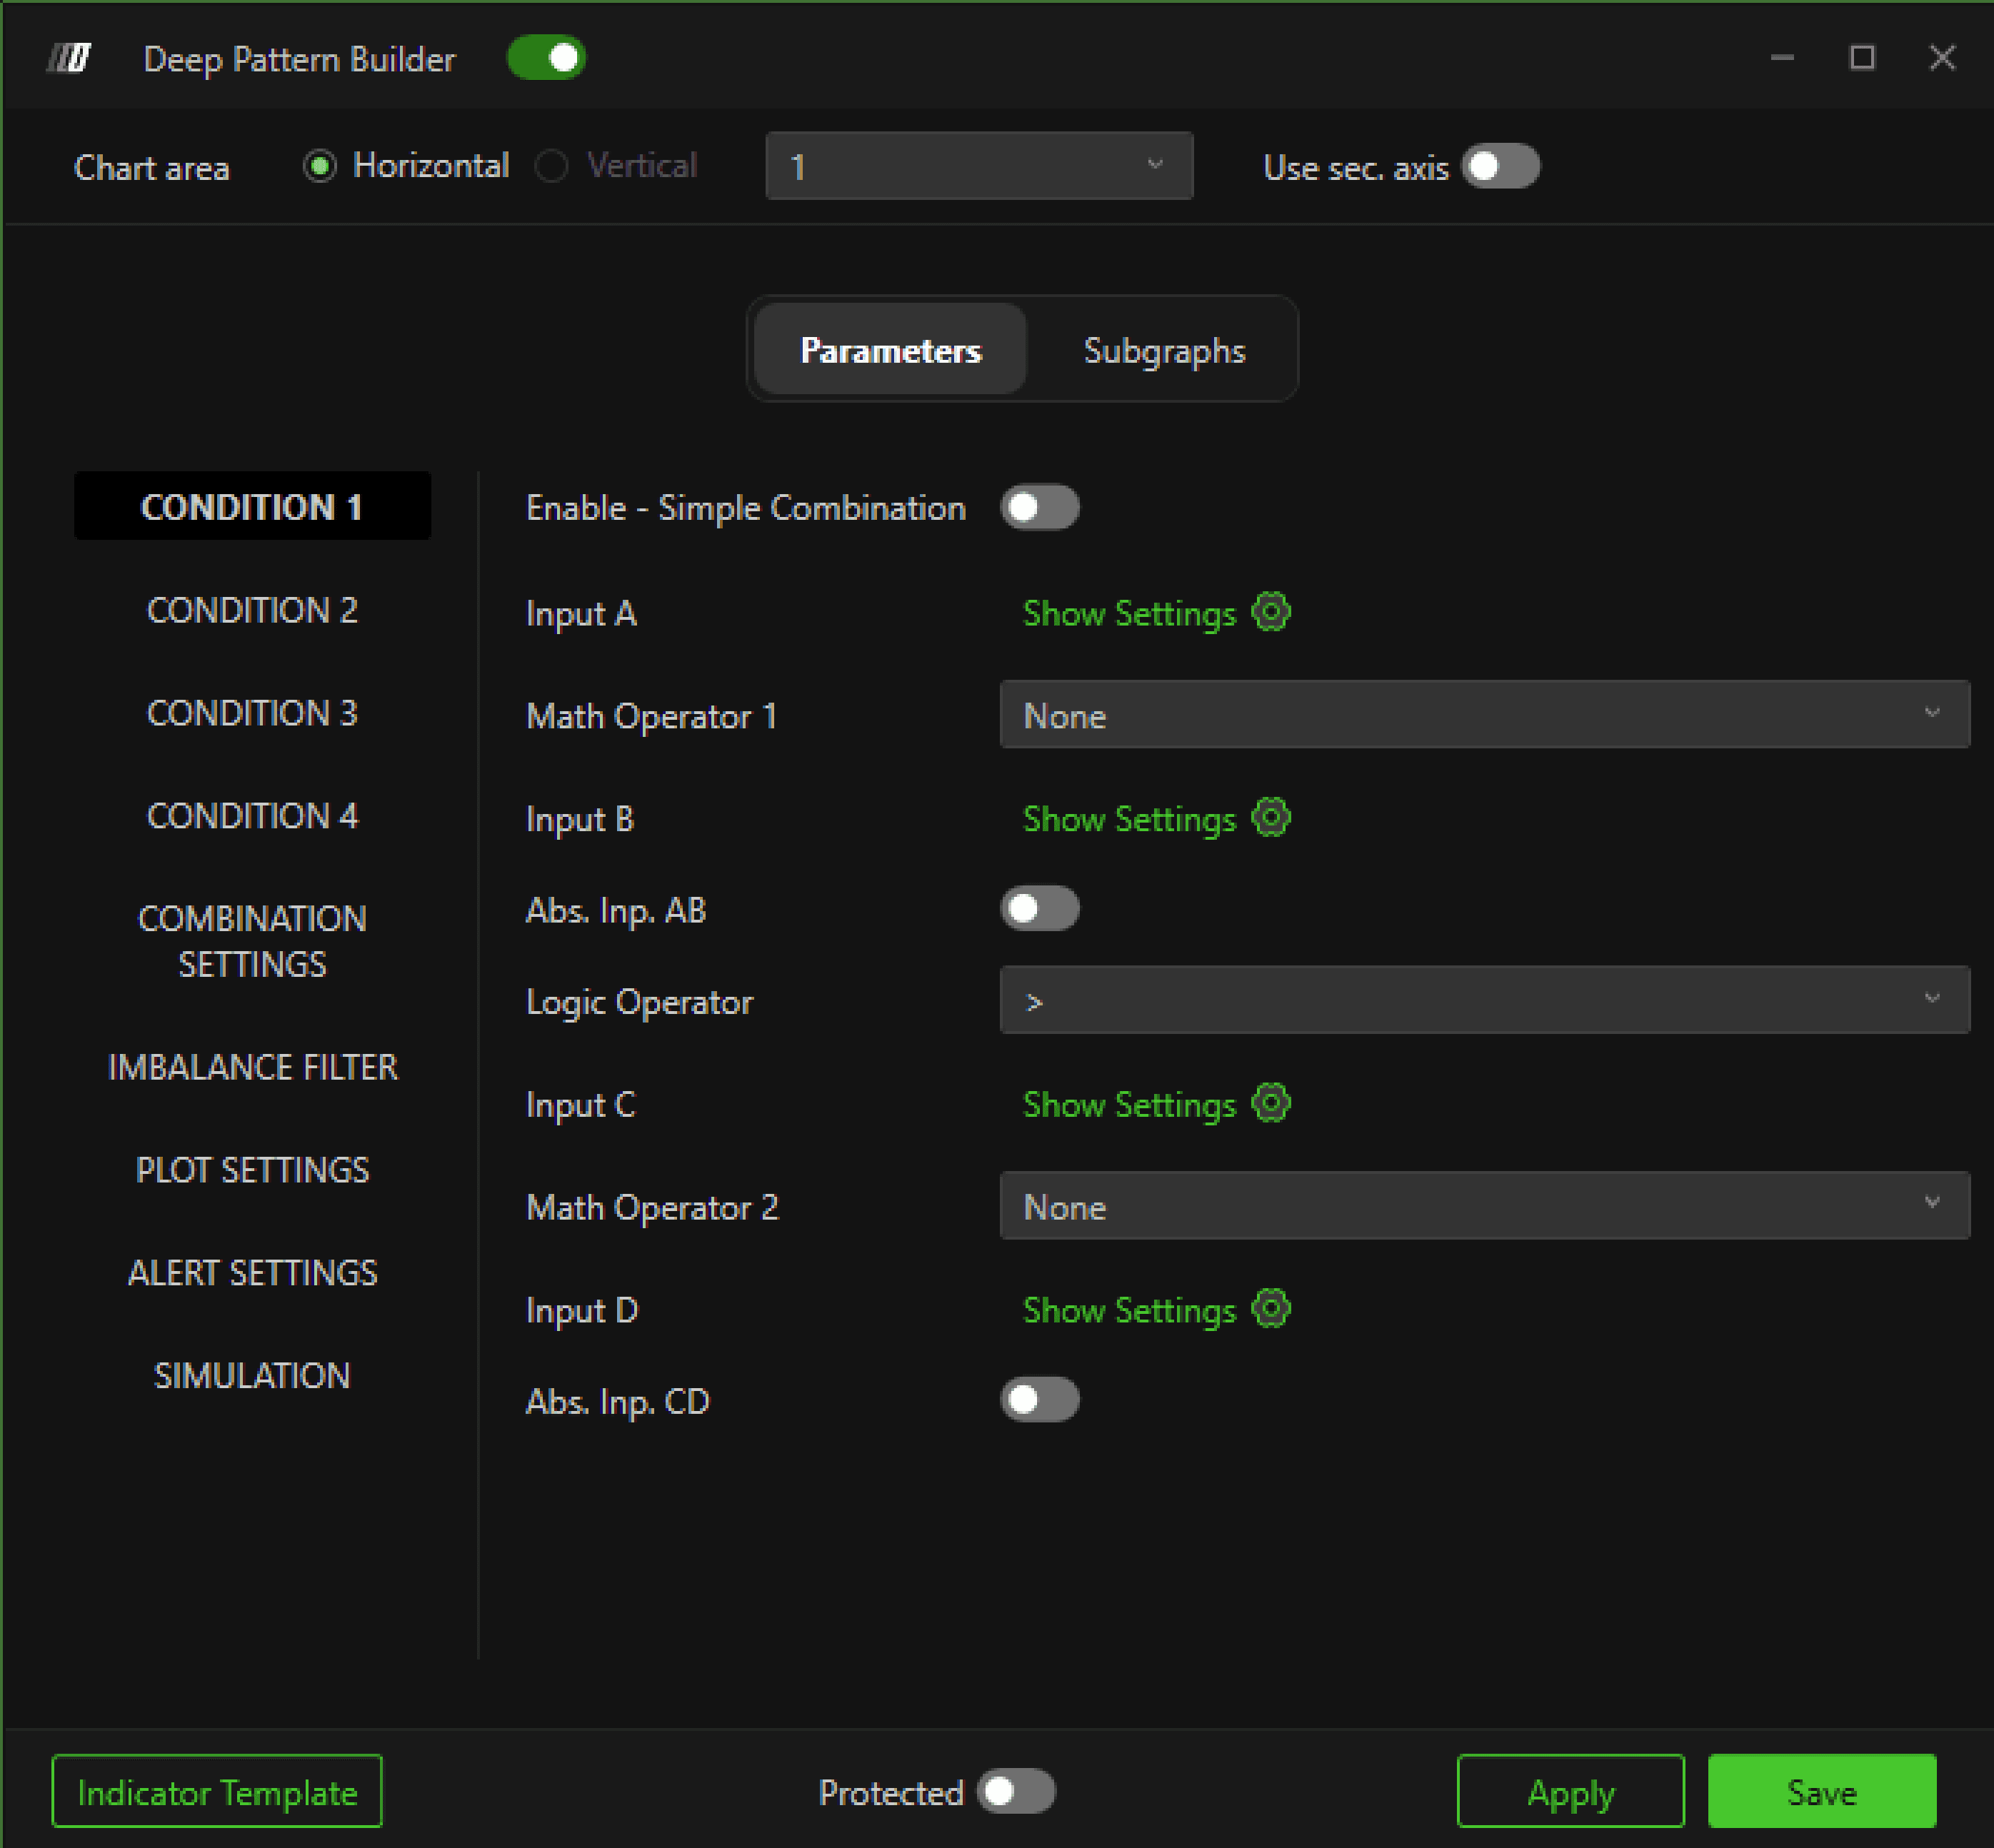
Enable – Simple Combination
Enables the condition.
Inputs (A, B, C, D)
Each condition allows four inputs.
Click the settings icon beside each input to configure:
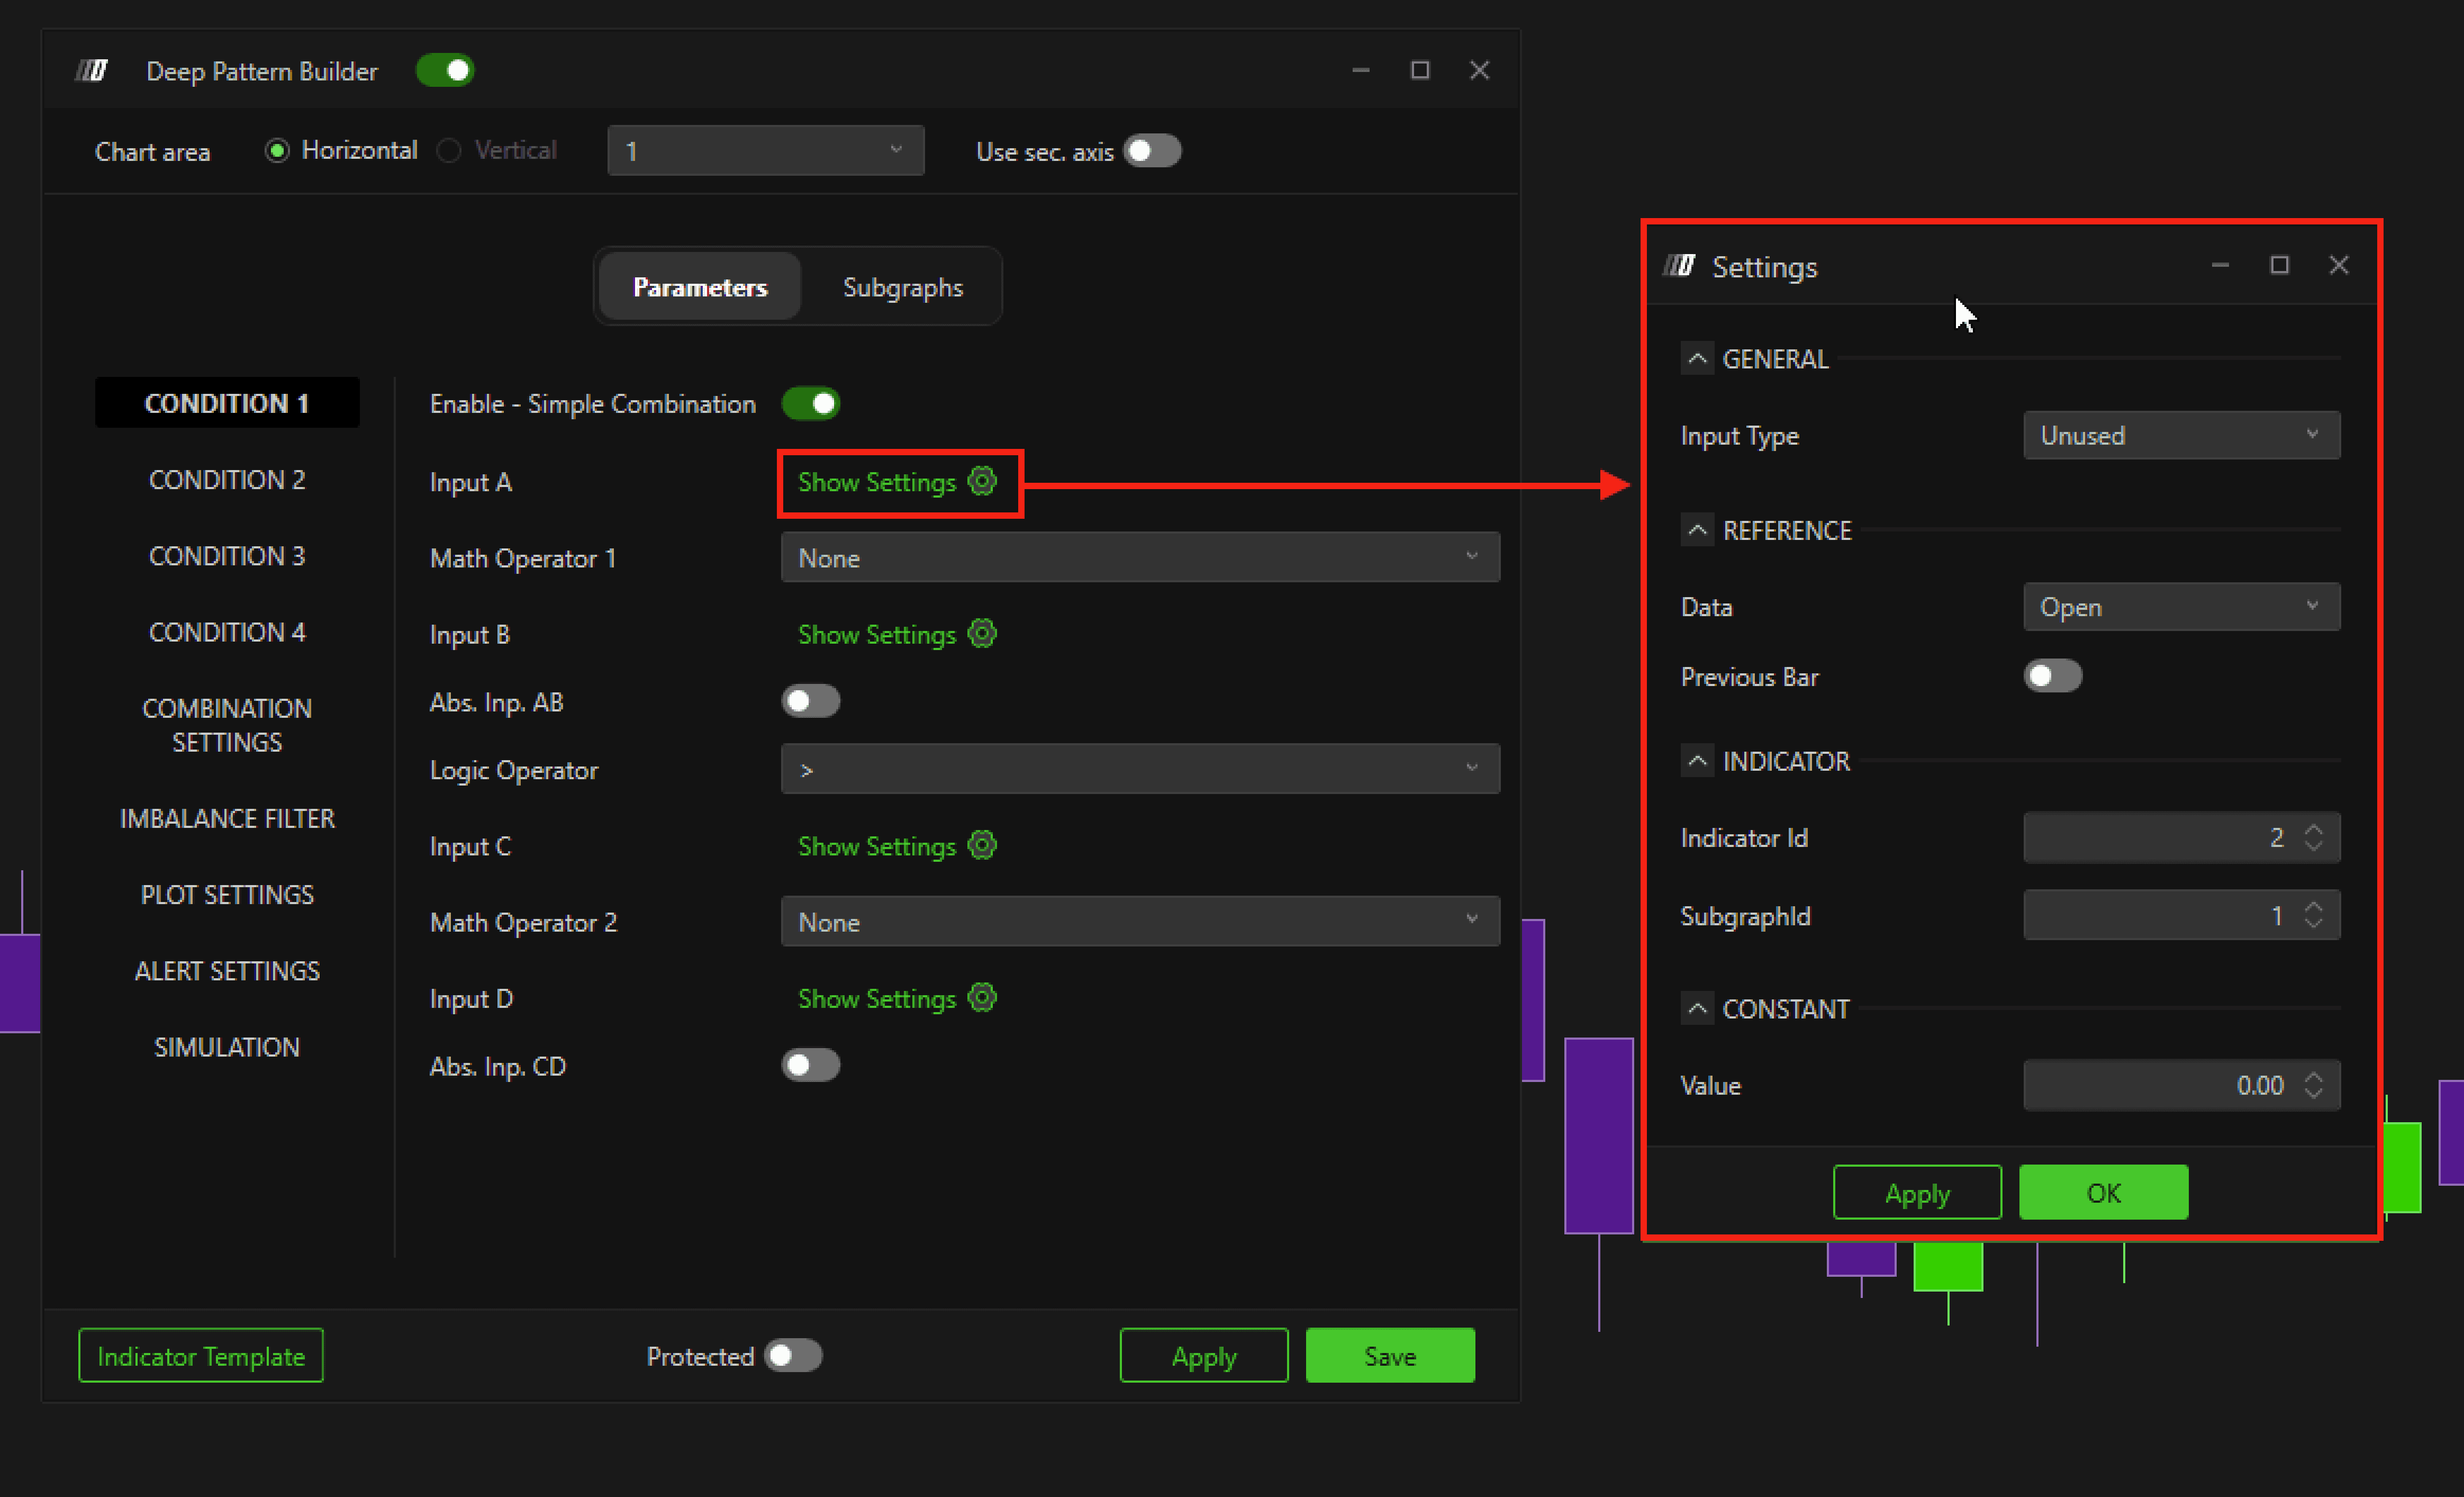
Input Type
Options:
Unused – Disables the input
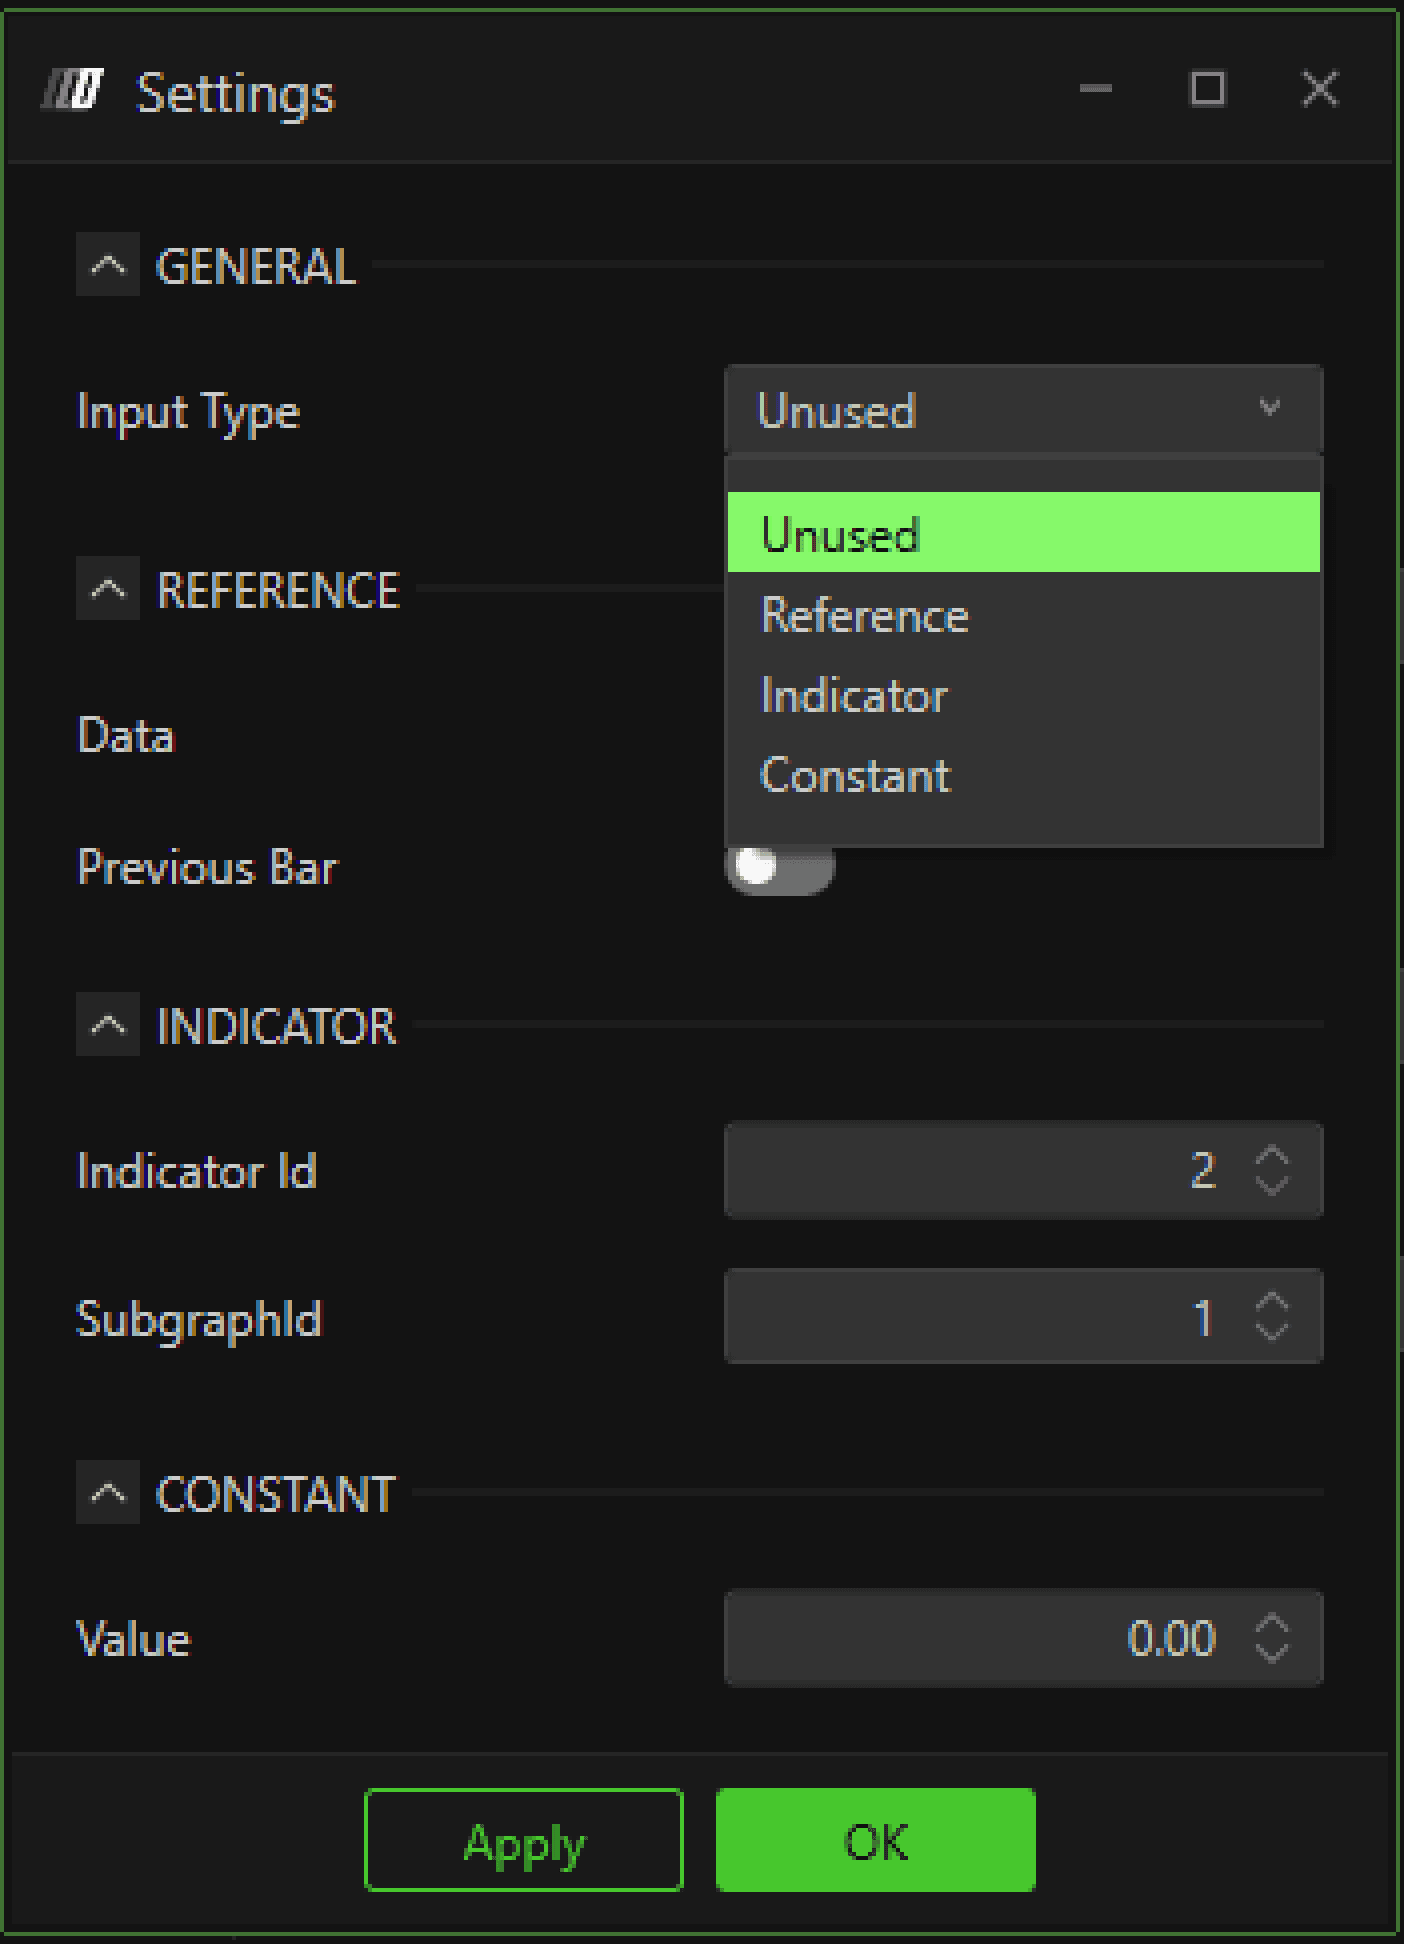
Reference – Uses candle values
Indicator – Fetches data from another indicator
Constant – Uses a fixed numeric value
Reference Input Settings
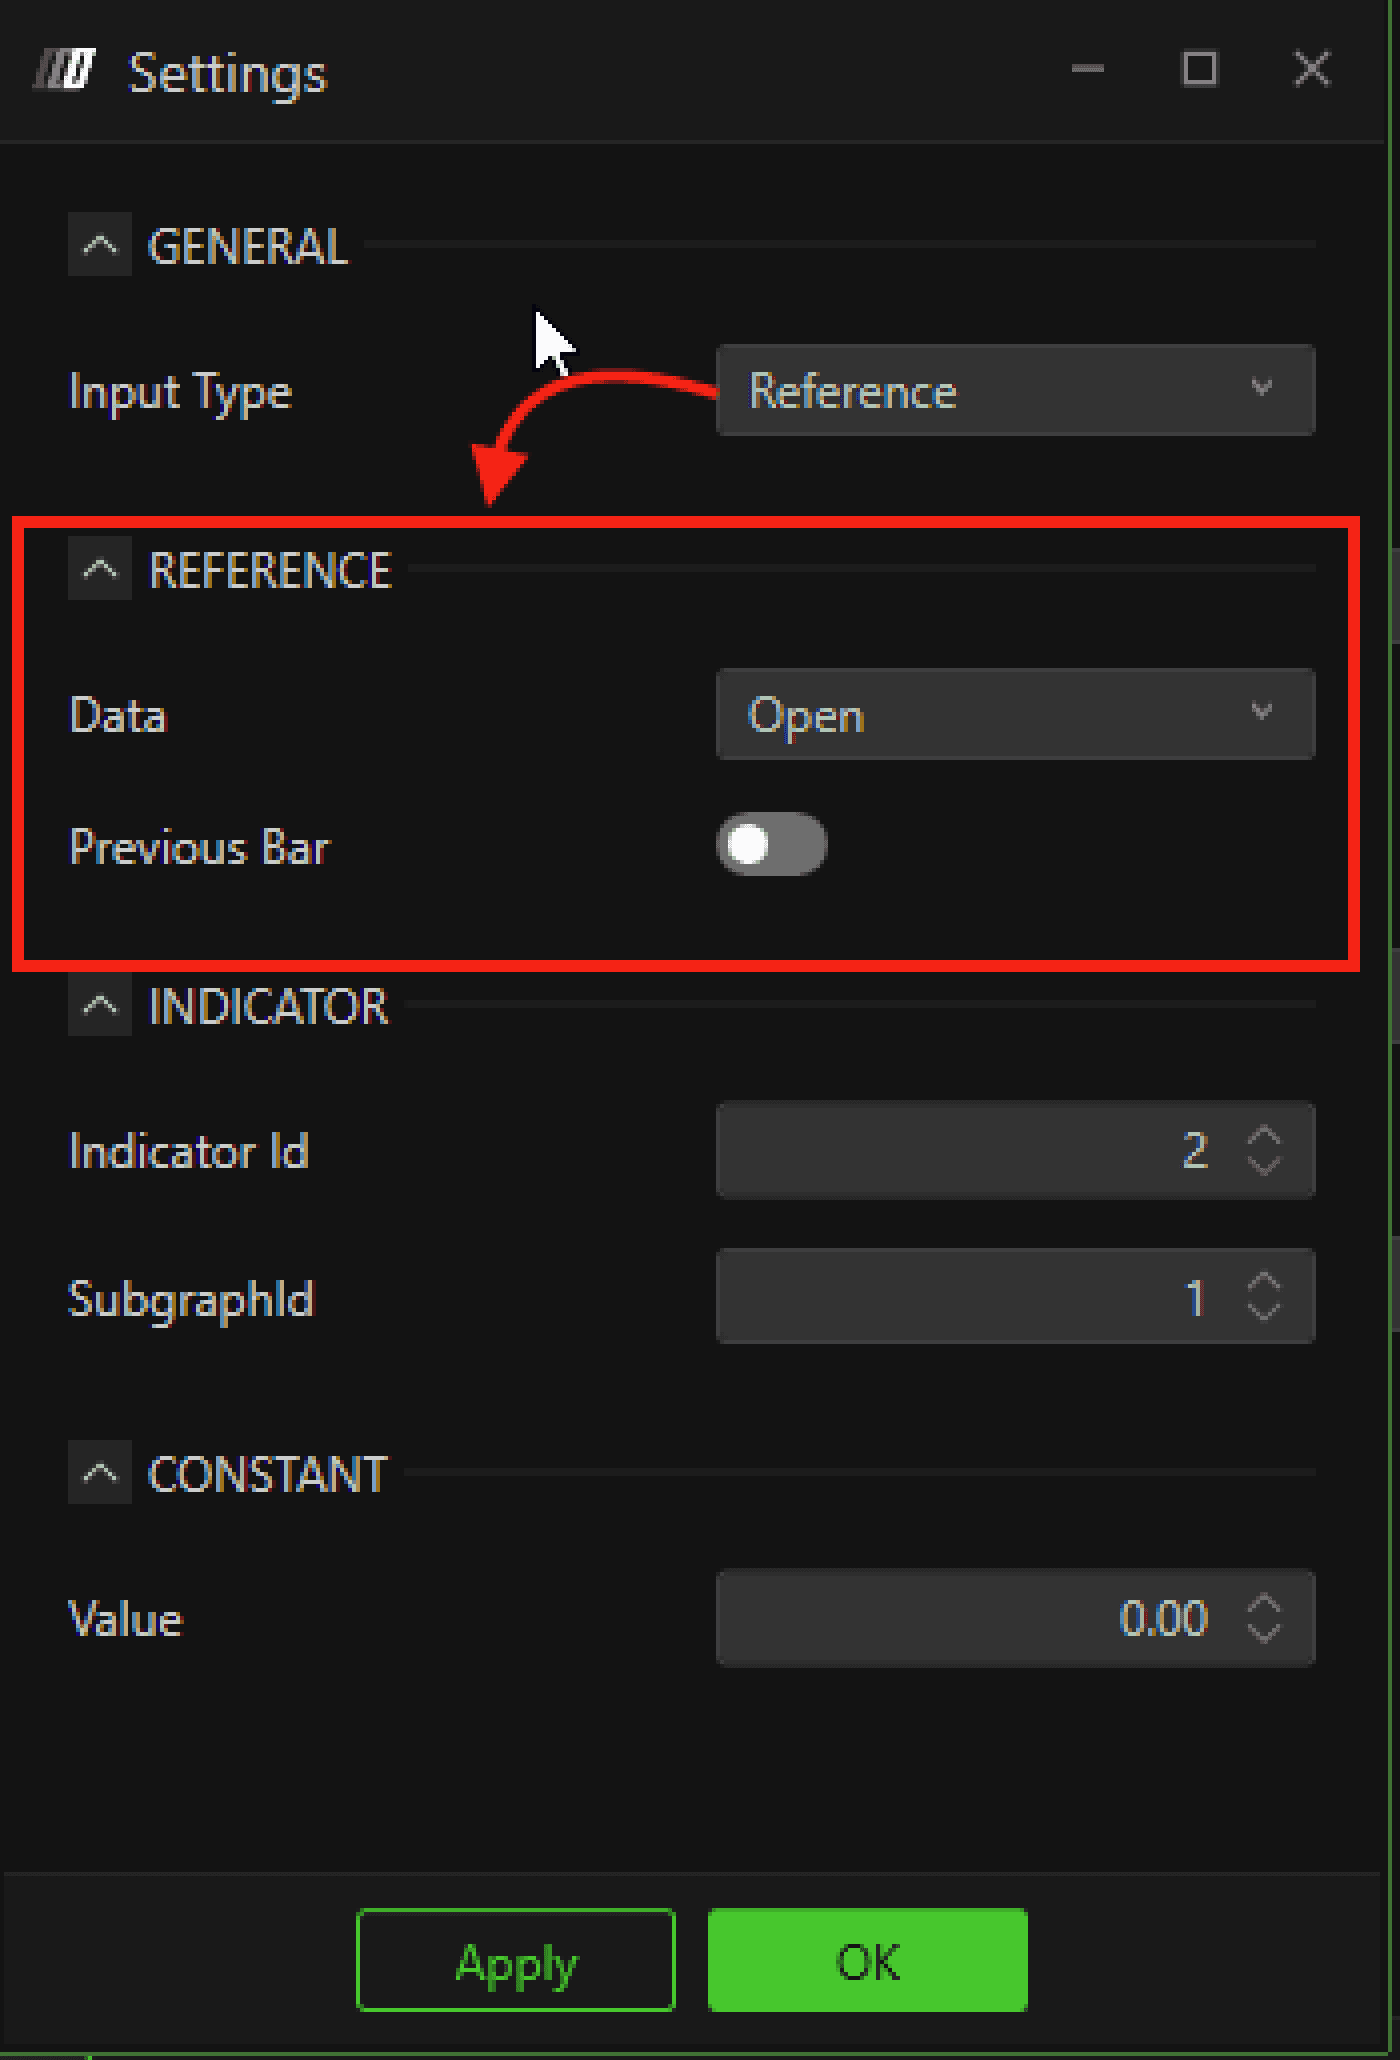
When Reference is selected, you can choose:
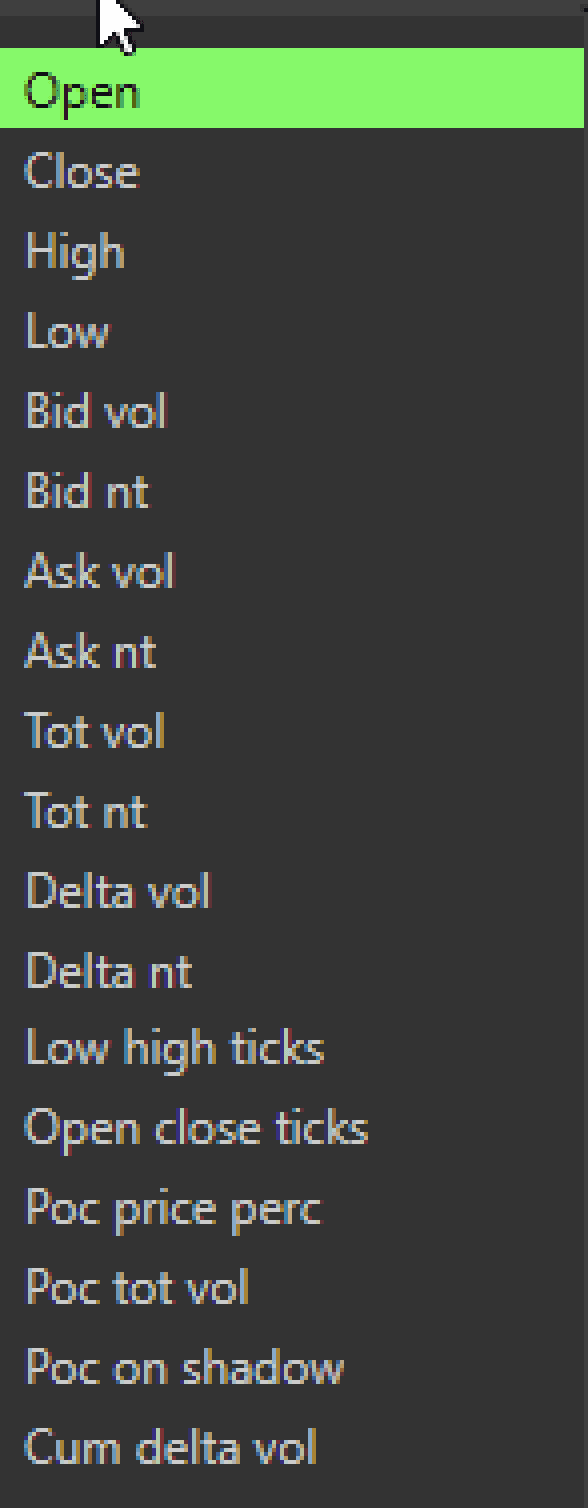
Open, Close, High, Low, Bid Volume, Bid NT, Ask Volume, Ask NT, Total Volume, Total NT, Delta Volume, Delta NT, Low–High Ticks, Open–Close Ticks, POC Price %, POC Total Volume, POC on Shadow, Cumulative Delta Volume.
Previous Bar
If enabled, the value will be loaded from the previous candle instead of the current one.
Indicator Input Settings
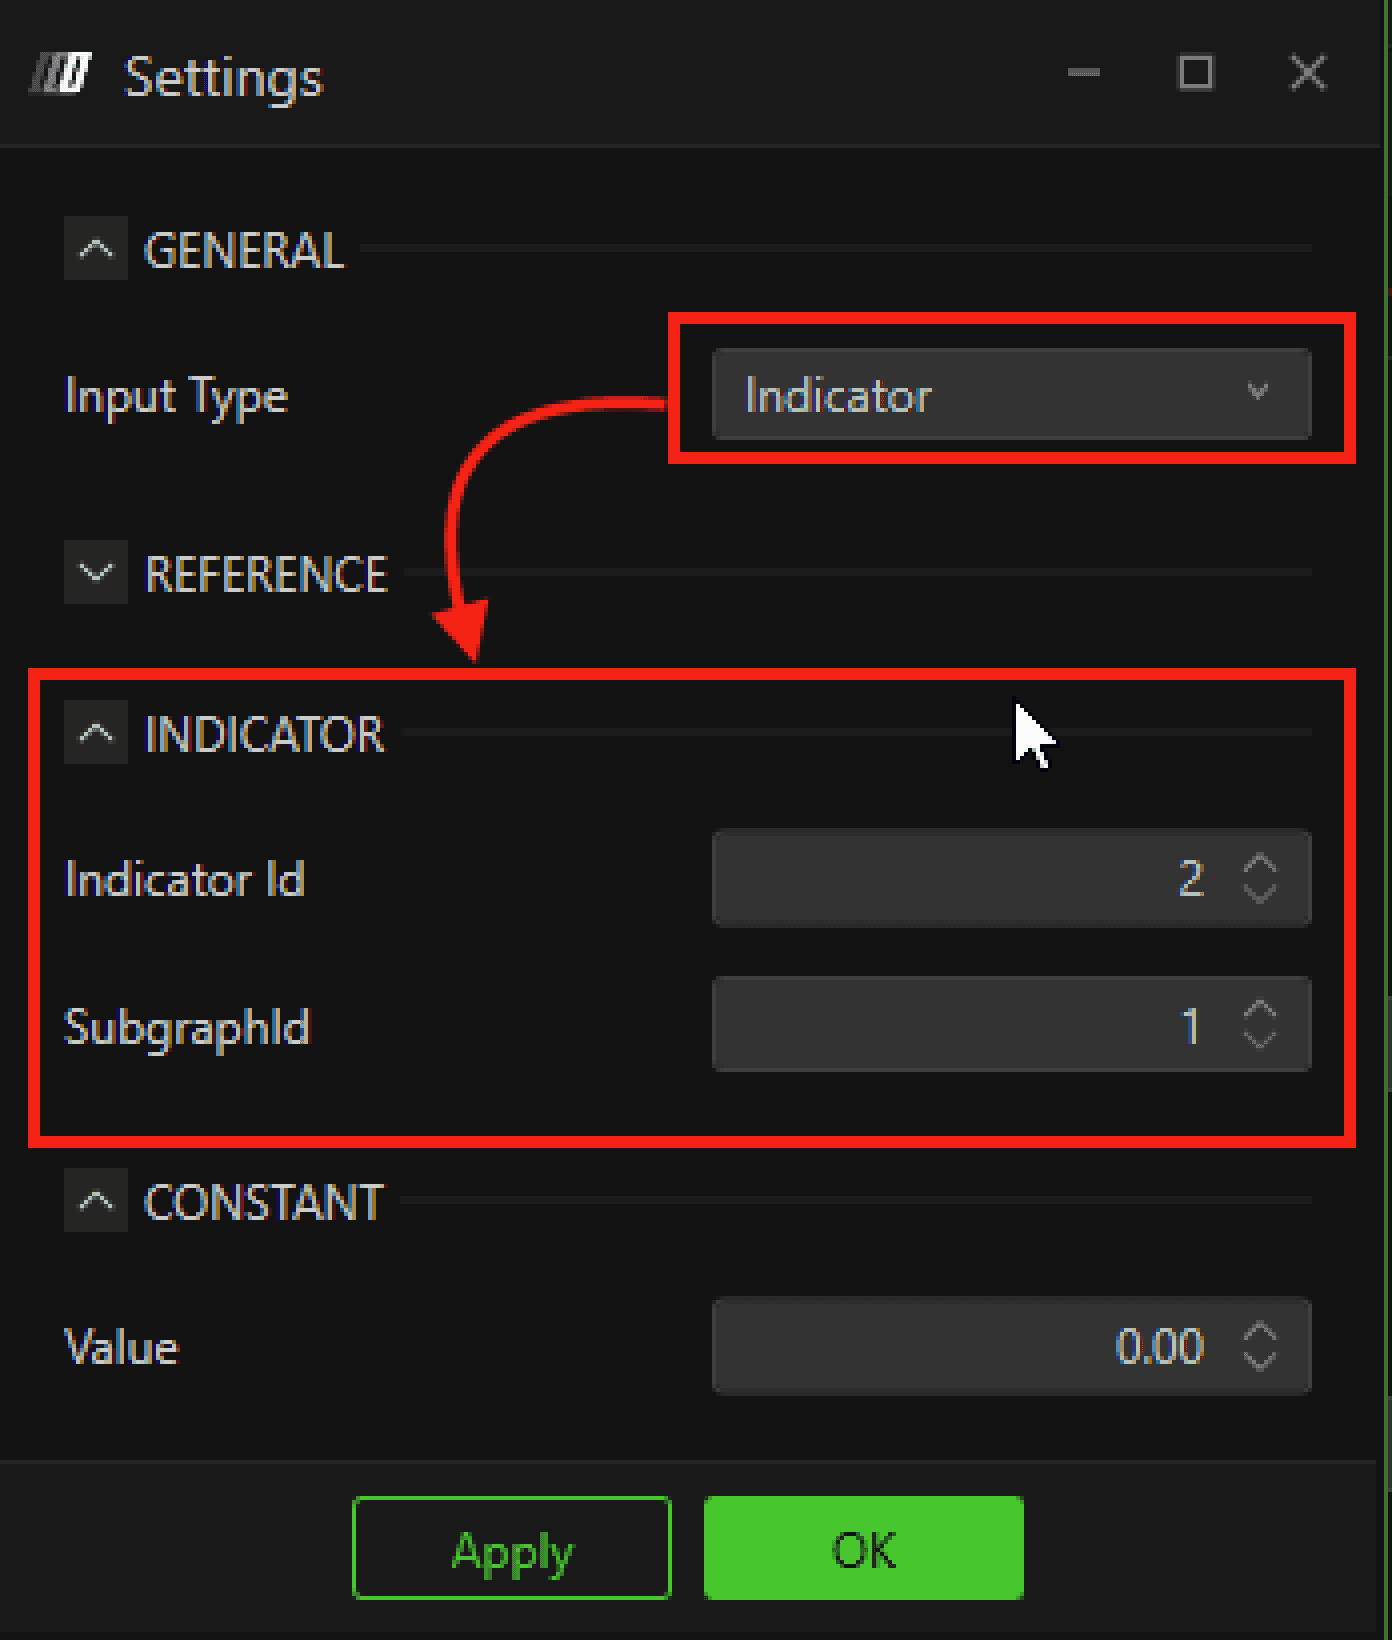
Allows dynamic data retrieval from another indicator.
Indicator ID – The ID of the indicator on your chart.
Subgraph ID – The specific value line you want to reference.
Example:
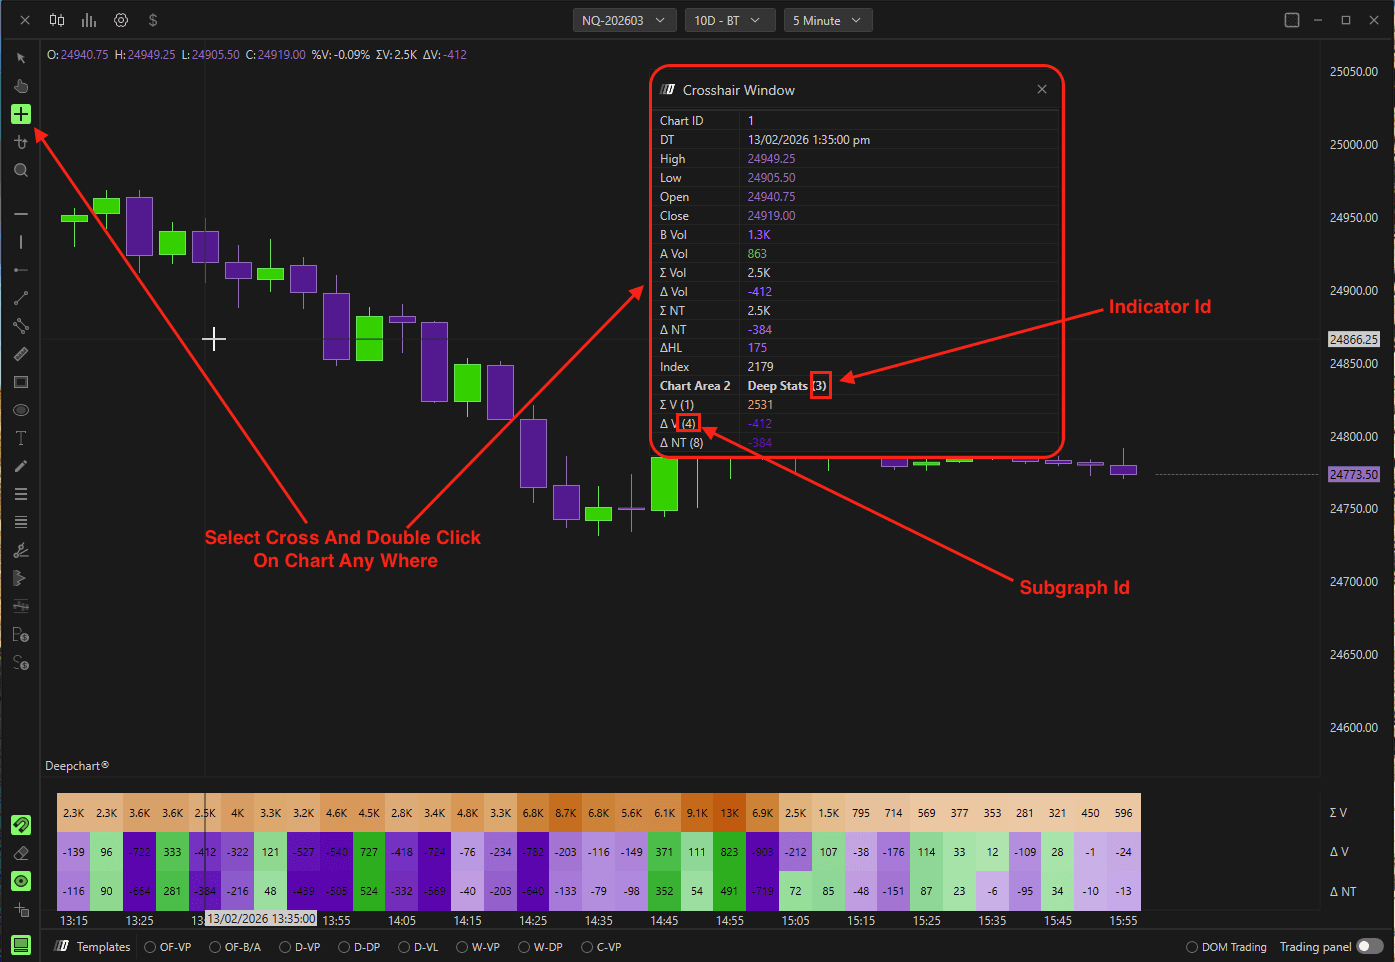
To load Delta from Deep Stats:
Add Deep Stats to your chart.
Open its settings.
Identify the Indicator ID and Subgraph ID.
Enter those values into Deep Pattern Builder.
Constant Input
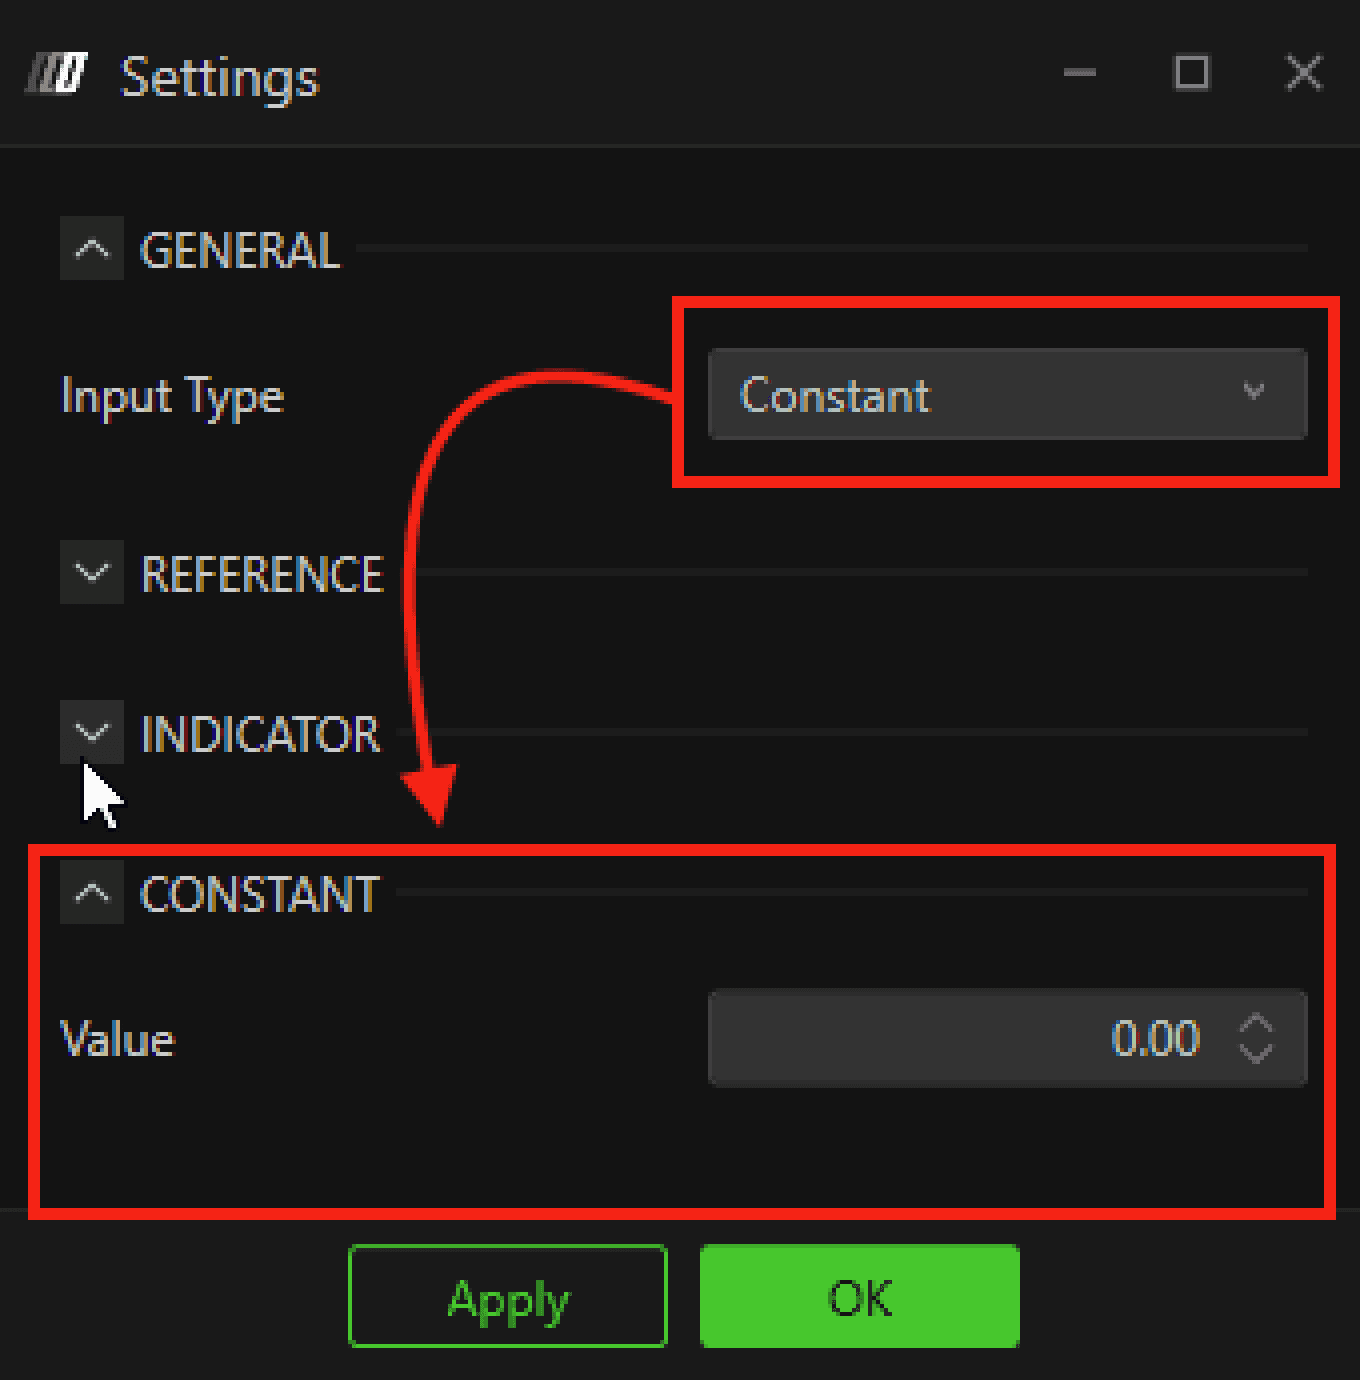
Allows manual entry of a predefined numeric value.
Math Operator 1 & 2
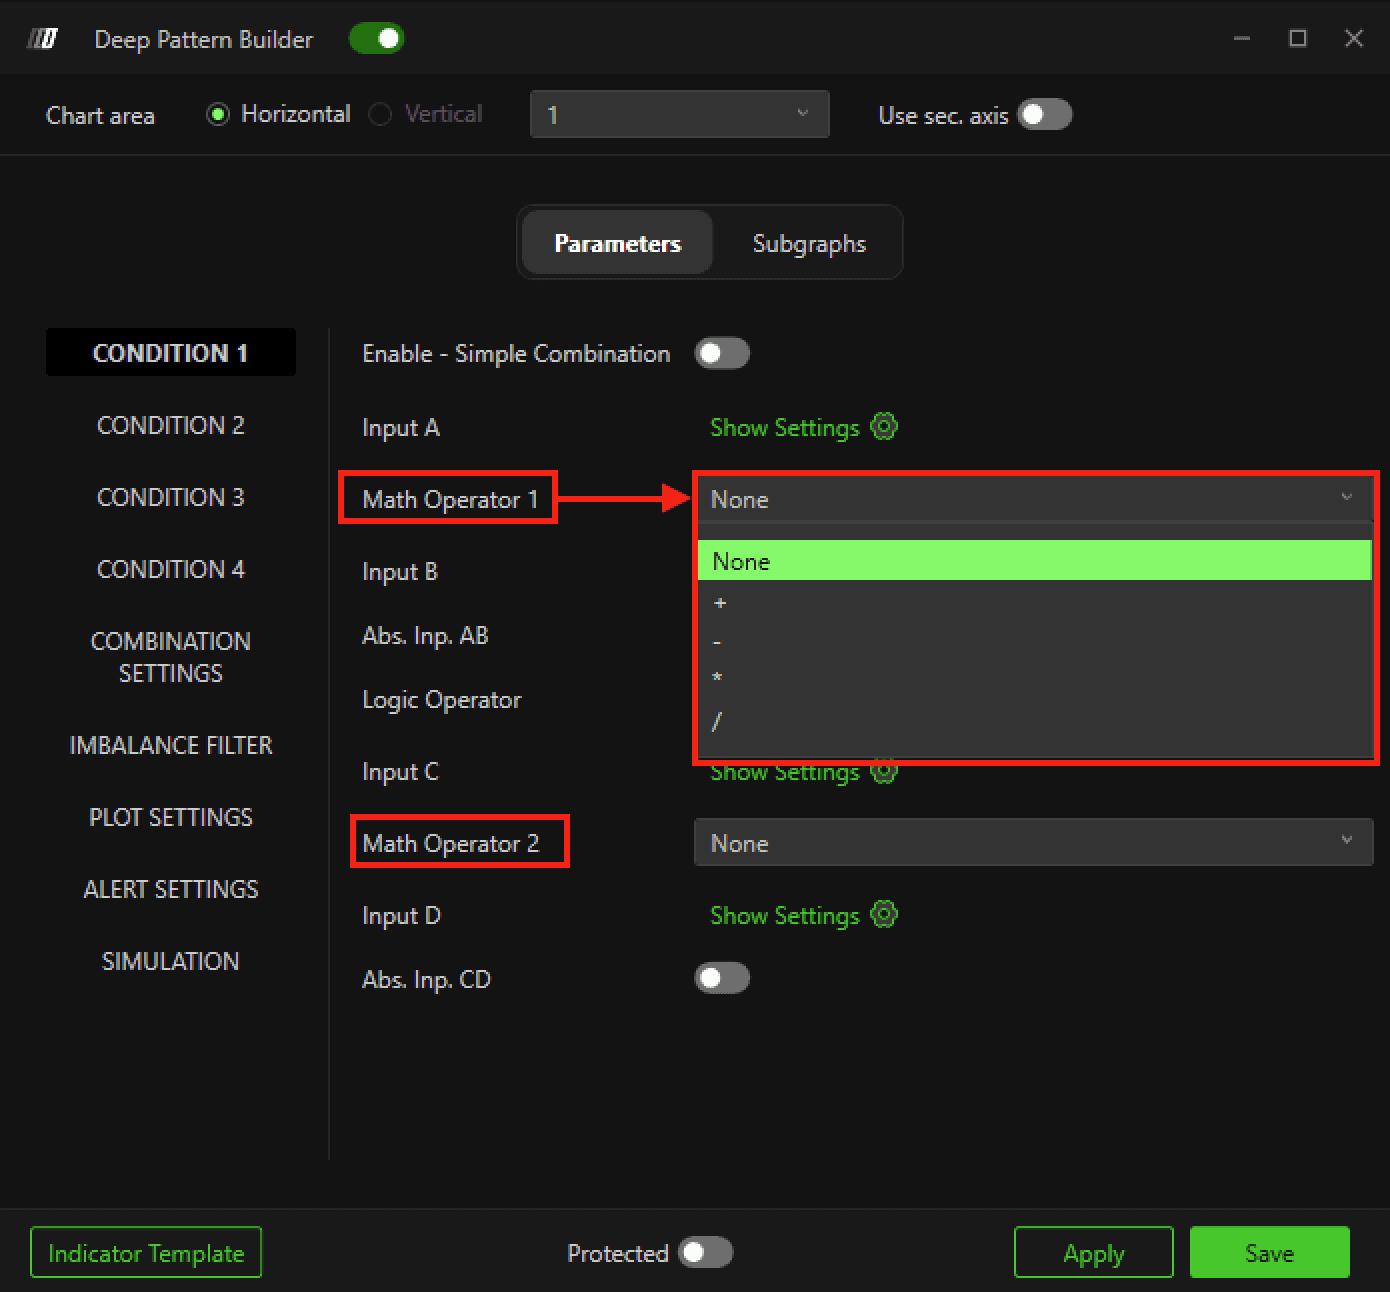
Math Operator 1: Between Input A and B
Math Operator 2: Between Input C and D
Logical Operator
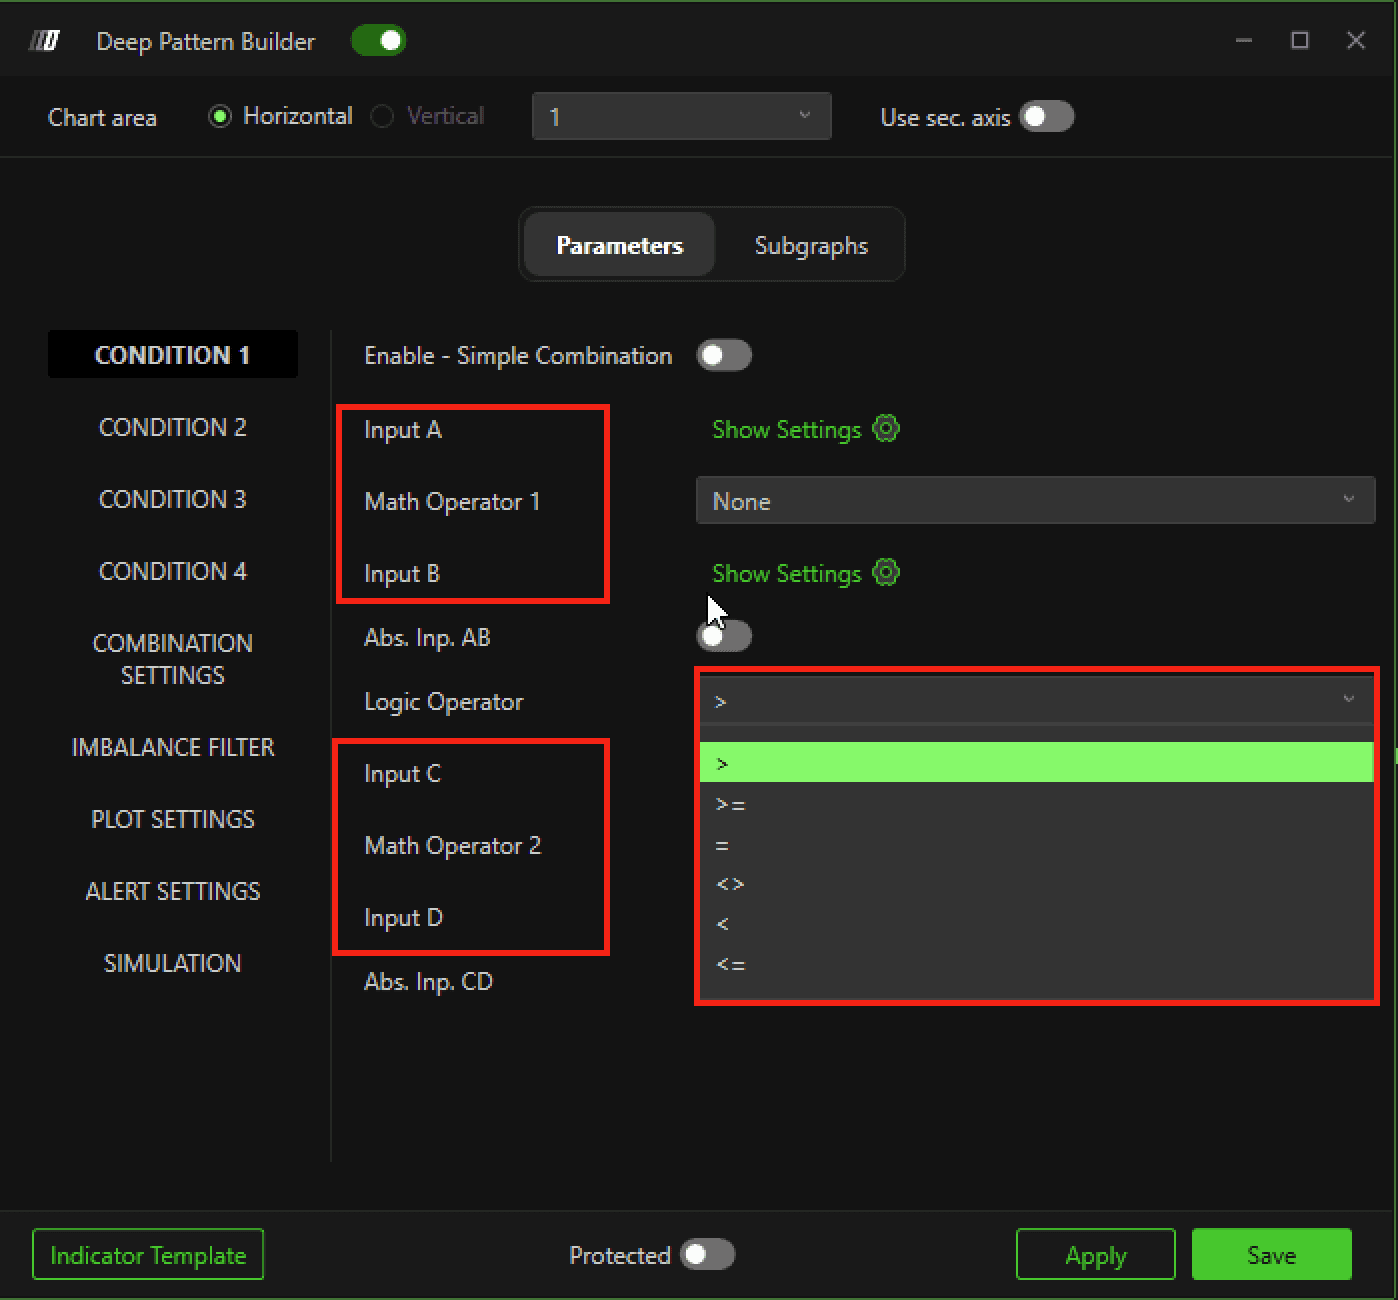
Located between the AB block and CD block.
Defines the final comparison between the two calculated results.
5. Condition Combine Mode
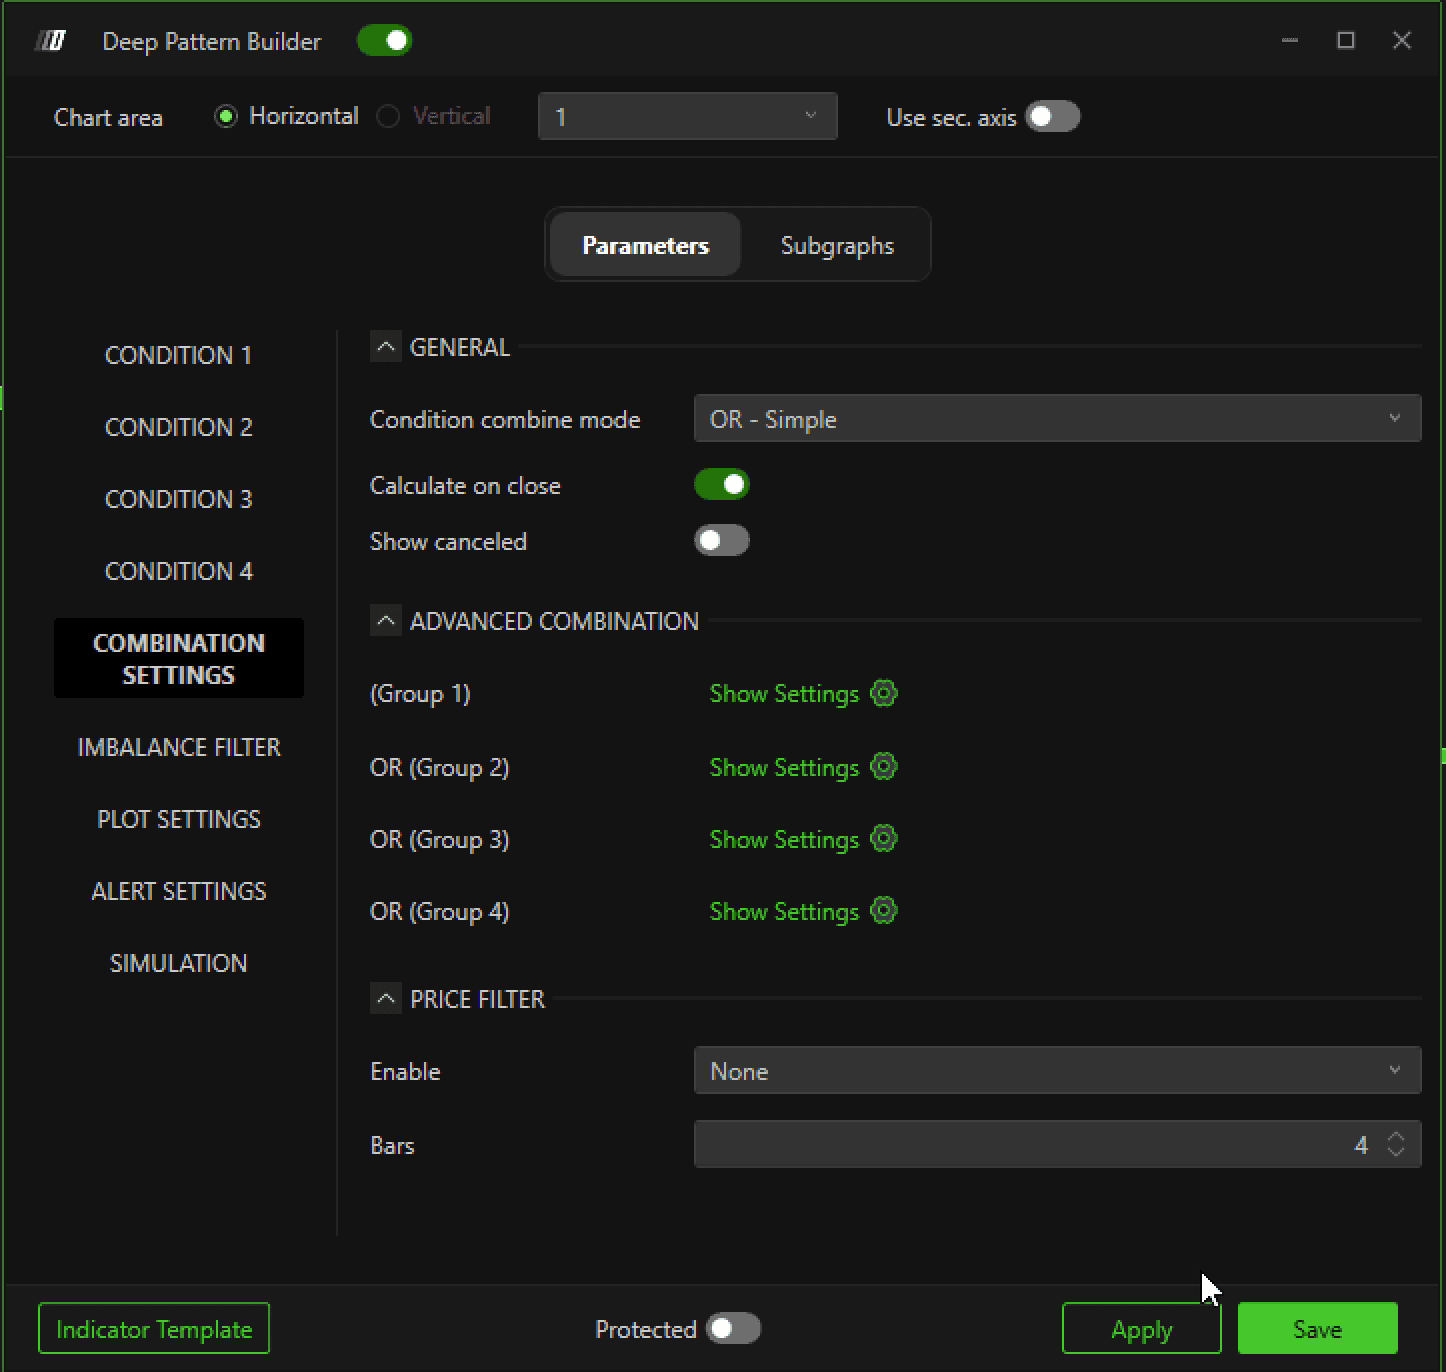
Located under Combination Settings.
OR – Simple
All enabled conditions are combined using OR.
Example with 3 conditions:
Condition1 OR Condition2 OR Condition3
AND – Simple
Condition1 AND Condition2 AND Condition3
AND + OR – Advanced
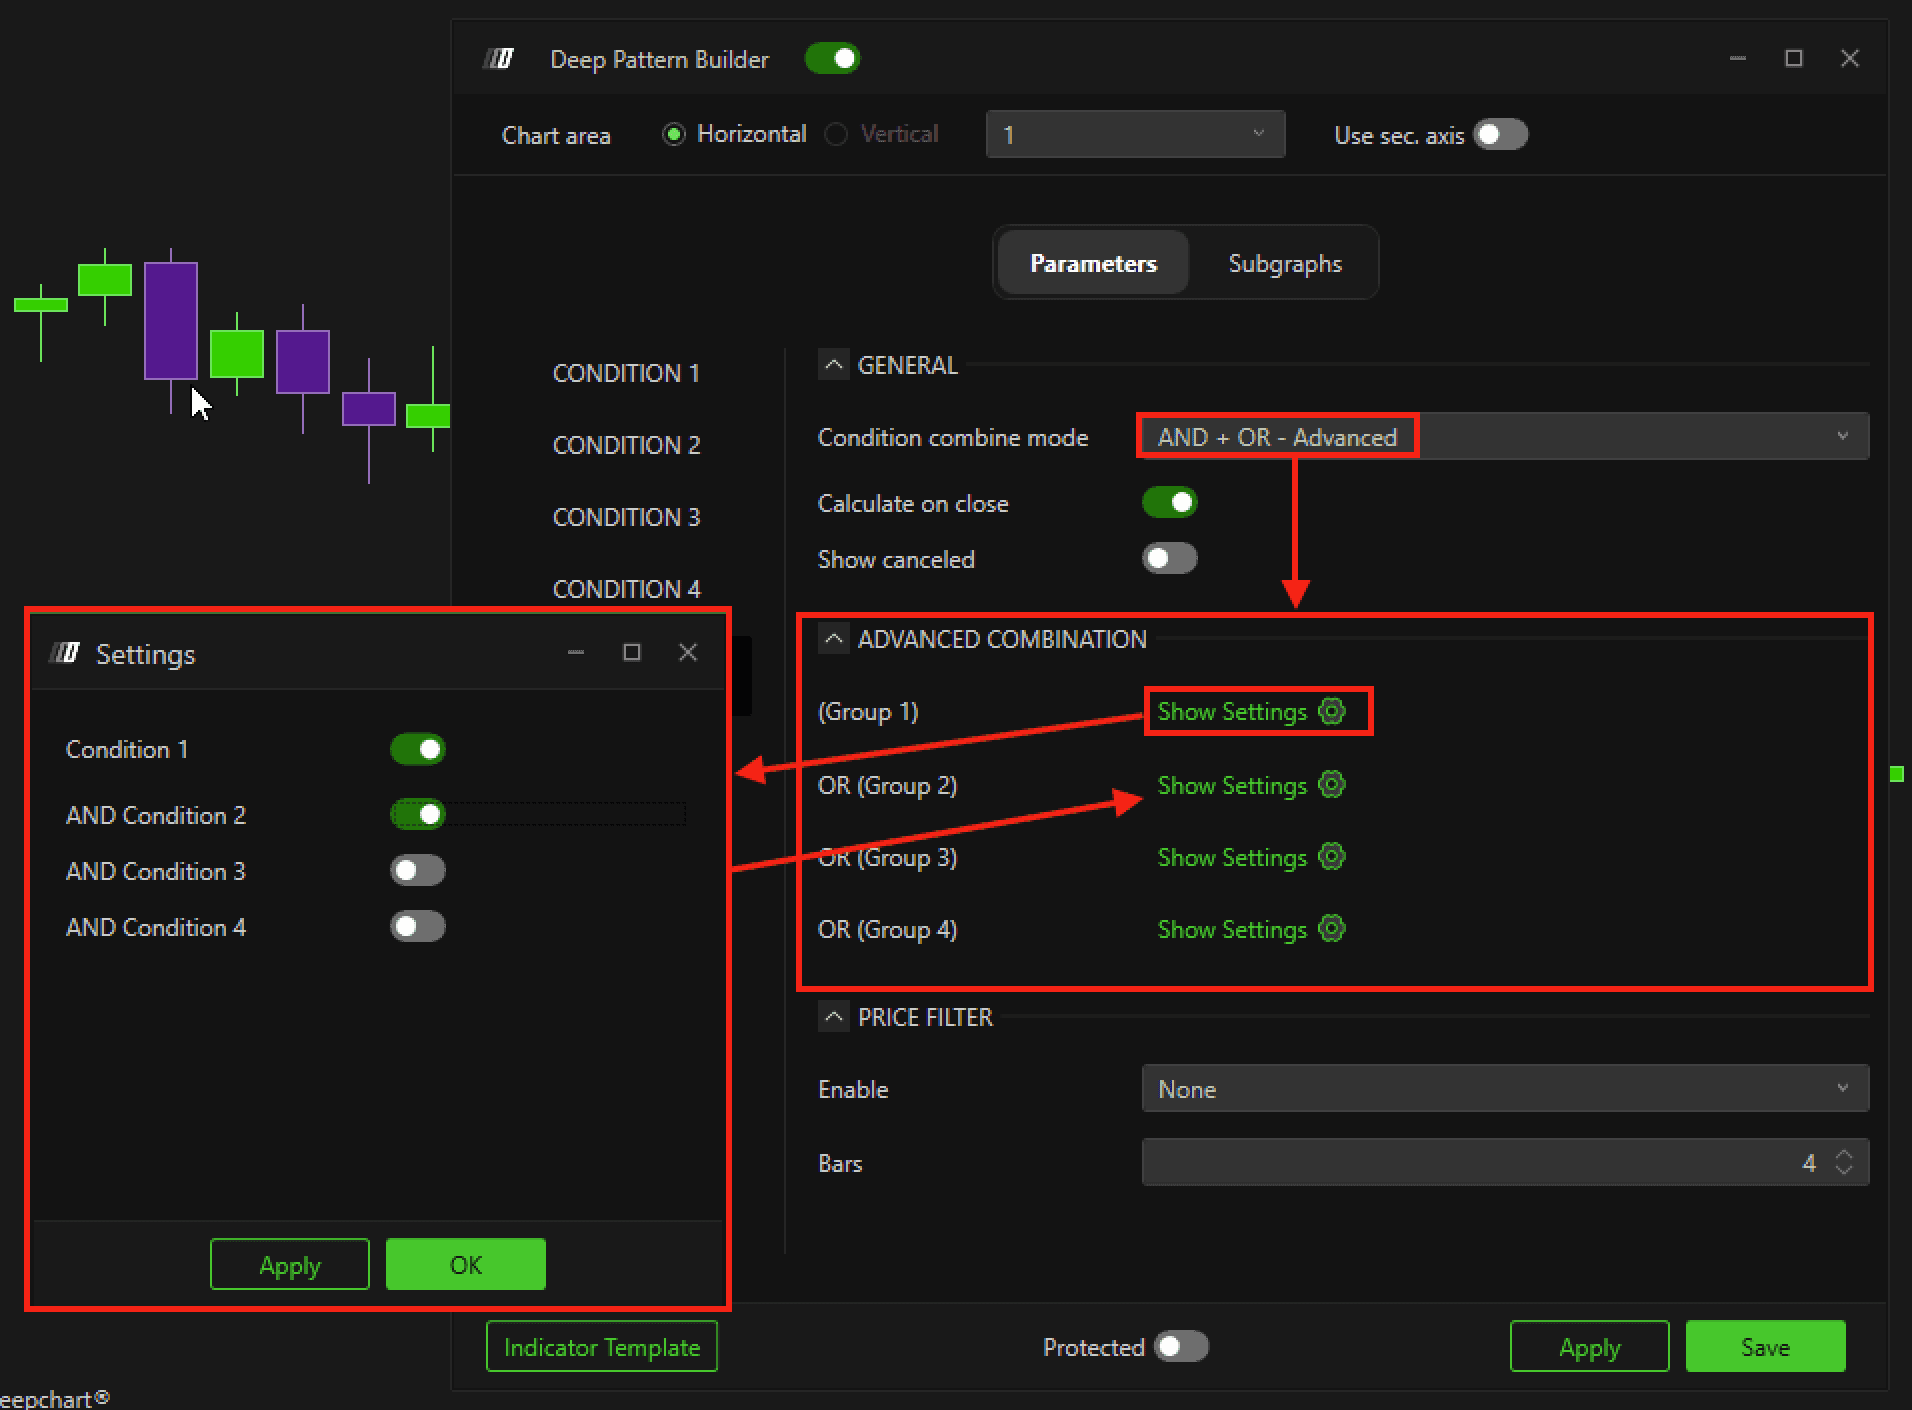
Condition1 AND Condition2 AND Condition3
Calculate on Close
If enabled, conditions are evaluated only after the candle closes.
6. Imbalance Filter
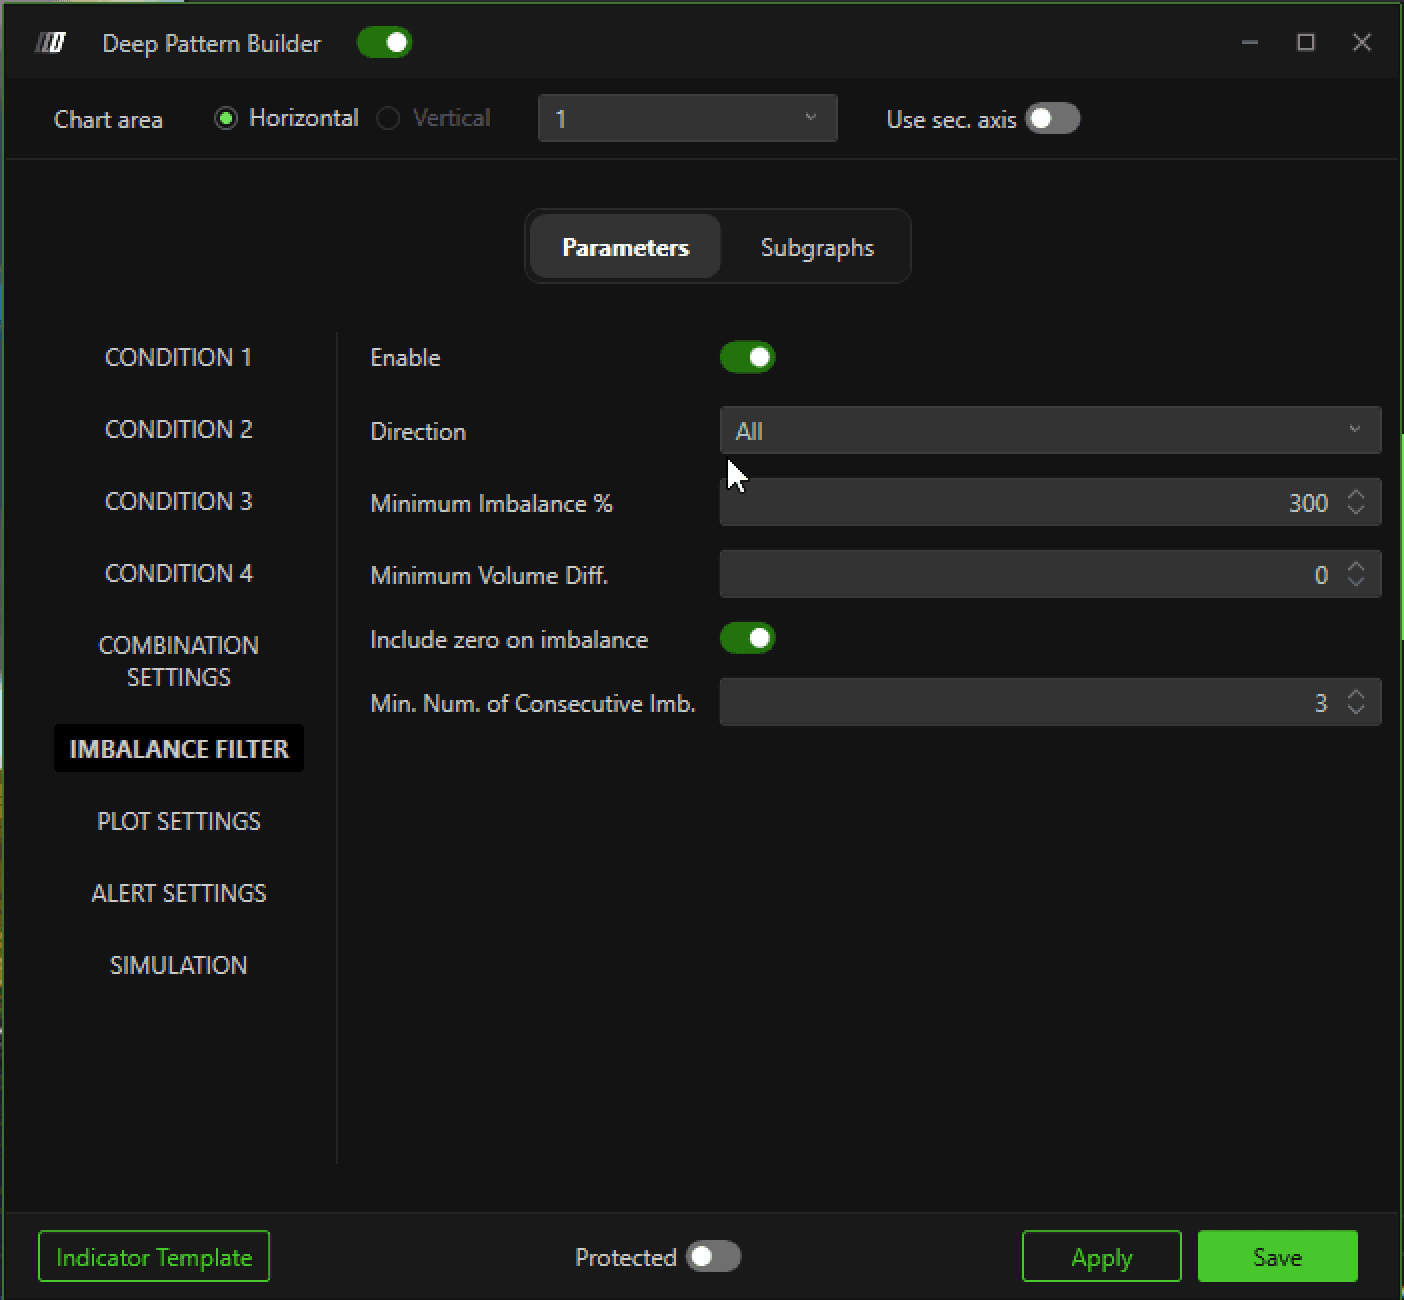
You can add imbalance filters directly from this section.
The configuration is similar to the Imbalance Tracker indicator.
7. Plot Settings
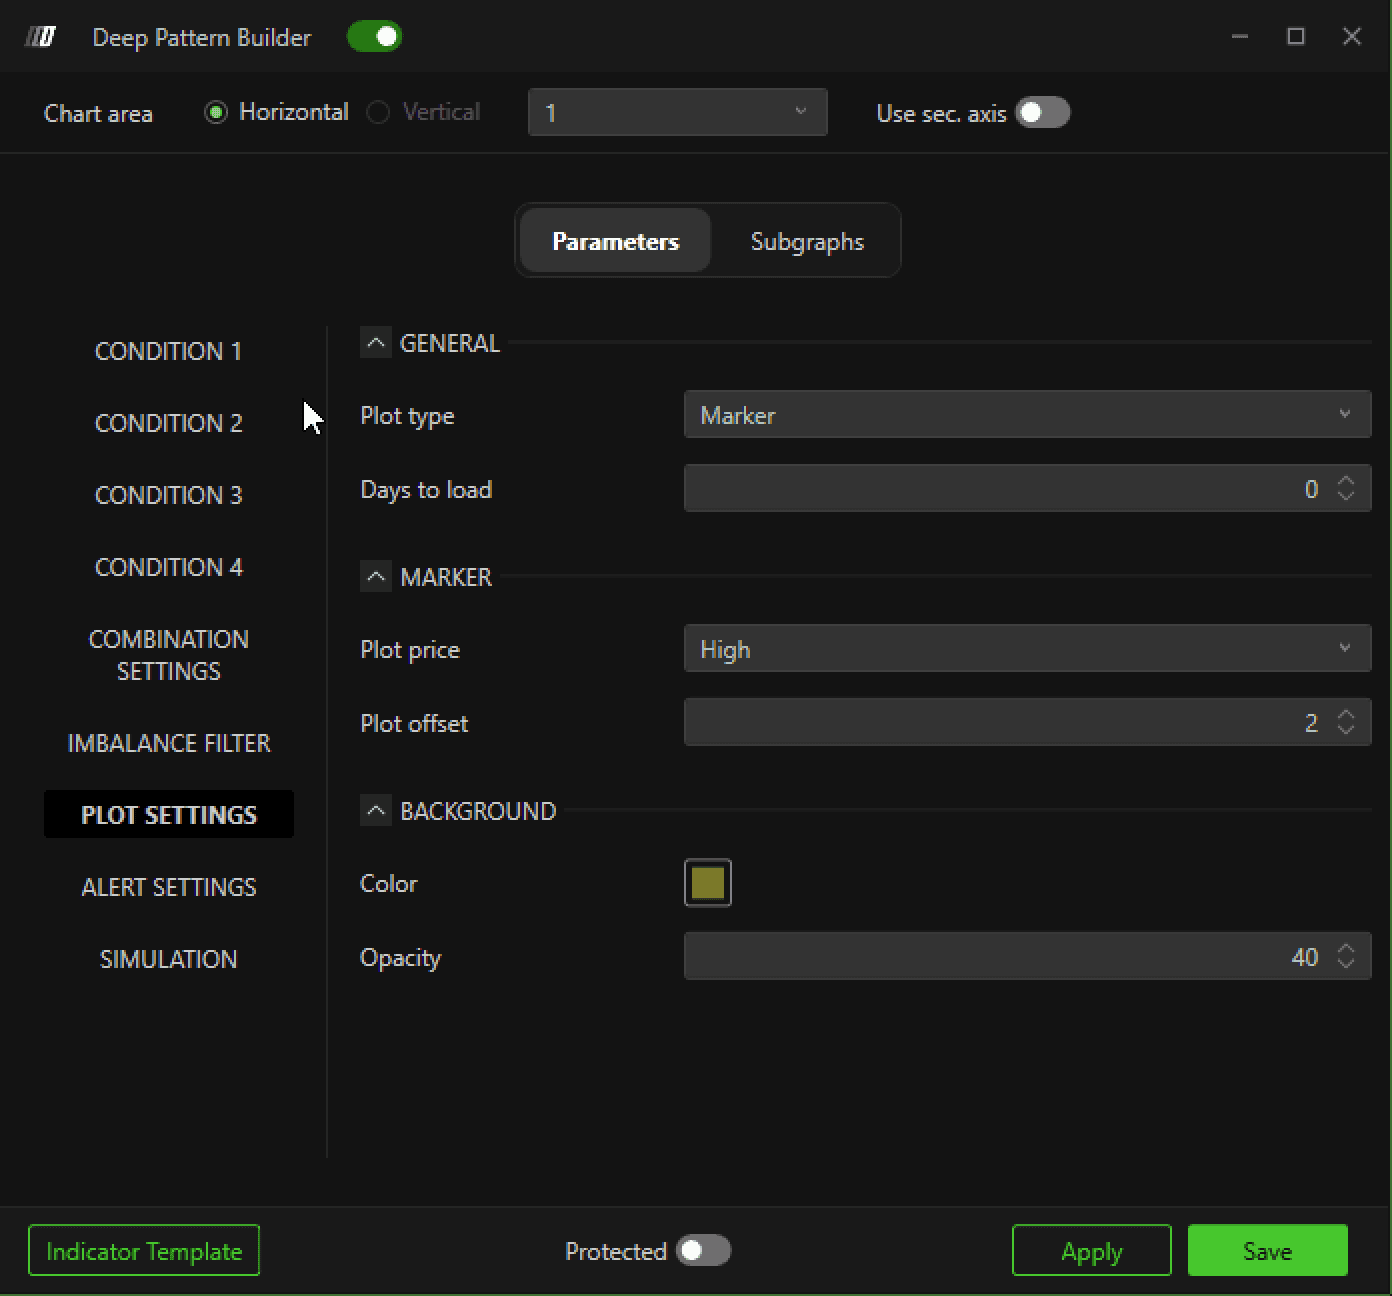
Defines how the signal appears on the chart.
Plot Type
Marker – Displays a marker only
Background – Highlights the candle background
Series & Background – Displays both marker and background
Days to Load
Defines how many historical days to calculate.
Plot Price
High – Above the candle
Low – Below the candle
Current – At candle close
Mid Price – Middle of the wick
Color
Select marker or background color.
Opacity
Adjust background transparency.
8. Alert Settings
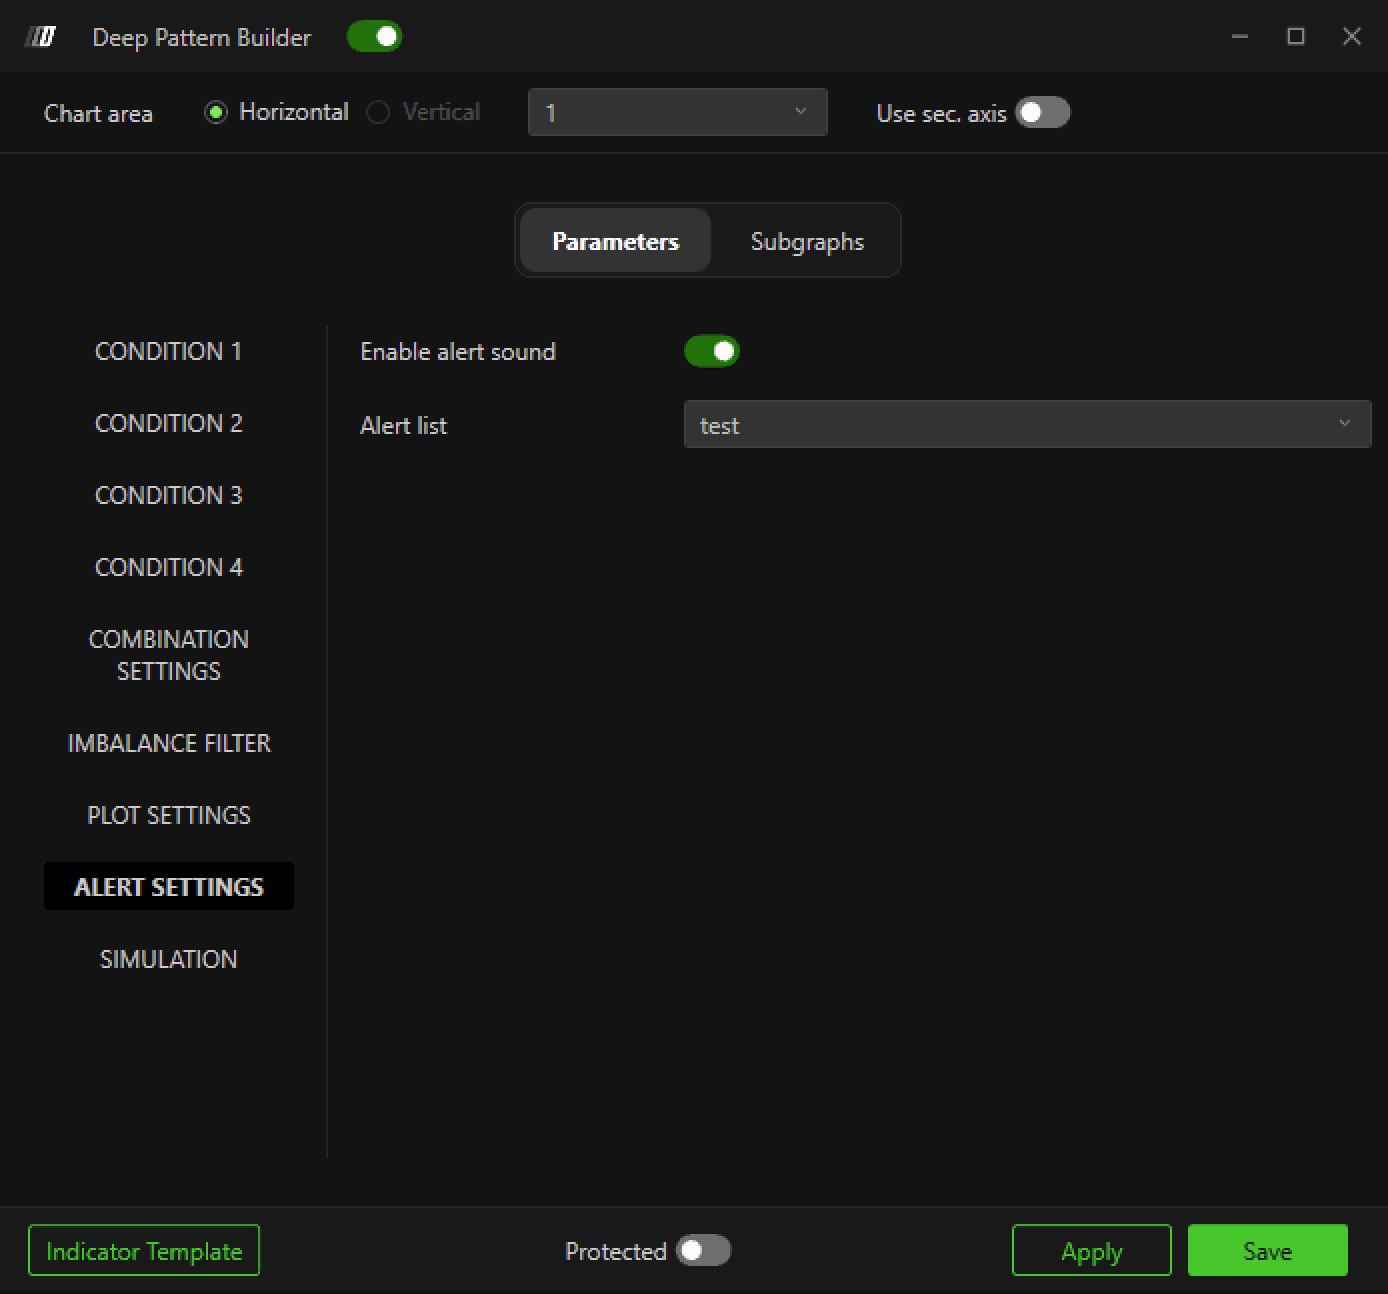
Before using alerts:
Go to Options → Add Alert.
Create your alert.
It will then appear in the alert list inside Deep Pattern Builder.
9. Simulation (Automatic Backtesting)
The Simulation section allows you to backtest your custom logic automatically.
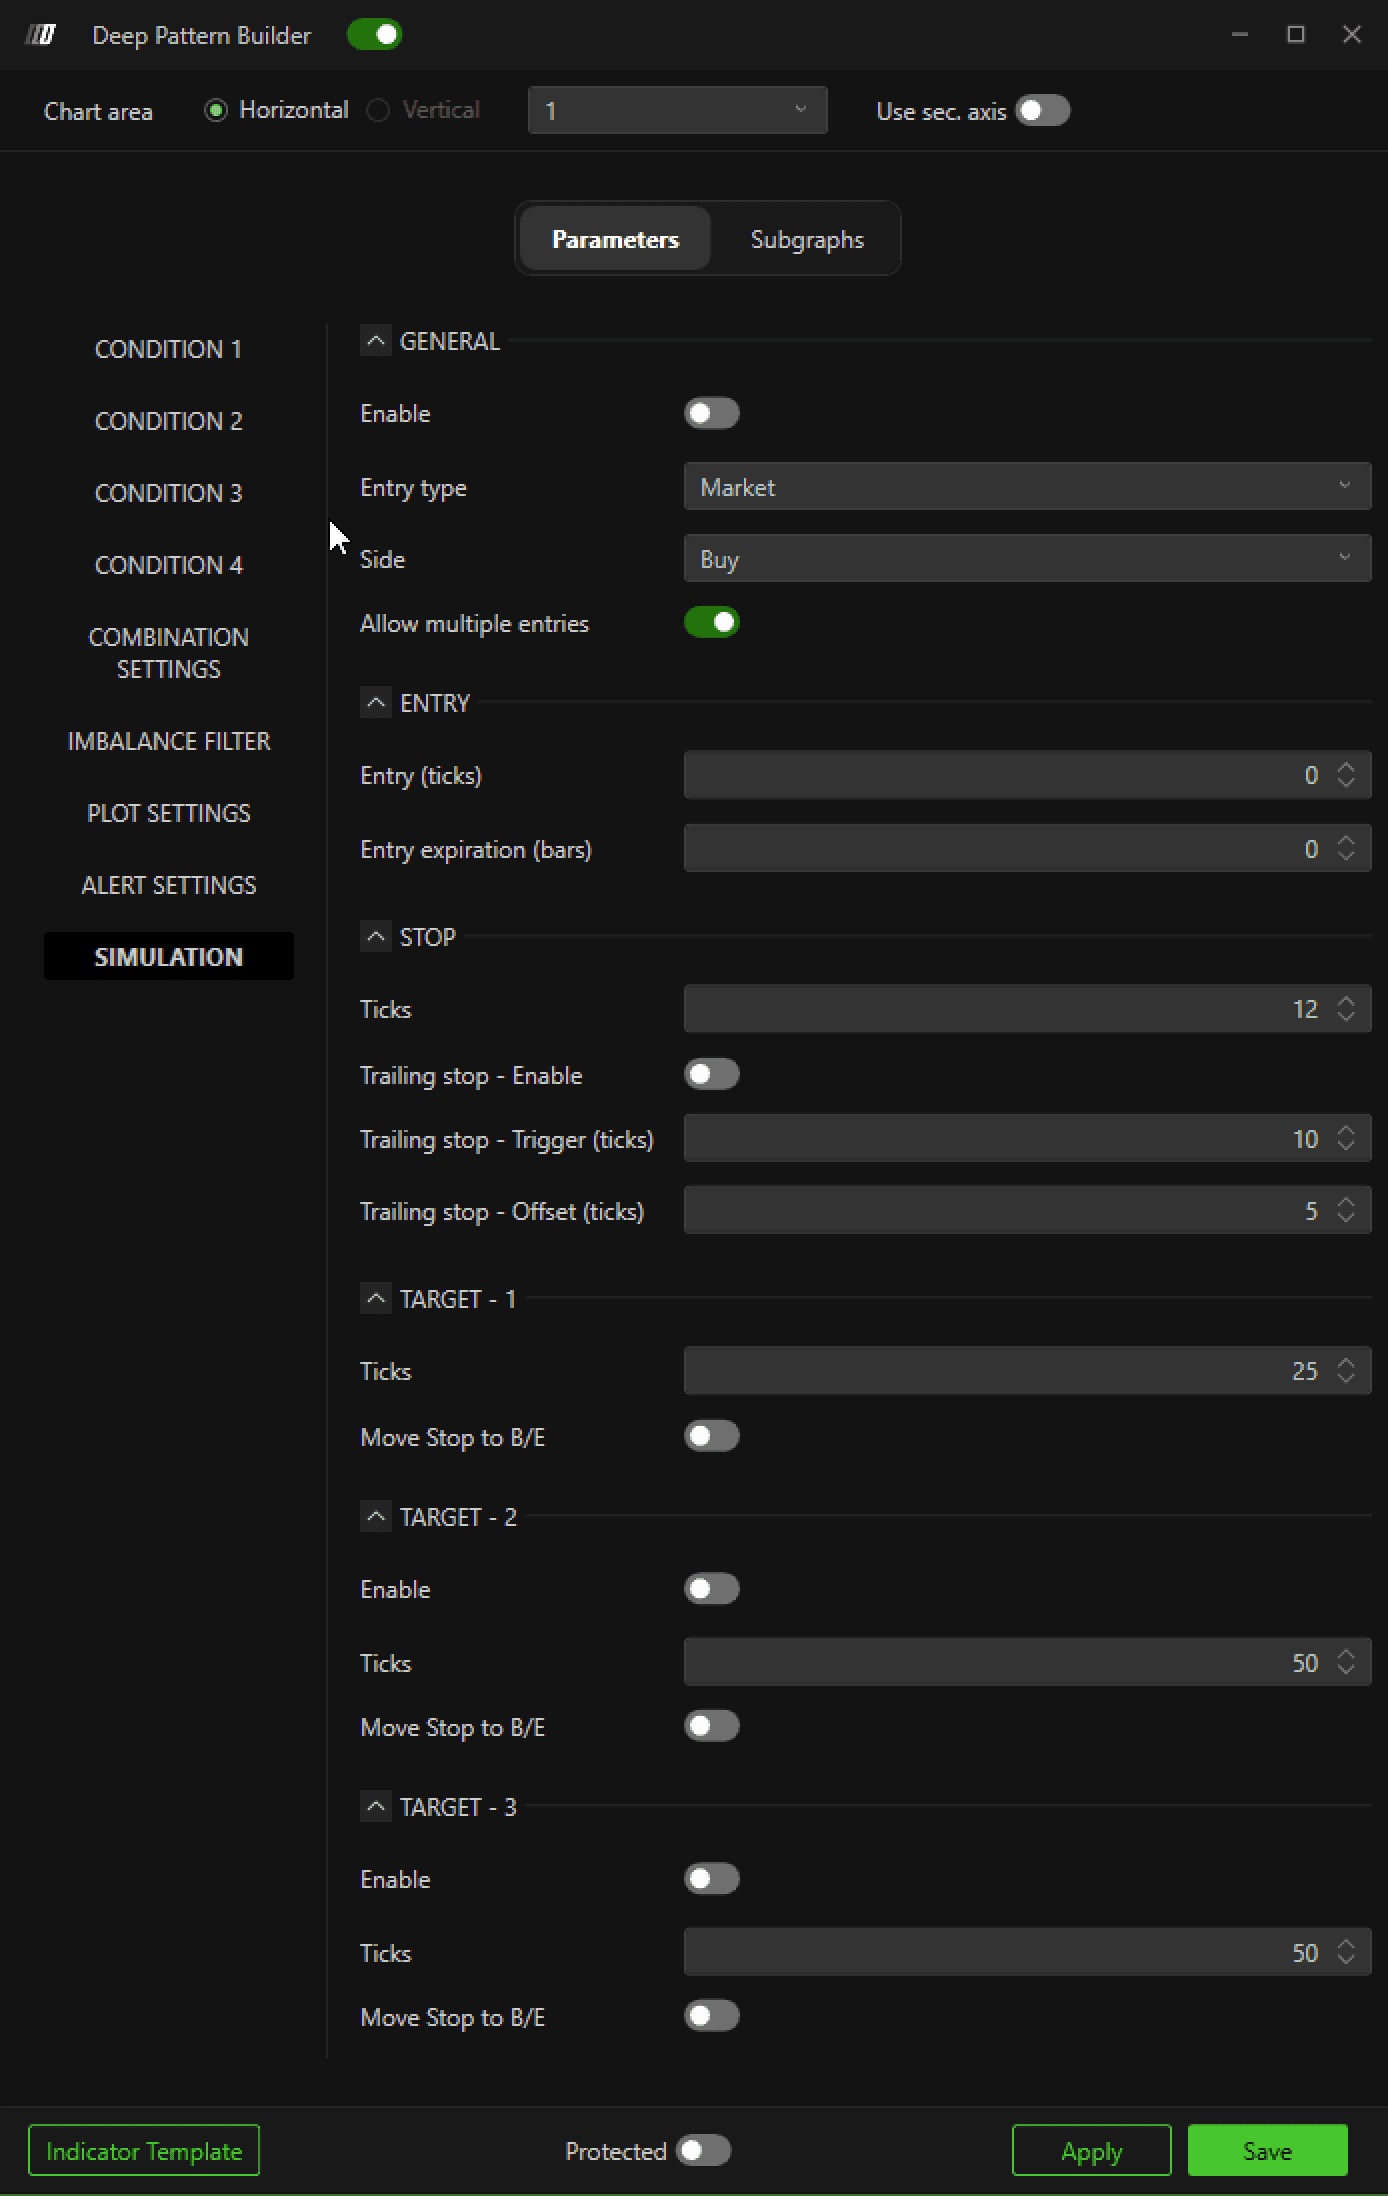
Enable
Activates simulation.
Entry Type
Market – Enters immediately at market price
Half Bar – Entry logic based on half-bar calculation
Ticks from Close – Places a limit order X ticks from candle close
Side
Choose Buy or Sell.
Allow Multiple Entries
If enabled, new signals can open additional positions even if one is already active.
Entry Expiration (Bars)
If set to 2, for example, the order must fill within the next 2 bars. Otherwise, it is cancelled.
Stop Settings
Stop (Ticks)
Fixed stop-loss in ticks.
Trailing Stop – Enable
Activates trailing stop.
Trailing Stop – Trigger (Ticks)
Defines how many ticks in profit before trailing activates.
Trailing Stop – Offset (Ticks)
Distance in ticks between price and new stop after activation.
Targets
You can configure multiple targets:
Define each target in ticks.
Enable Move to Break Even (B/E) so the stop moves to entry once a target is reached.
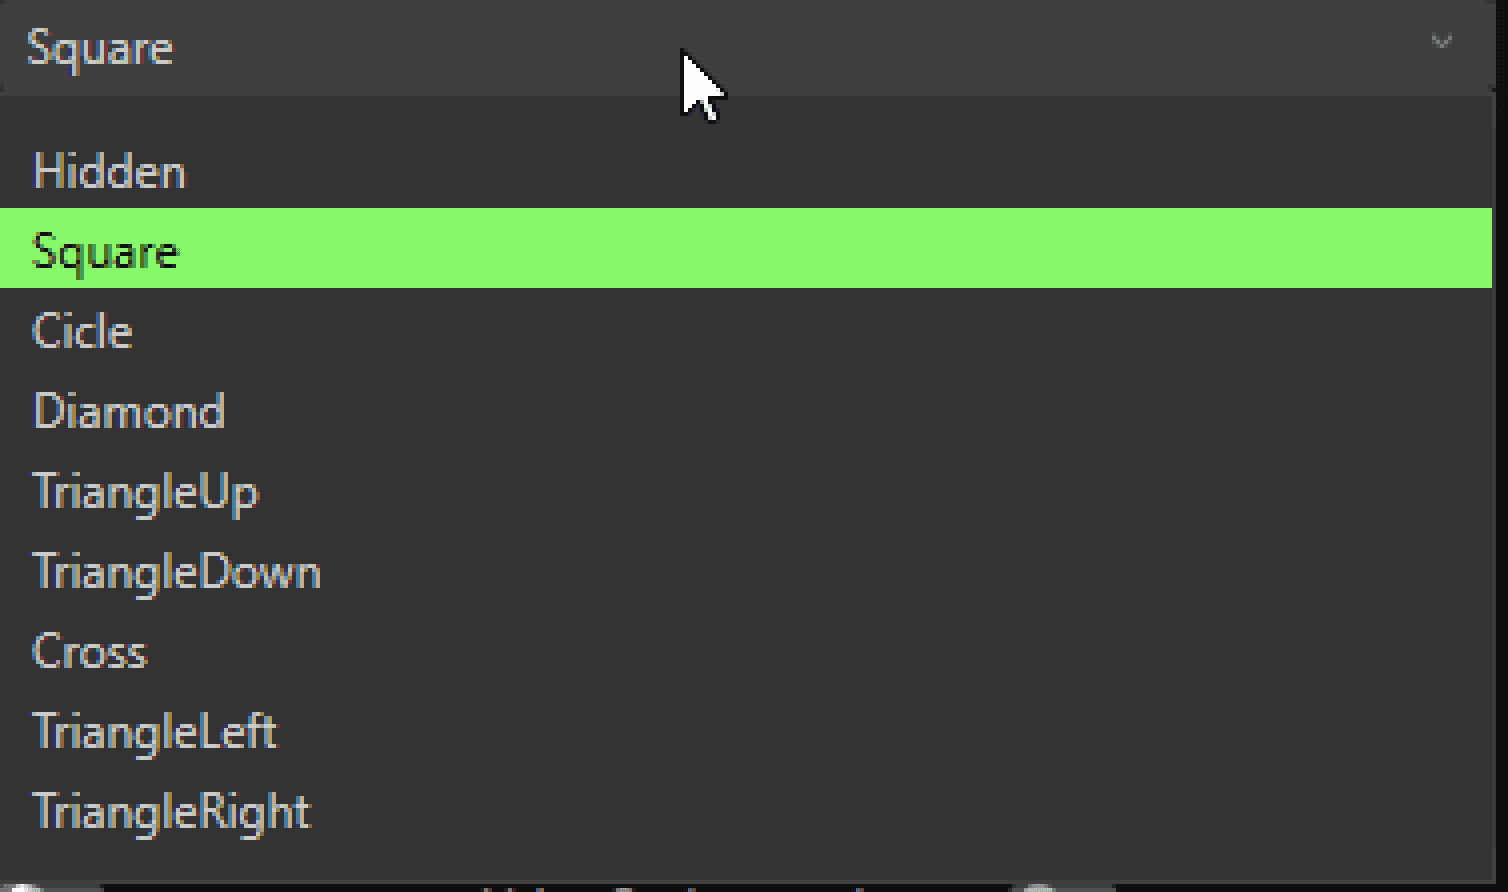
10. Subgraph
Color: Set the color of the bid marker
2 Color: Set the color of the ask marker
Subgraph style: you can select any style of the marker from here
11. Running the Backtest
Once all settings are configured:
Click Apply and Save.
Right-click on the chart.
Select Autotrading → Execute Backtest.
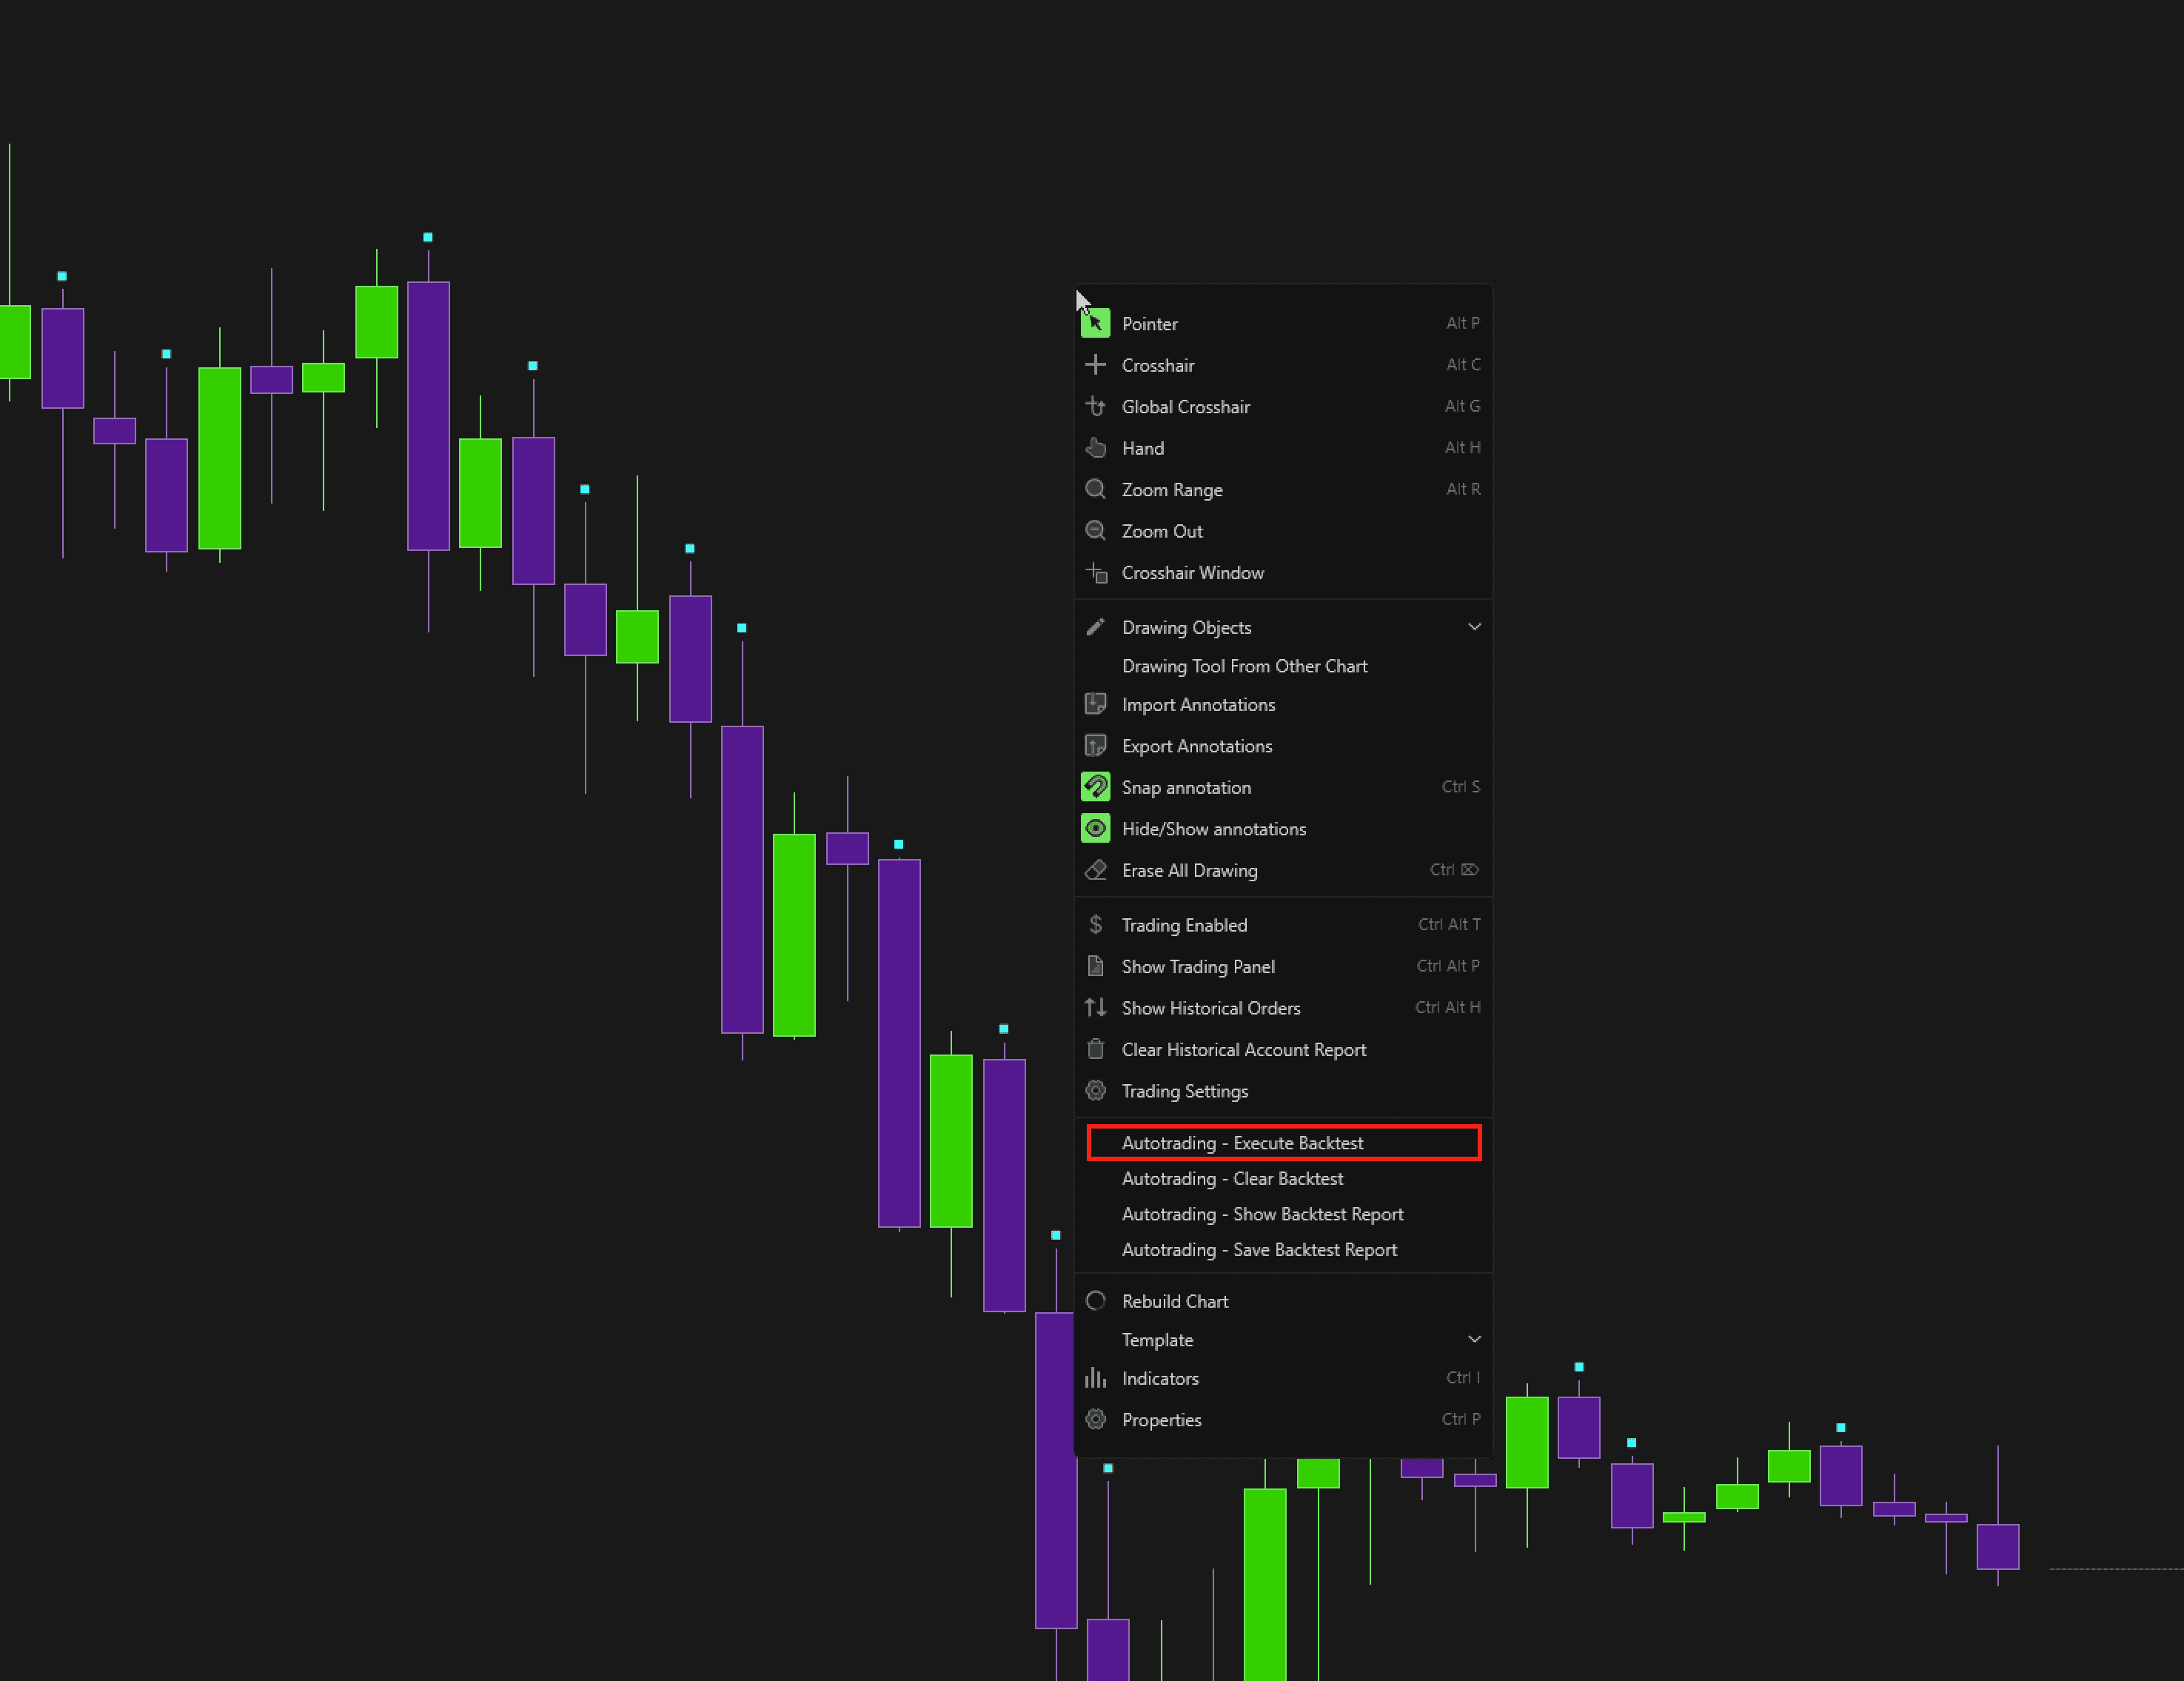
The simulation will run and generate a performance report.
You can:
Clear results
View previous backtests
Save the backtest report (right-click option)