Indicators
Updated:
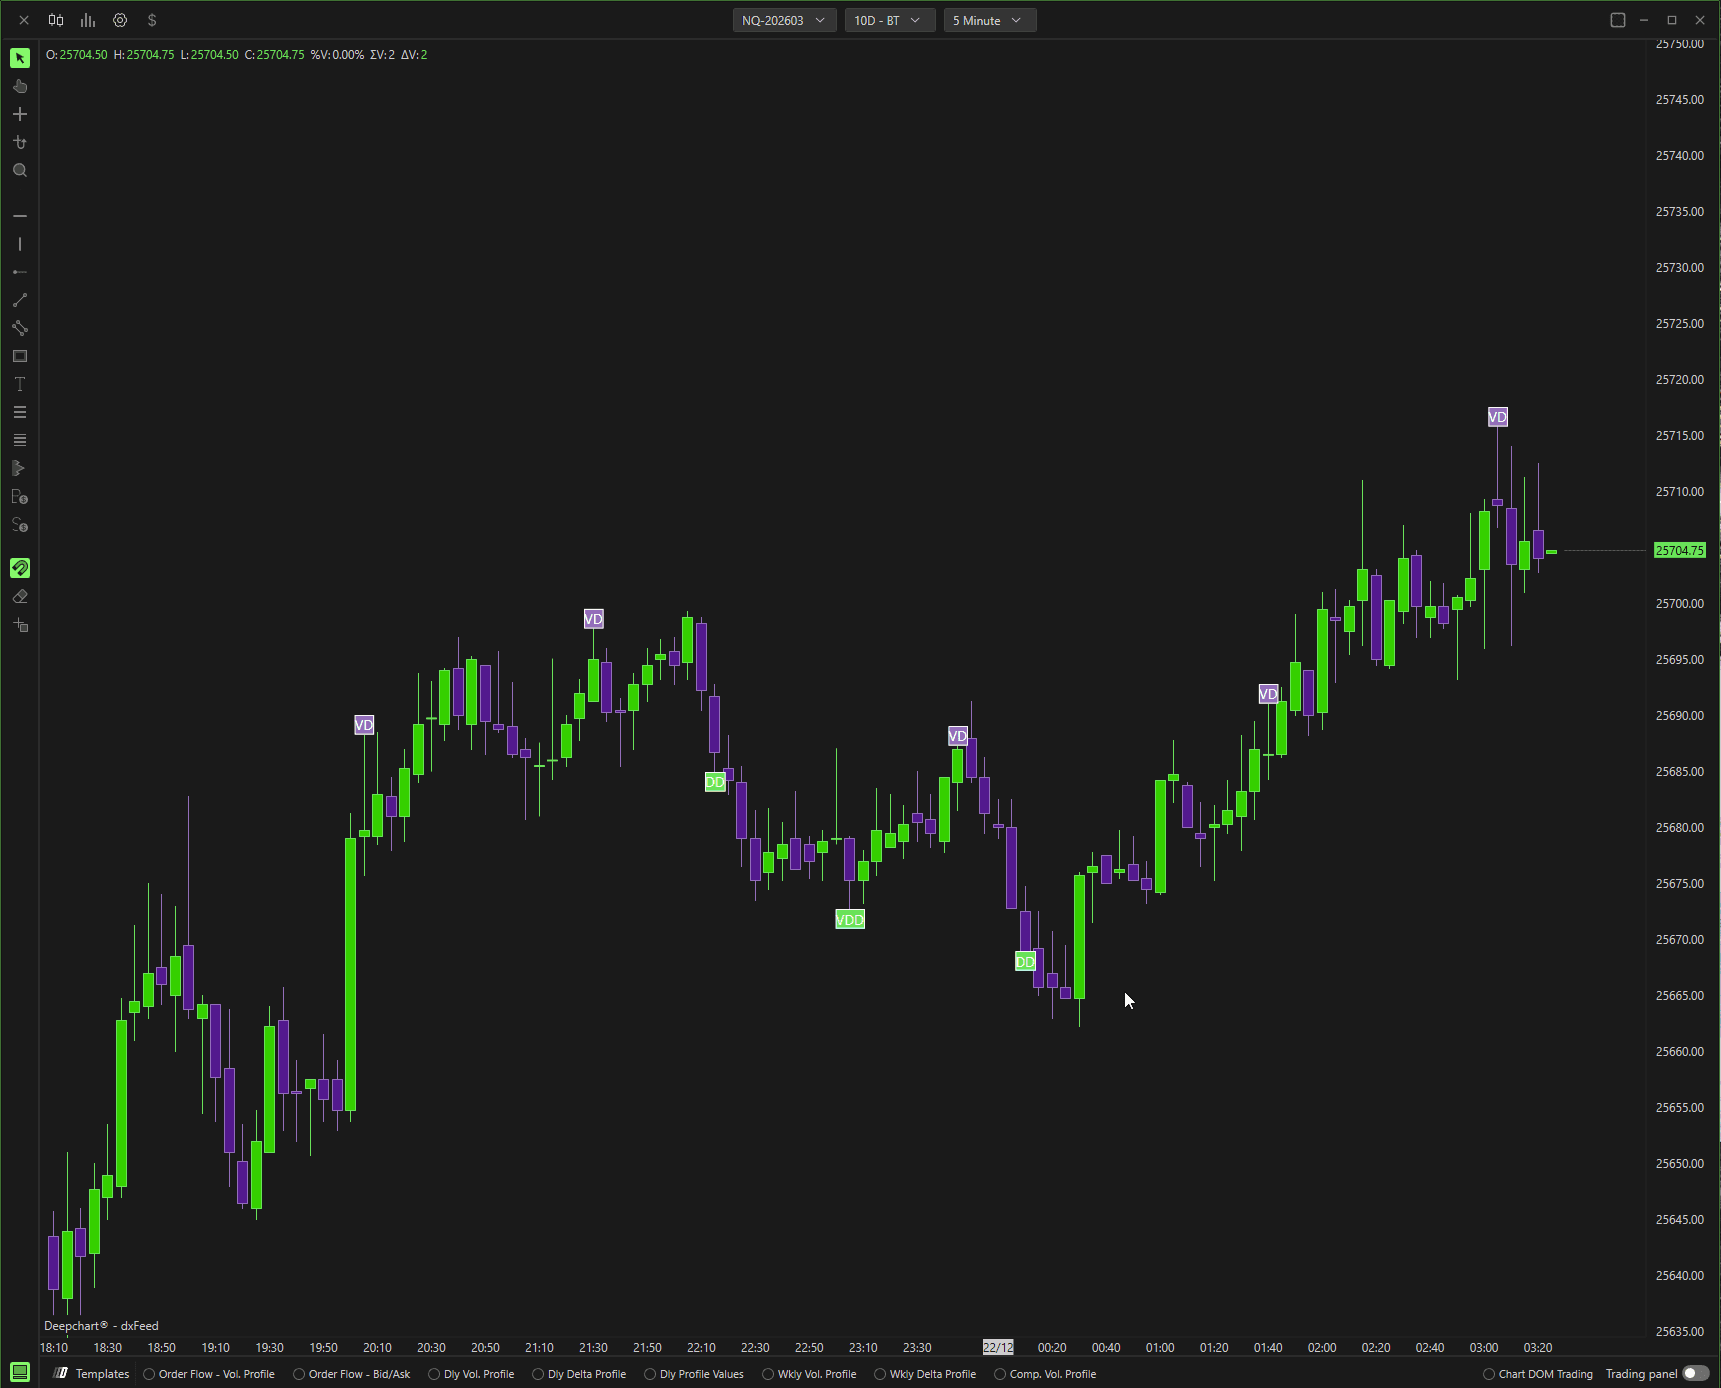
The Divergence Detector of DeepChart highlights any volume or delta divergence through the use of labels directly on the chart. The indicator identifies a volume divergence when a new relative high or low is made without a corresponding increase in volume, likewise it identifies a delta divergence when a new relative high or low is made without a corresponding increase/decrease in cumulative delta. Such situations can figure as false breaks, decrying possible reversals.
General

Calculation Mode (1)
Defines which divergences to display.
1. Volume
Shows only volume divergence through the VD (Volume Divergence).
2. Delta
Shows only delta divergence through the DV (Delta Divergence).
3. Volume and delta
Shows both volume and delta divergences through the VDD (Volume Delta Divergence) label, the latter being the most significant divergence.
Calculation Mode (2)
Defines the mode-of-calculation:
1. Tick
Calculates the divergence at the break of the previous high or low tick point.
2. Sec. to close
Calculates the divergence at certain seconds from the candle's close.
3. Close
Calculates divergence at candle close.
Maximum Seconds To Close
Defines the number of seconds maximum in the mode of calculating Sec. from closure.
Zig Zag Settings
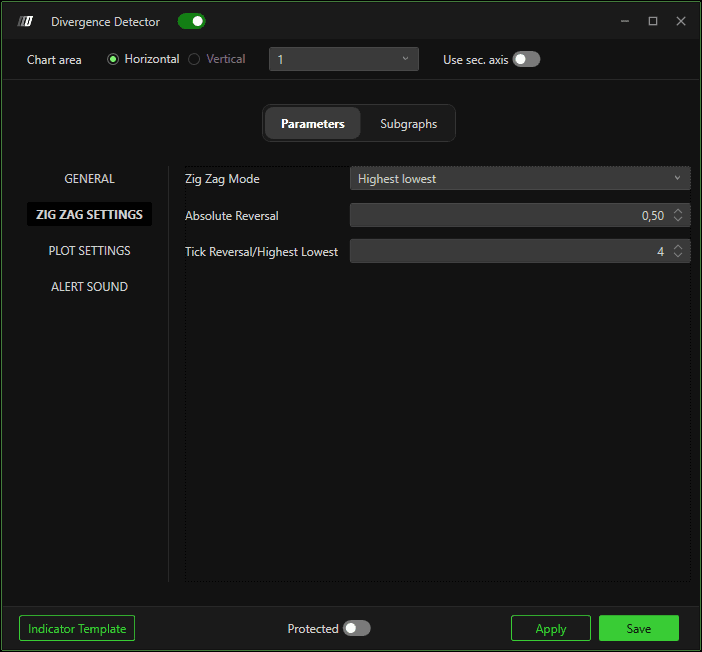
Zig Zag Mode
The Divergence Detector indicator for identifying swing points is based on the Zig Zag, which can be set in different ways:
1. Absolute Reversal
Use a fixed price reversal value to determine a swing. It requires sufficient price movement in the opposite direction from the current trend to determine the reversal and identify a new swing.
2.Tick Reversal
The reversal is tick-based, allowing you to define a minimum amount of tick movement to generate a'reversal.
3. Highest lowest
The reversal is based on the ticks difference between the maximum and minimum of the swing.
Absolute reversal
Defines the parameter of the absolute reversal mode.
Tick Reversal/Highest Lowest
Defines the parameter for the mode. reversion tick and highest lowest.
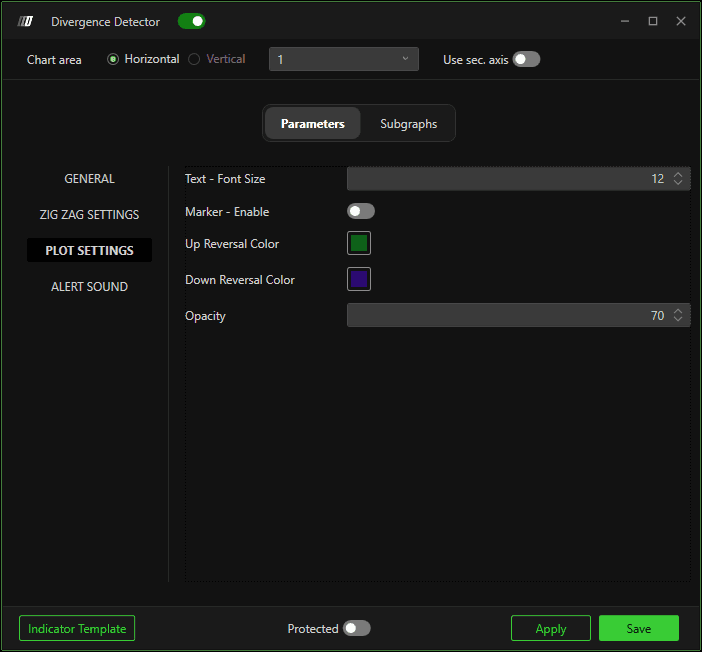
Plot Settings
Lets you change the size of the text and the distance ticks from the maximum or minimum of the candle to which the candle will be. plotted on the label provided by the indicator.
Alert Sound
Allows you to enable a sound notification.
Subgraphs
In this section it will be possible to change the background and text color of the labels.