Indicators
Updated:
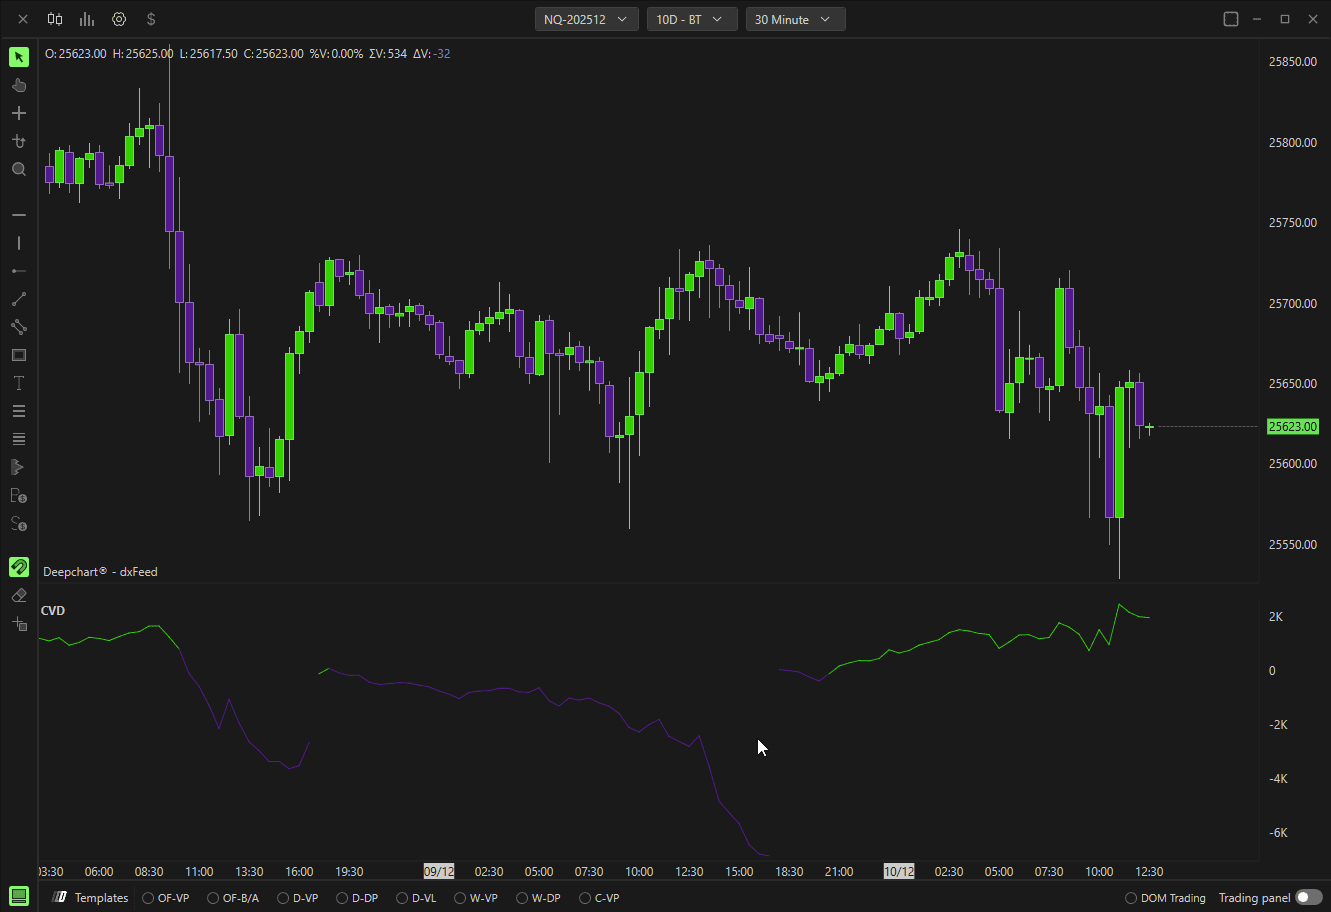
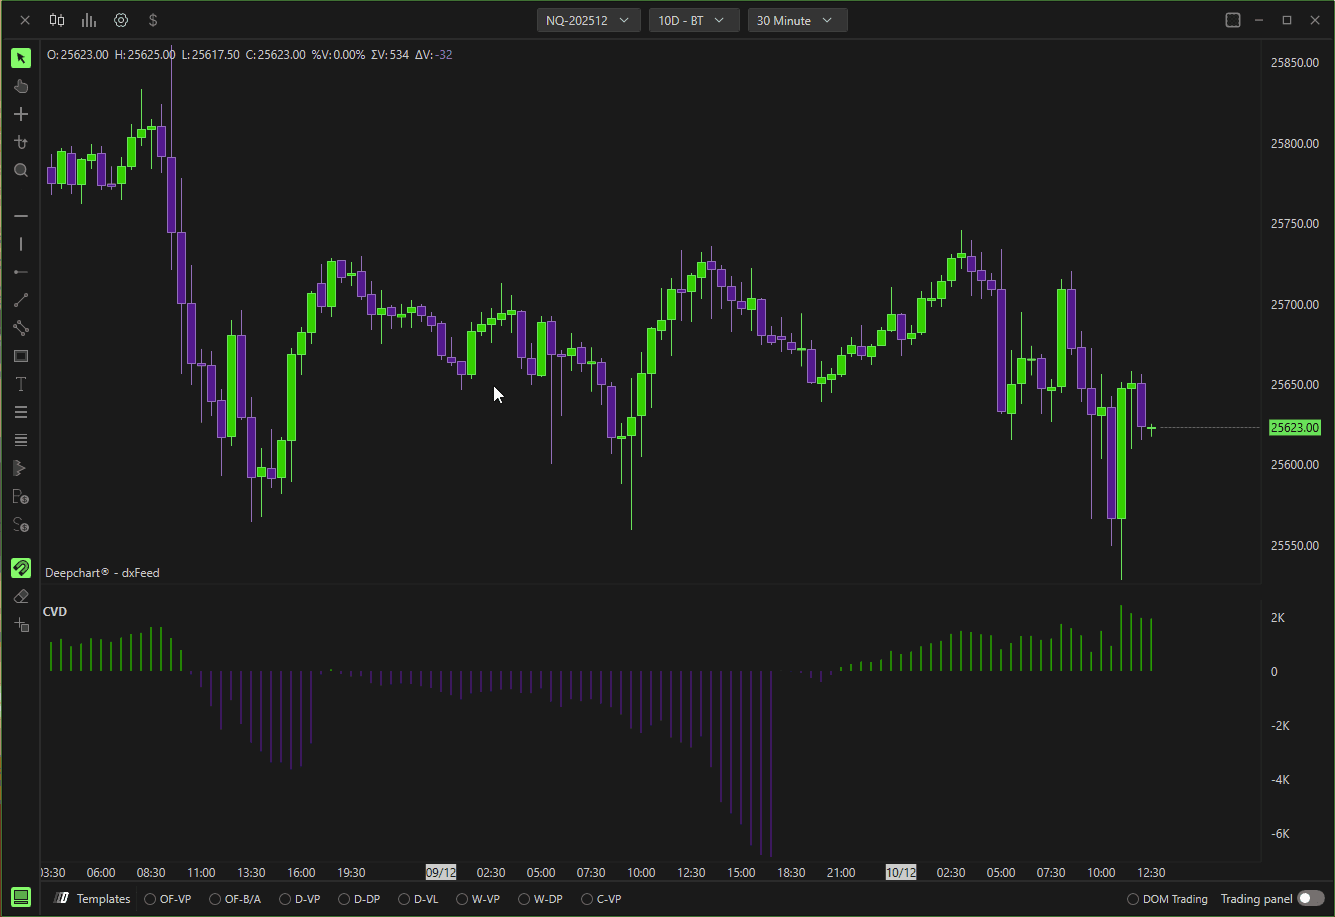
DeepChart Delta Cumulative Histogram indicator allows the user to visualize through bars or a line at the foot of the chart, the cumulative delta summation of each candle's delta, i.e., the difference between sell market and buy market, allowing the user to identify which side of the market is more aggressive.
General Settings
By clicking on the indicator settings icon, the configuration window will open. From there, you can customize the behavior, data source, and visual appearance of the indicator according to your trading preferences.
Parameters
Input data
Defines which data source is used to calculate the cumulative delta. You can choose between:
1. Volumes
Uses the quantity of contracts or shares traded to calculate delta.
2. Trades
Uses the number of trades executed, regardless of their size.
Key difference:
Trades show how often an instrument is traded.
Volumes show how much of the instrument is traded.
For example:
An increase in Trades without a significant increase in Volumes indicates frequent trading with small order sizes.
An increase in Volumes without a corresponding increase in Trades suggests fewer traders executing large-sized orders.
you can read about input data from here …
Filter Min
Allows you to apply a minimum filter to the data used in the cumulative delta calculation. Values below this threshold are ignored.
Filter Max
Allows you to apply a maximum filter to the data.
If the value is set to 0, no maximum filter will be applied.
Restore at Start Session
When enabled, the Delta Cumulative Histogram resets at the start of each trading session, rather than continuing indefinitely across sessions.

Subgraphs
In this section, you can fully customize the appearance of the indicator:
Subgraph style: Choose the Bars or Line
Select the line style: Solid or Hatch
Adjust the line Width
Customize colors
Show or hide the indicator name and value
Assign a custom name to the indicator
Default behavior:
Green bars/line indicate a positive cumulative delta, showing buyer aggression.
Red bars/line indicate a negative cumulative delta, showing seller aggression.
