Indicators
Updated:
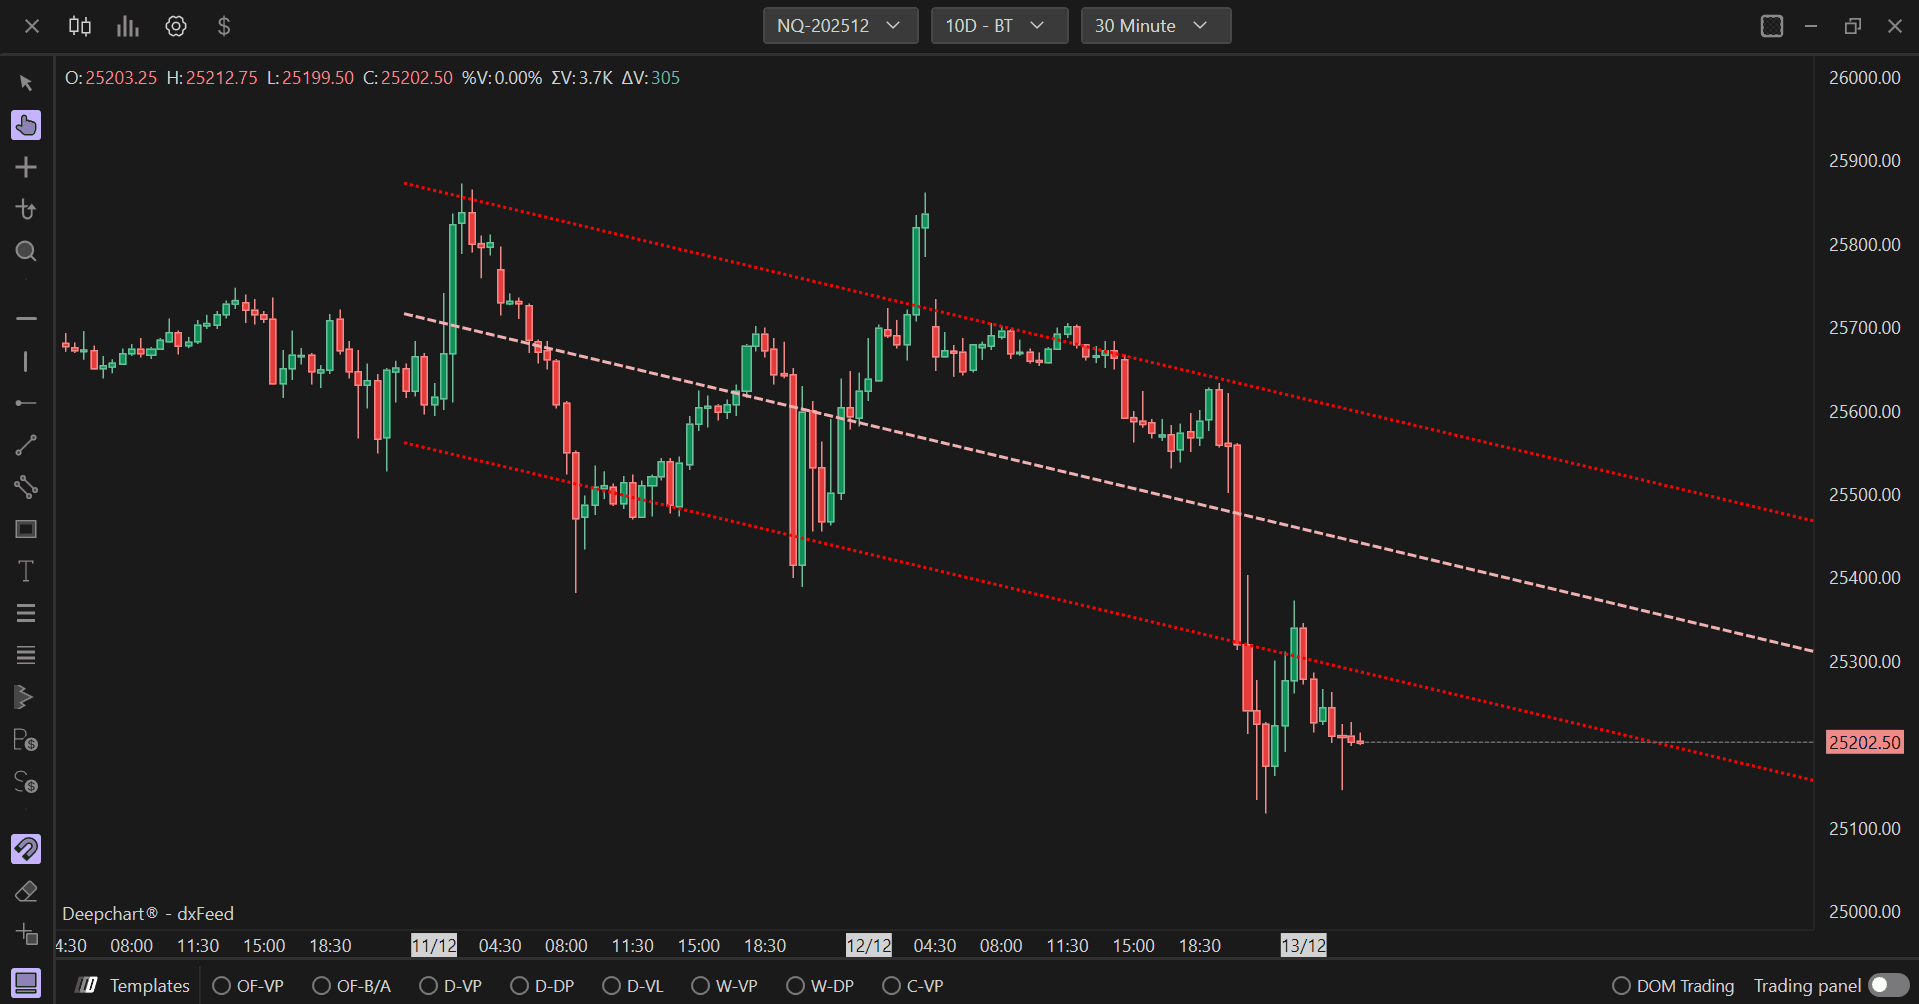
The Regression Channel is a tool used to identify trends and areas of support and resistance. It is a type of channel based on the linear regression model and is composed of a central trend and its deviations.
Using Settings
Clicking on the indicator settings icon will open its configuration window, within which you can make several choices regarding the indicator's functionality.
General
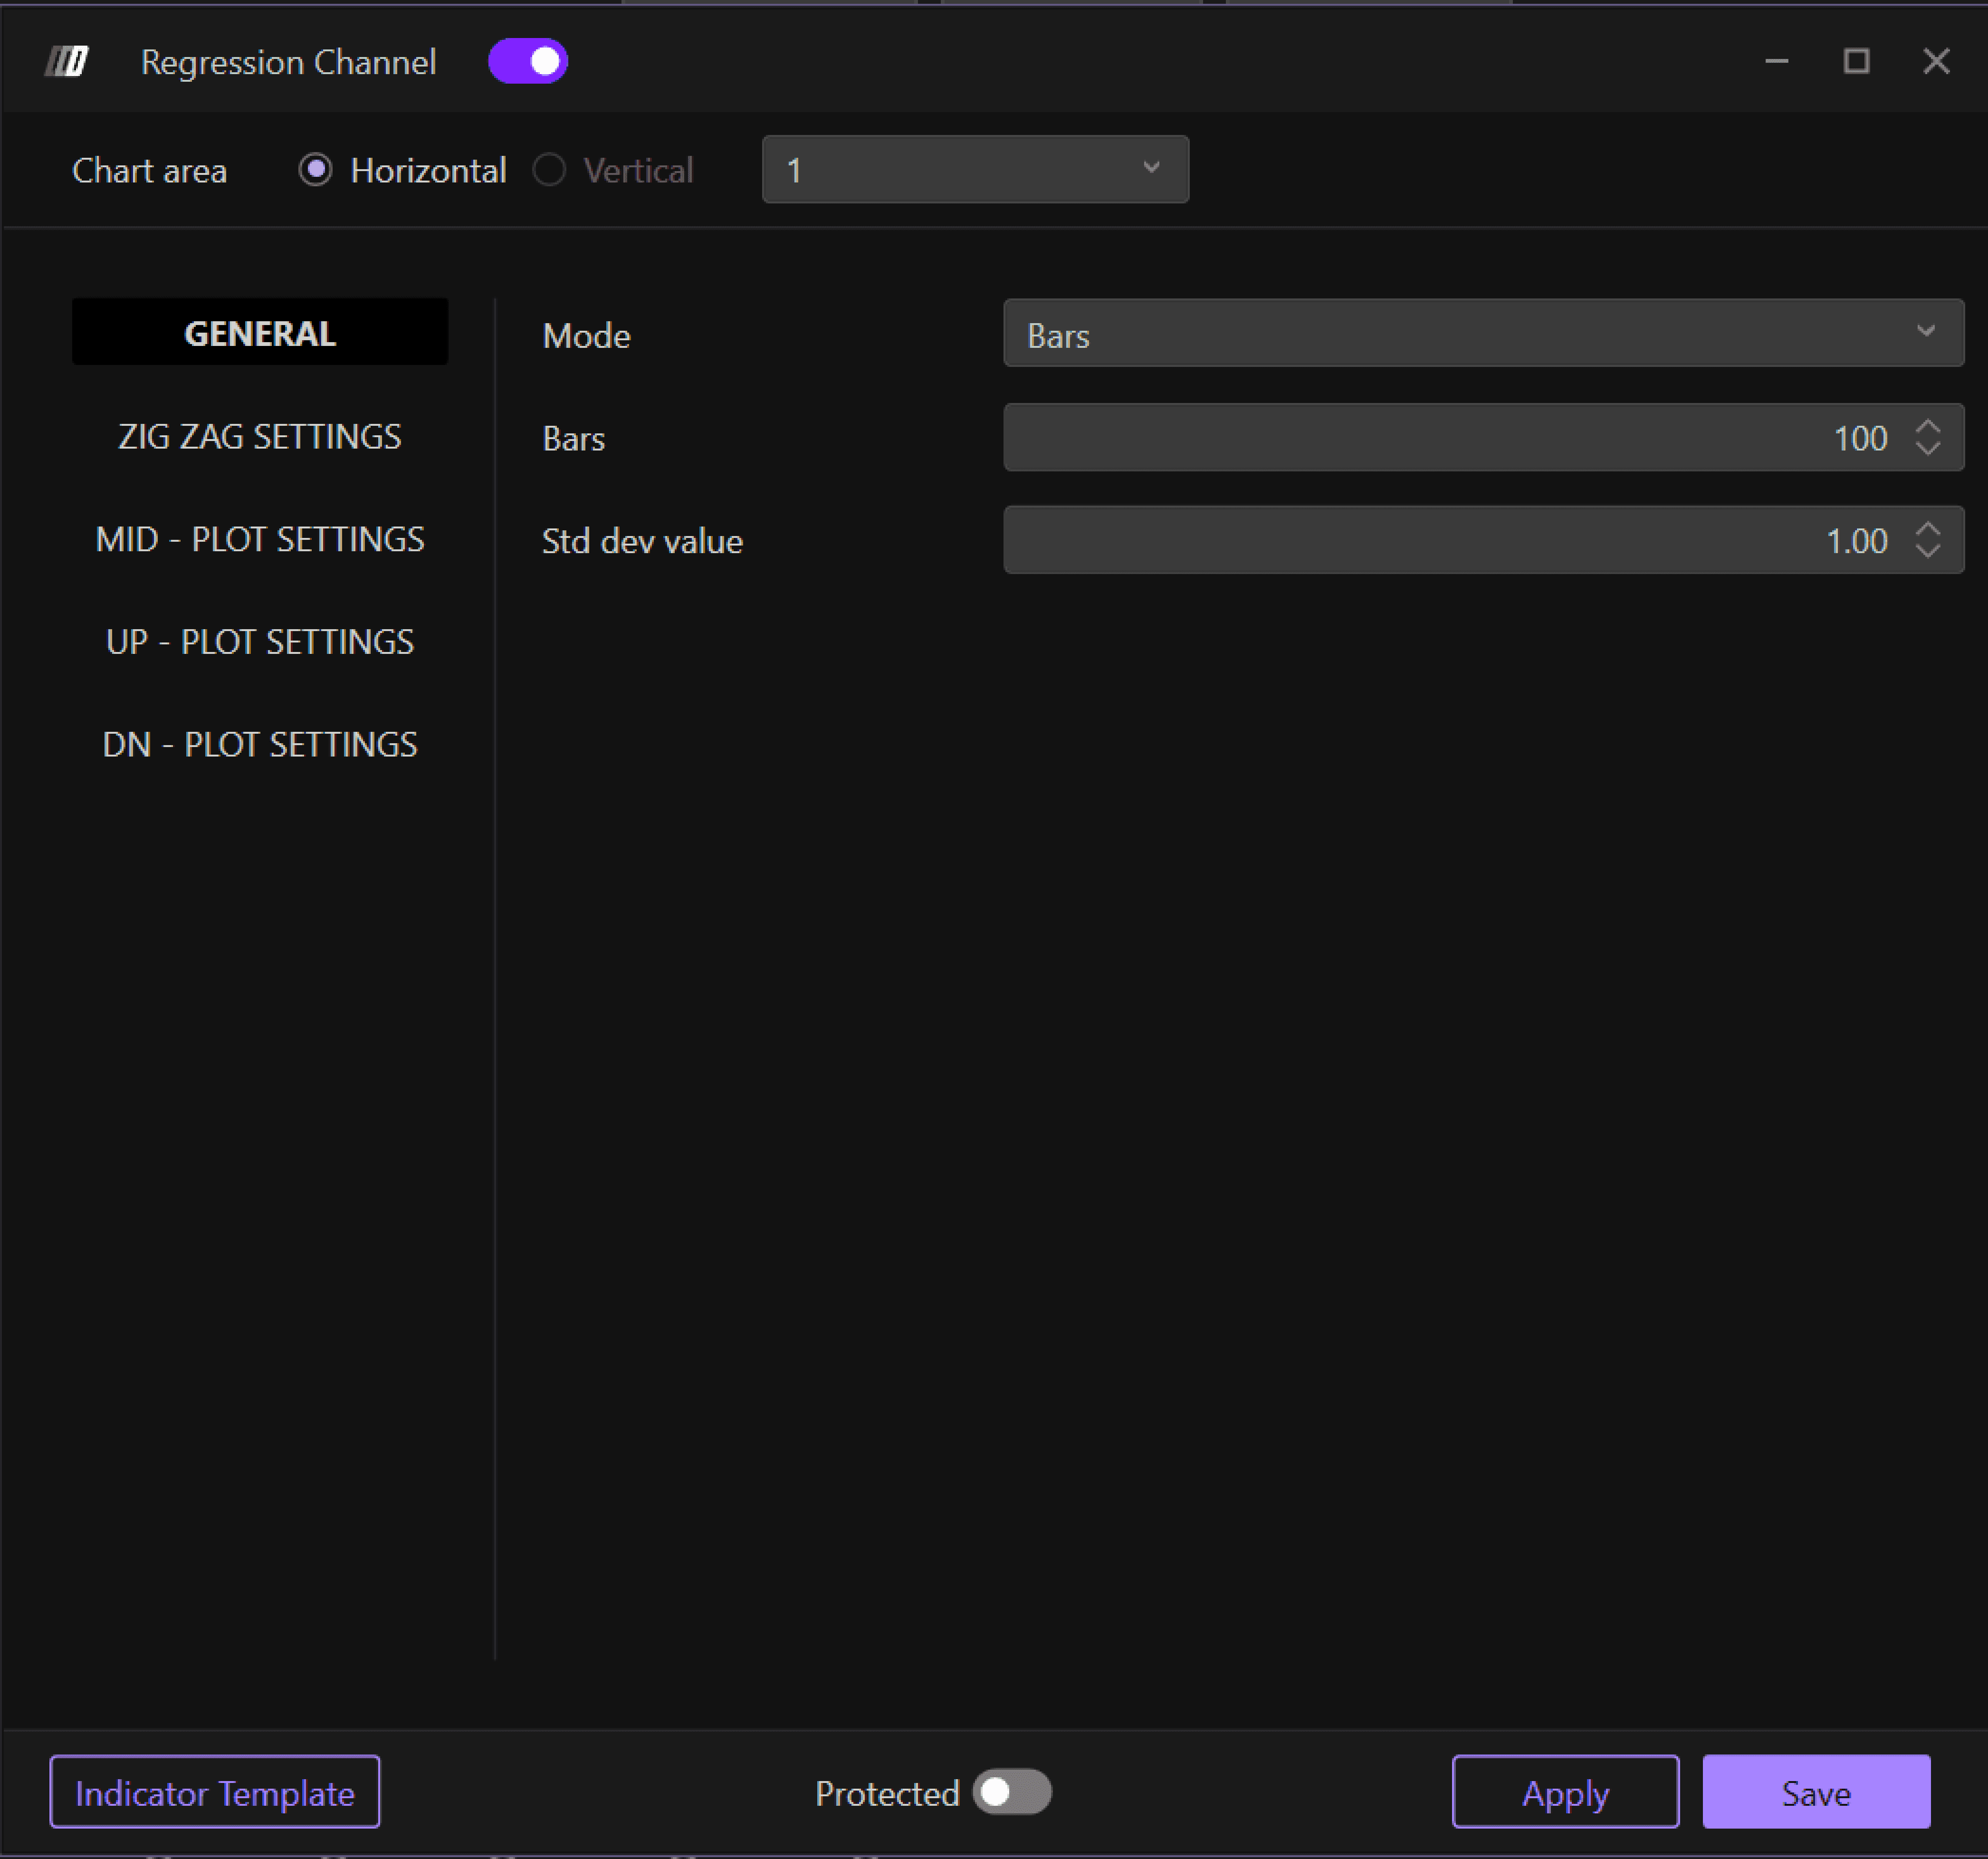
Allows you to change the mode of the indicator and choose the value of standard deviations:
Mode: Choose the channel mode
Value Dev. Std.: Set the standard deviation value for the channel bands (default: 1.00)
Bars: Set the number of bars for the calculation (default: 100)
Zig Zag Settings
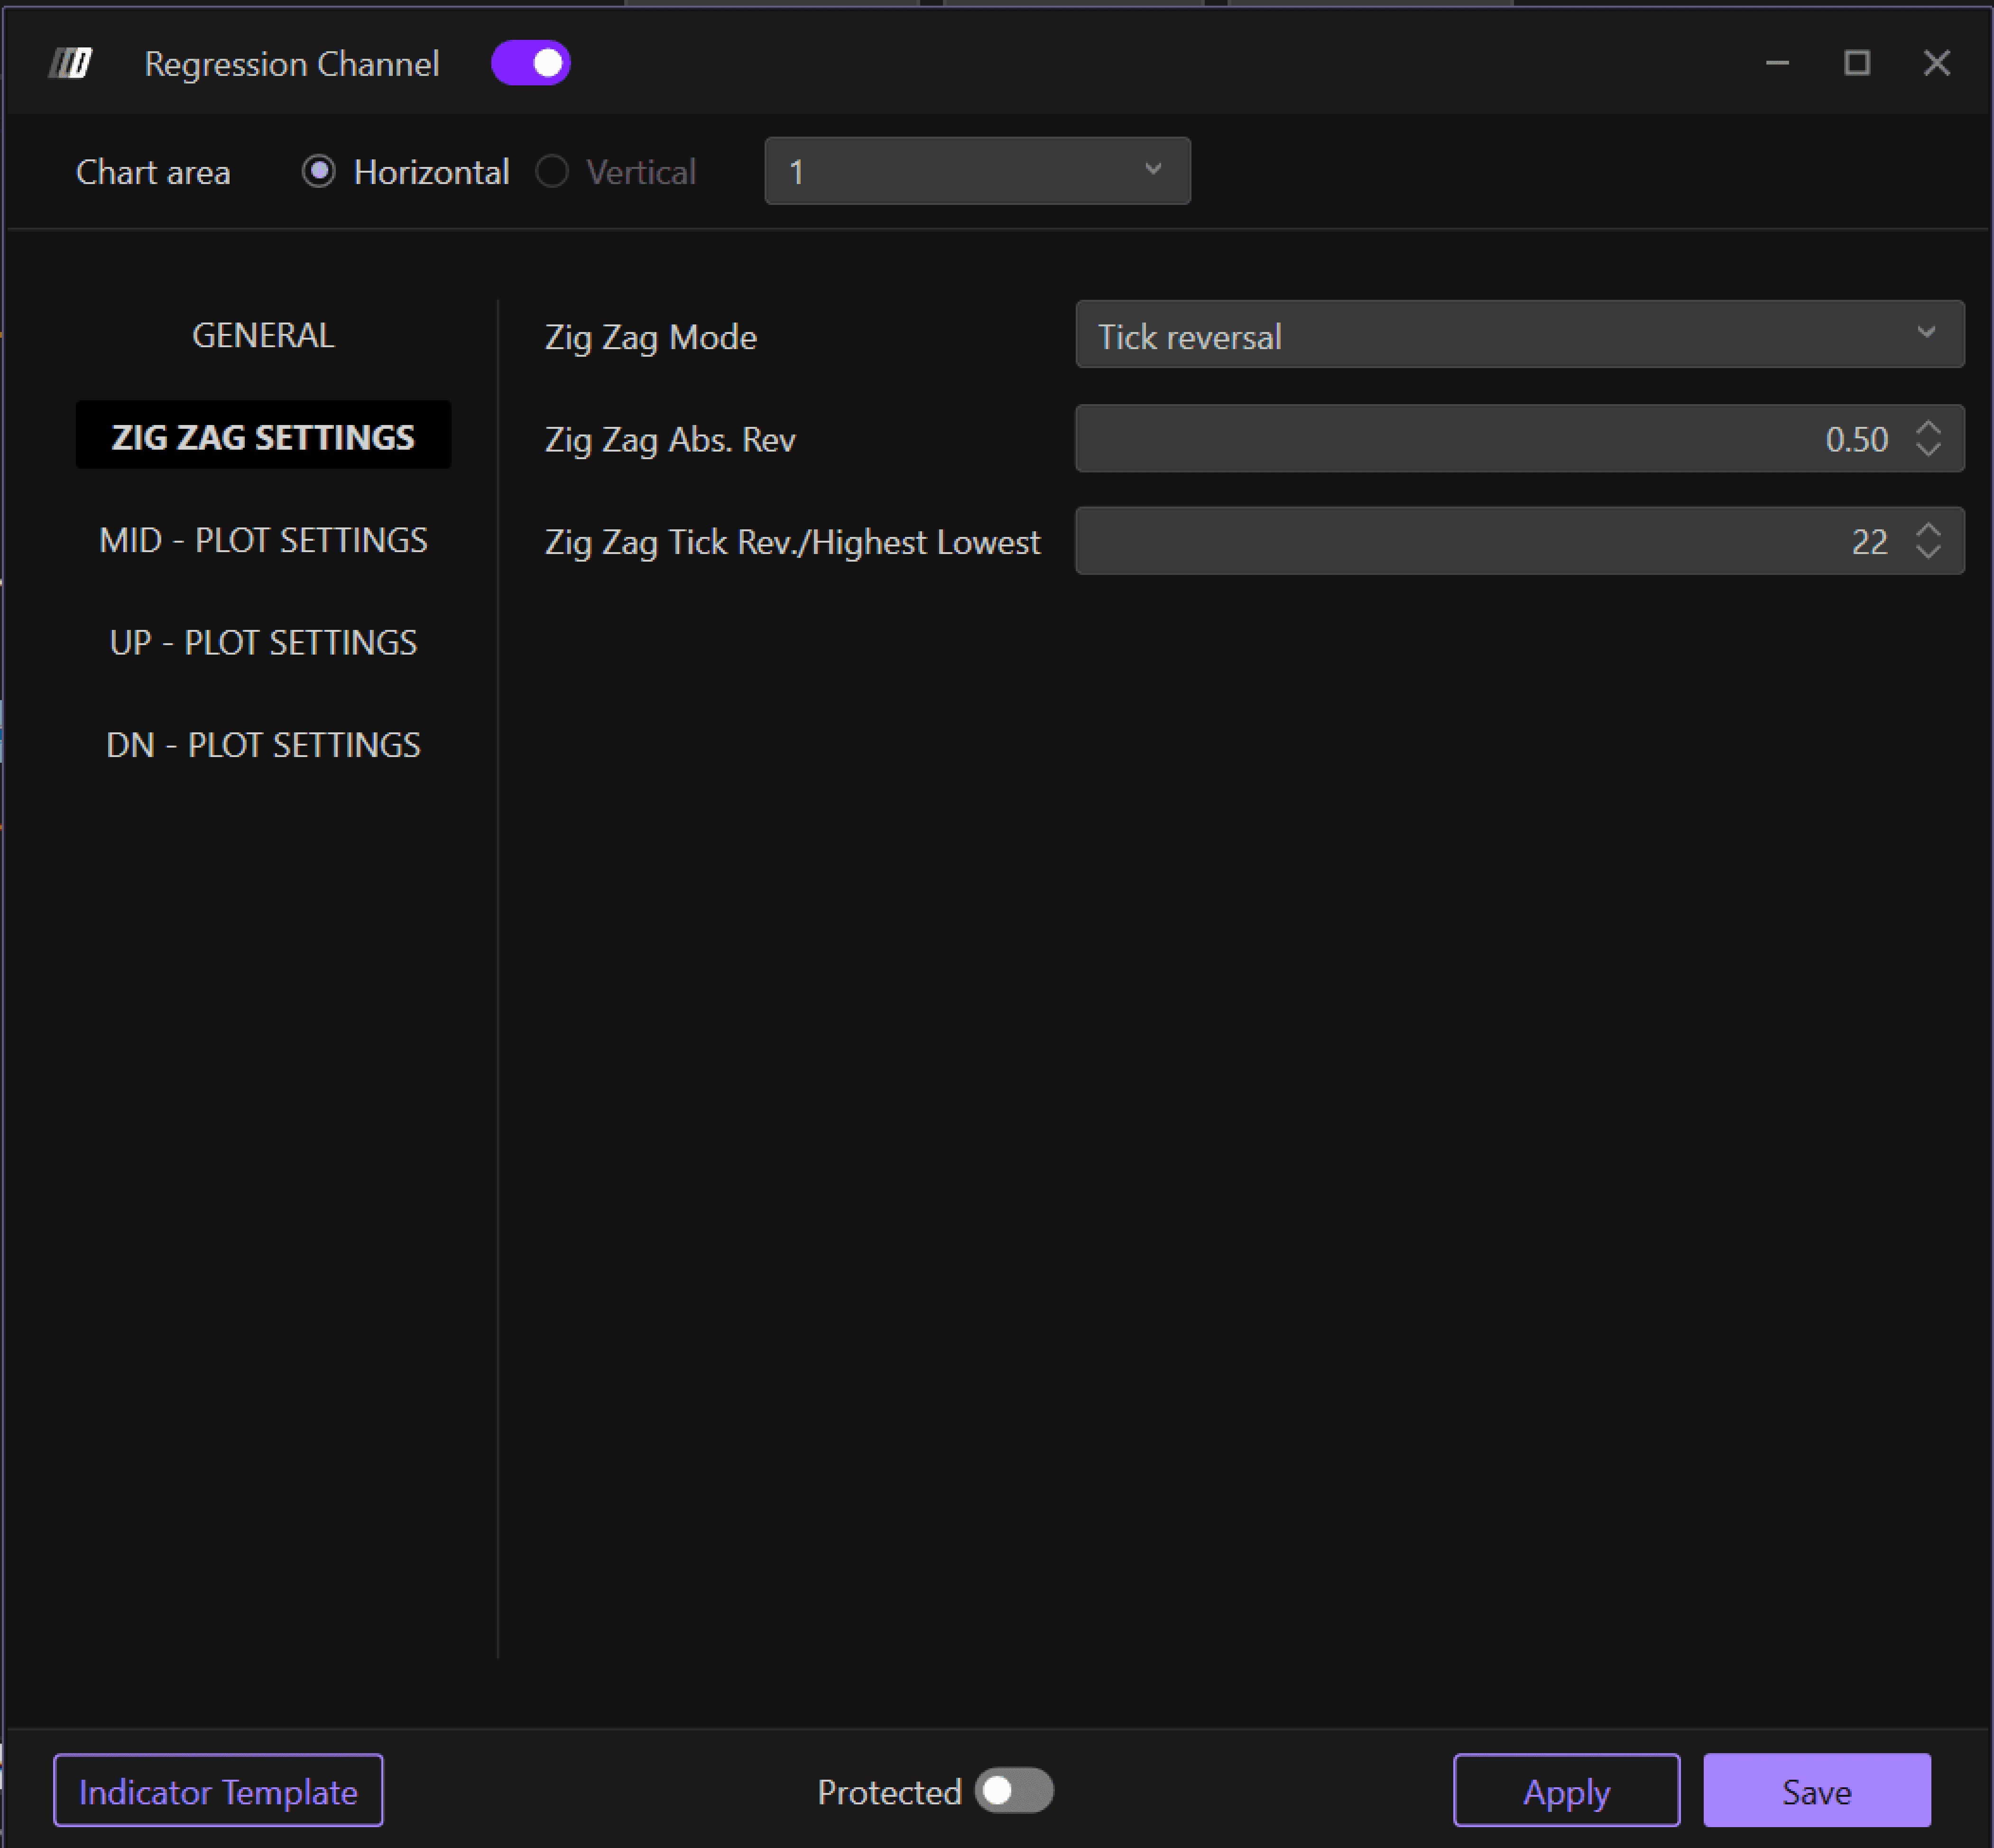
Allows you to change the orientation of the channel when set in Zig Zag mode:
Zig Zag Mode: Enable or configure Zig Zag pattern detection
Zig Zag Abs.Rev: Set the tick reversal threshold (default: 0.50)
Zig Zag Tick Rev./Highest-Lowest: Set the reversal value (default: 22)
MID - Center Line Plot Settings
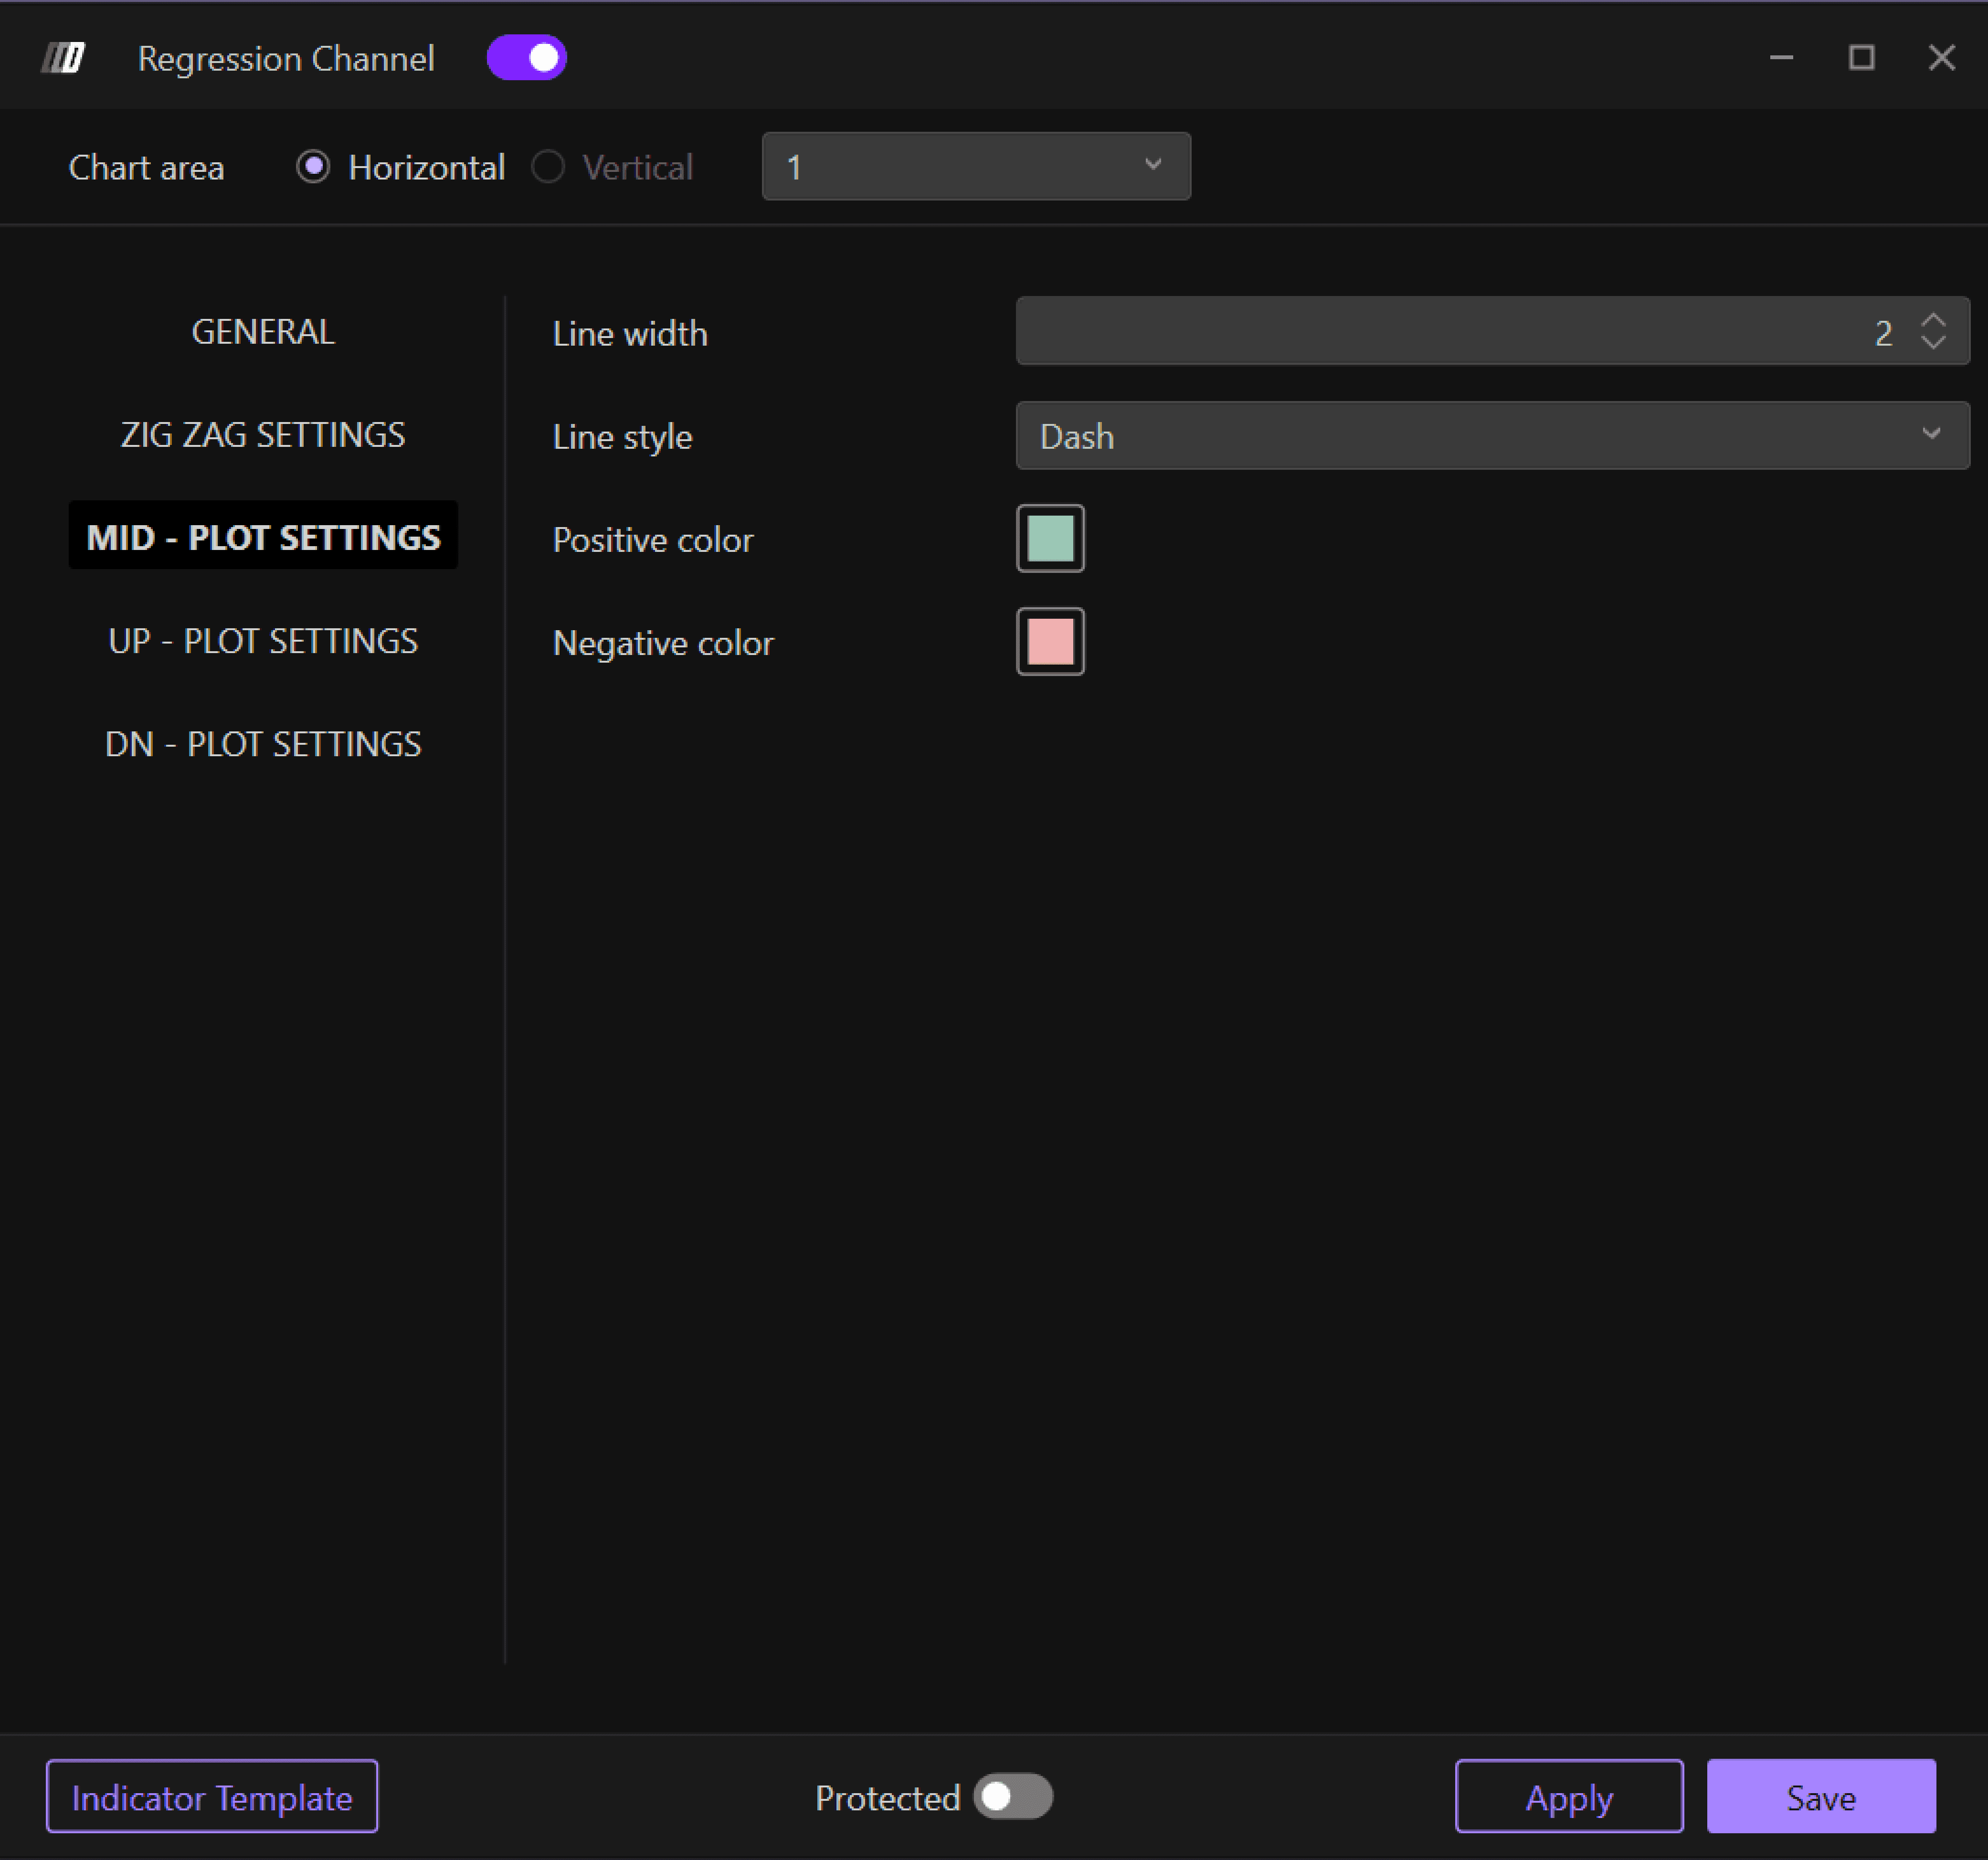
Change colors and style of the centerline:
Line Width: Define the width of the centerline (default: 2)
Line Style: Choose the line style (Solid, Dashed, Dotted, etc.)
Positive Color: Color for uptrends
Negative Color: Color for downtrends
UP - Upper line Plot Settings
Change colors and style of the top line:
Line Width: Define the width of the upper line (default: 2)
Line Style: Choose the line style (Solid, Dashed, Dotted, etc.)
Positive Color: Color for uptrends
Negative Color: Color for downtrends
DN - Lower Line Plot Settings
Change colors and style of the bottom line:
Line Width: Define the width of the lower line (default: 2)
Line Style: Choose the line style (Solid, Dashed, Dotted, etc.)
Positive Color: Color for uptrends
Negative Color: Color for downtrends