Indicators
Updated:
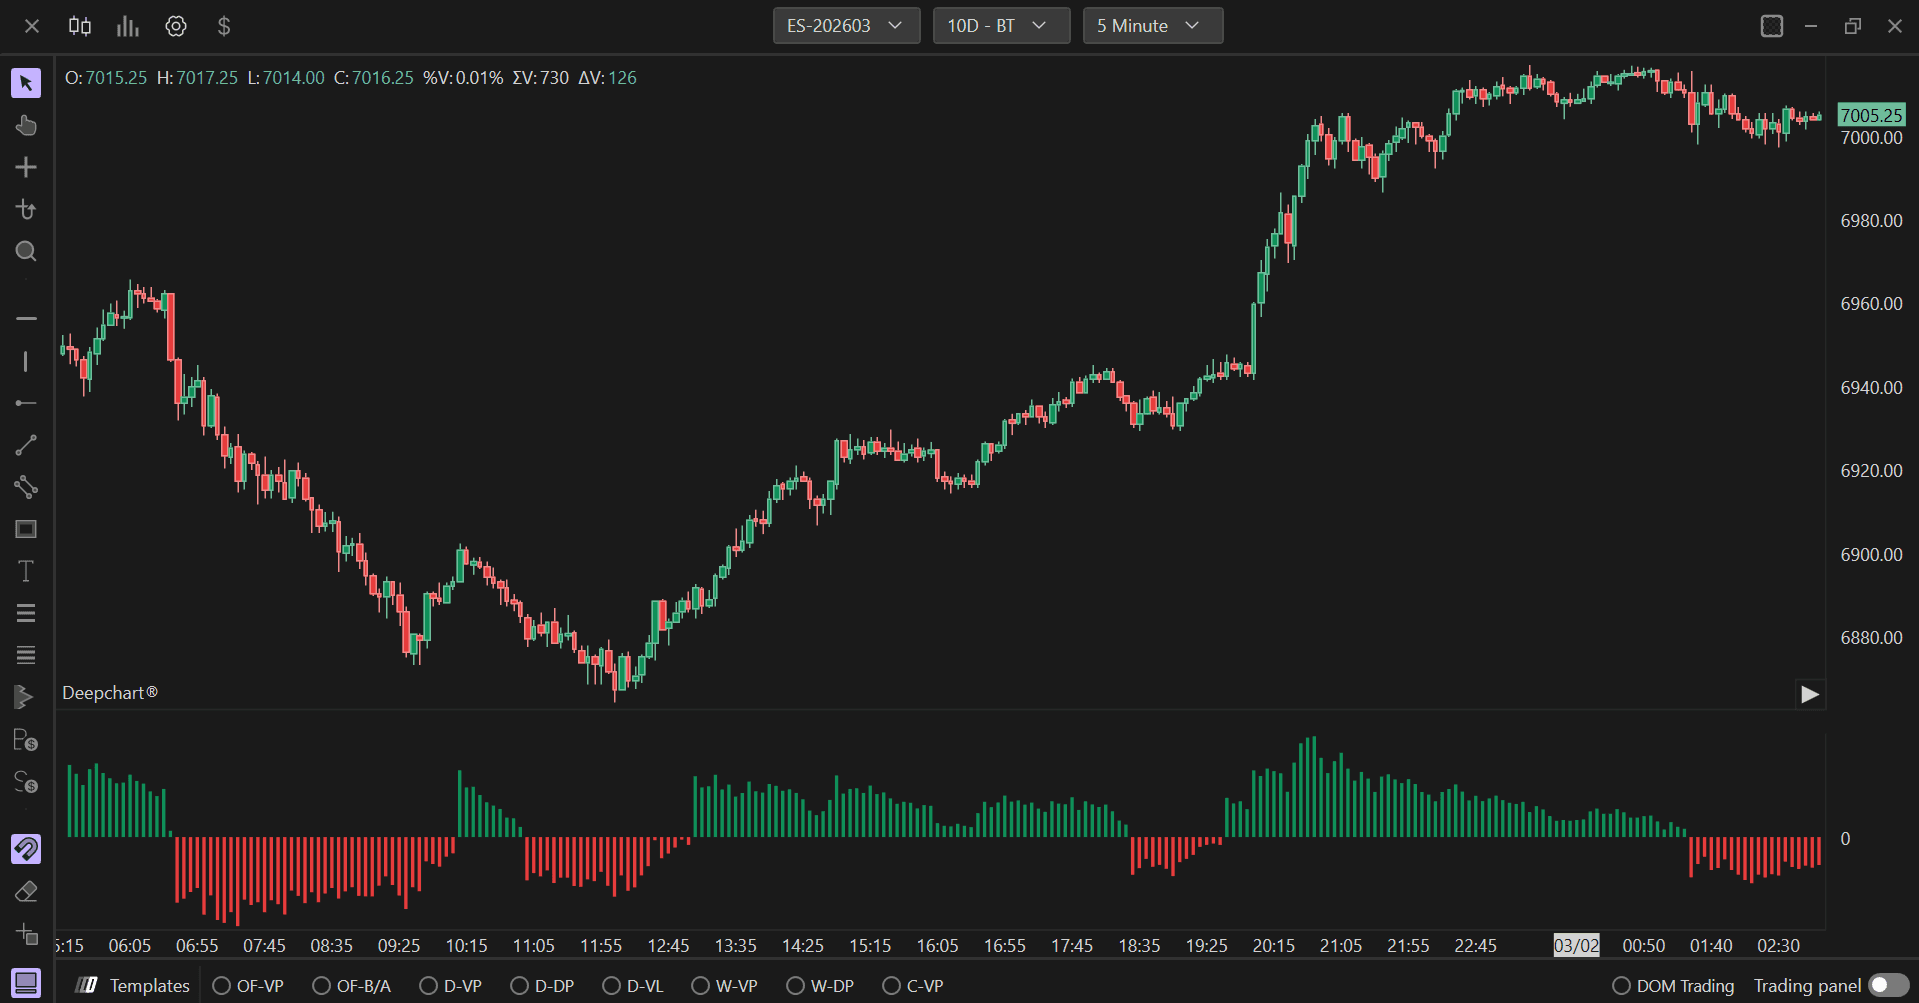
The Super Trend Difference indicator displays the difference between the current price and the Super Trend line as a histogram in a separate panel. This visualization helps traders quickly assess the strength and distance of price movements relative to the trend, providing insights into momentum and potential reversal points.
Settings of Use
Clicking on the indicator's settings icon will open its configuration window, within which it will be possible to make several choices regarding the functionality of the indicator itself.
General Parameters
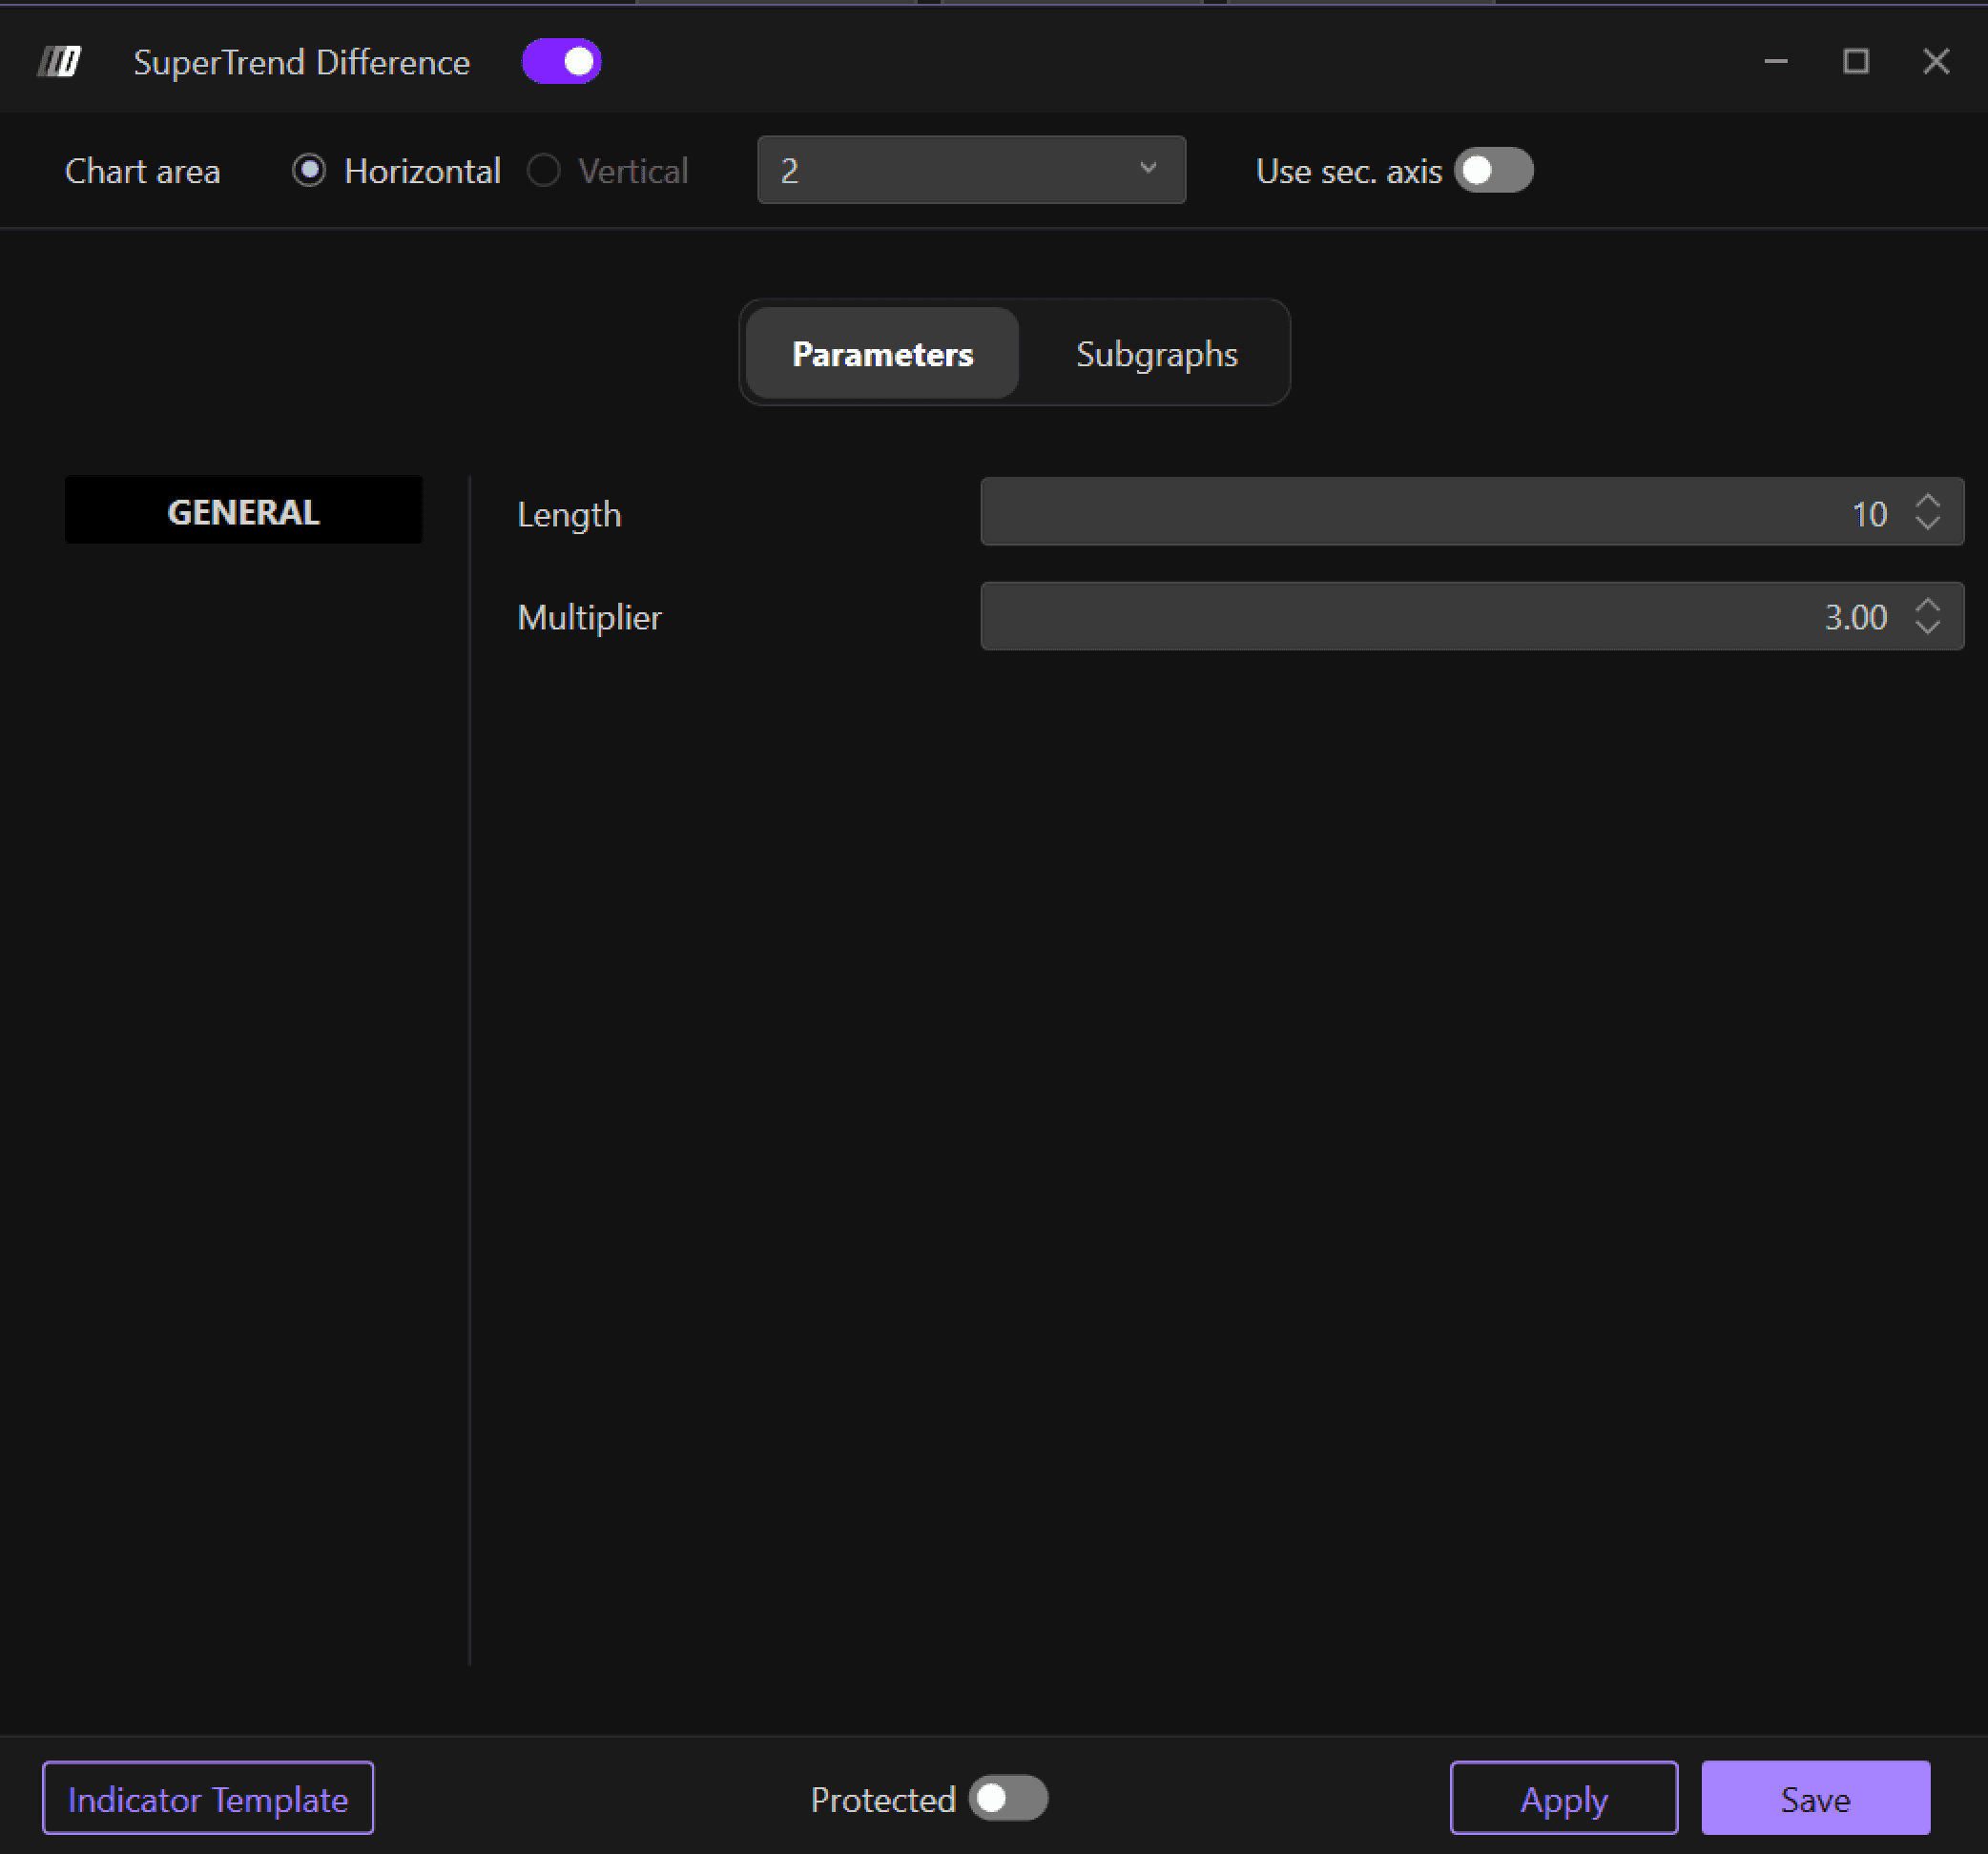
Length
Defines the period length for calculating the Average True Range (ATR), which is used to determine the Super Trend calculation. The default value is 10. A higher length value makes the calculation less sensitive to short-term price fluctuations, while a lower value increases sensitivity and responsiveness to recent price changes.
Multiplier
Sets the multiplier for the ATR value, which determines the distance of the Super Trend line from the price. The default value is 3.00. This parameter directly affects the sensitivity of the Super Trend calculation and consequently the difference values displayed in the histogram. Higher multiplier values result in larger differences, while lower values show smaller differences between price and the trend line.
Chart Settings
Chart Area
Allows you to select whether to display the indicator in a horizontal or vertical layout. You can choose:
Horizontal: Displays the Super Trend Difference histogram in a horizontal panel below or above the main price chart.
Vertical: Displays the indicator in a separate vertical panel alongside the chart.
Use Sec. Axis
When enabled, the indicator will use a secondary axis for plotting. This is particularly useful when displaying the Super Trend Difference in panel 2 or other separate chart areas, allowing for independent scaling and better visualization of the difference values without interfering with the main price chart scale.
Subgraphs
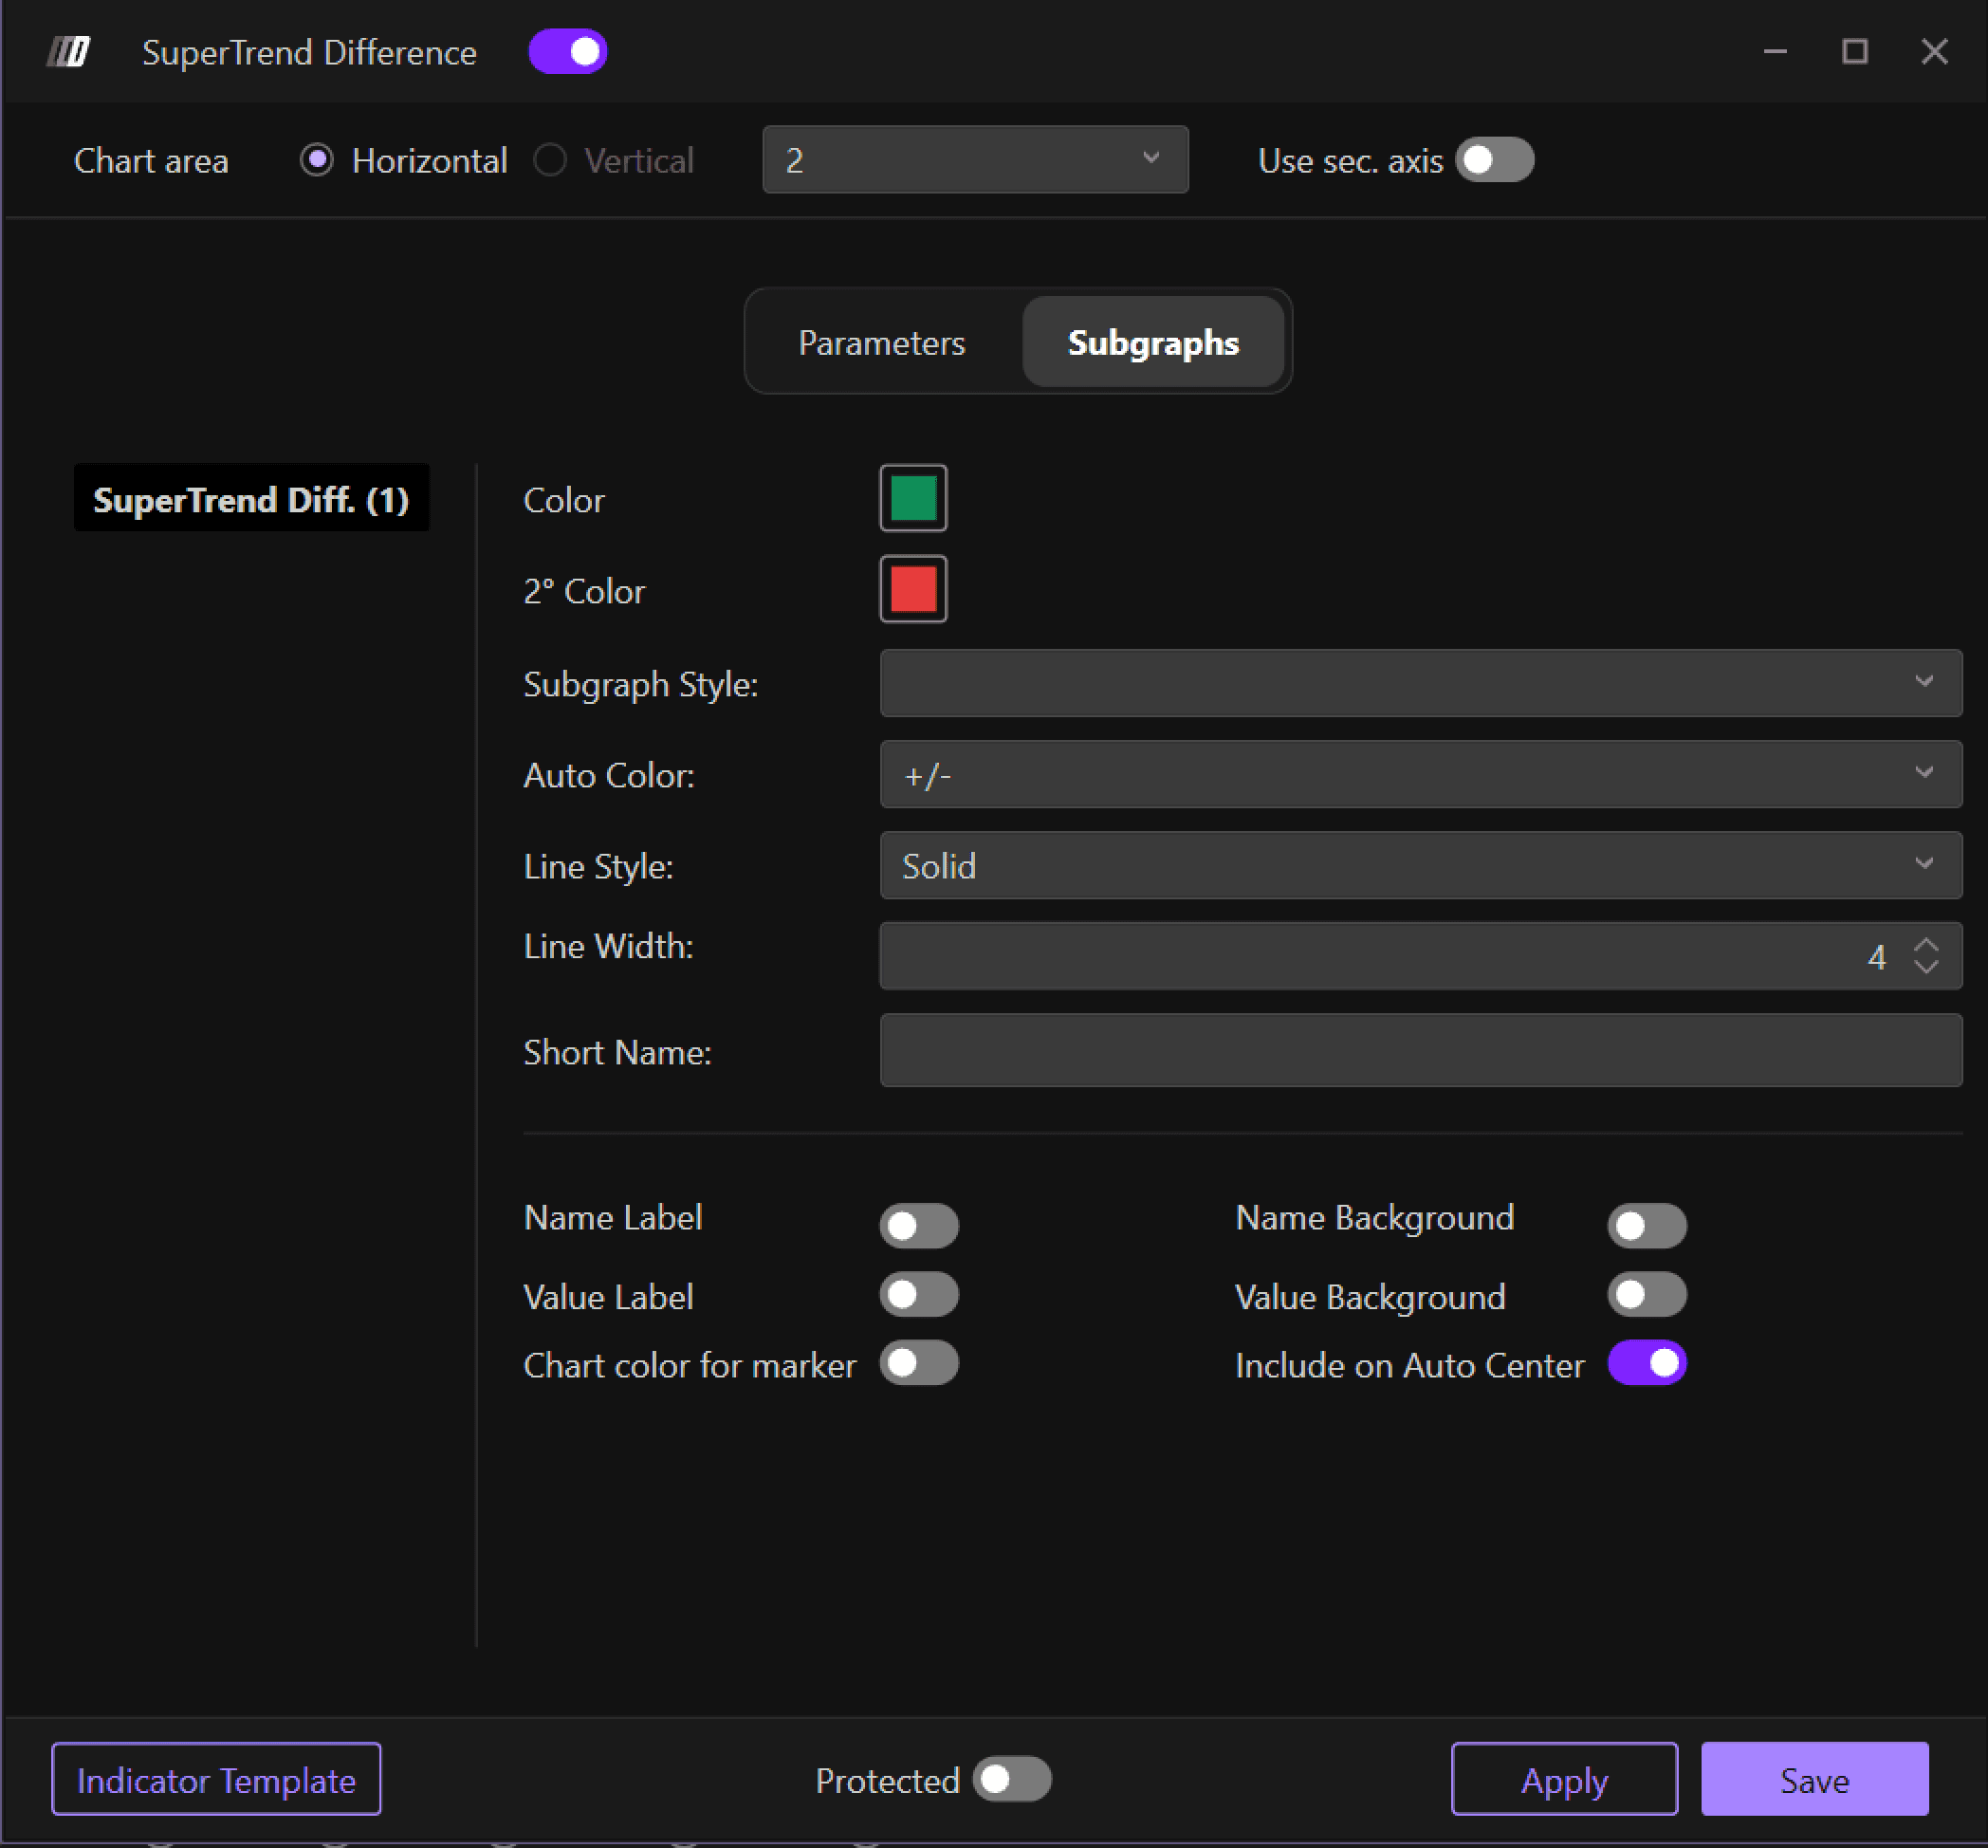
Color
Sets the primary color for the histogram bars when the difference is positive (price above the Super Trend line). This typically indicates bullish conditions and helps visually identify when price is trading above the trend.
2° Color
Sets the secondary color for the histogram bars when the difference is negative (price below the Super Trend line). This typically indicates bearish conditions and helps visually identify when price is trading below the trend.
Subgraph Style
Allows you to select the visual style of the indicator display. The default option displays the data as a histogram with vertical bars, making it easy to see the magnitude and direction of the difference at each point in time.
Auto Color
Defines how the histogram bars are colored. The "+/-" setting automatically assigns colors based on whether the difference value is positive or negative, using the Color and 2° Color settings respectively. This provides immediate visual feedback on the relationship between price and the Super Trend line.
Line Style
Defines the style of the histogram bars. The default is "Solid" for filled bars. Other options may include outlined or other visual patterns to customize the appearance of the indicator.
Line Width
Adjusts the width of the histogram bars. The default value is 4. Increasing this value makes the bars wider and more prominent, while decreasing it creates thinner bars. The width setting can help improve visibility depending on your chart timeframe and zoom level.
Short Name
Allows you to set a custom short name or label for the indicator that will appear on the chart legend. This is useful for quickly identifying the indicator when multiple tools are displayed simultaneously, especially helpful when running multiple variations with different parameters.